
yFiles Graphs for StreamlitThe powerful Python graph library for Streamlit

Elevate Your Streamlit Apps with Intuitive Graphing Tools
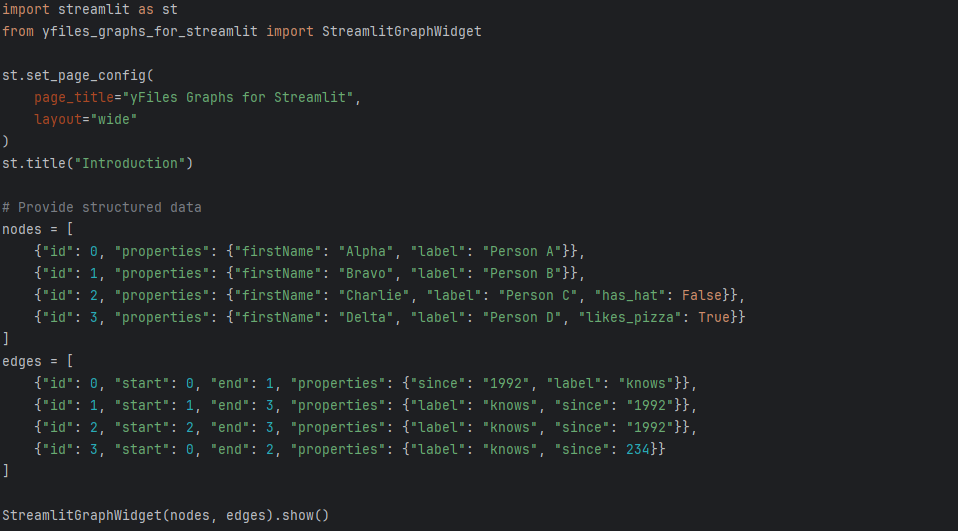
yFiles Graphs for Streamlit is a free Python diagram library component for Streamlit Apps. It can import structured data from popular Python graph packages like NetworkX, igraph, PyGraphviz, Neo4j, or any structured list of nodes and edges.
Powerful layout algorithms from the established yFiles SDK are included. You can easily apply the whole range – organic, hierarchic, tree, orthogonal, circular, and radial – to your graph structure. A suitable, clear visualization helps you gain a better understanding of your data.
The component includes interactive features such as automatic layouts, item-level neighborhood exploration, detailed data views, and search capabilities. Aside from interactive features, it also provides a Python API to enable data-driven styling and integrate high-performance layout algorithms to embed a high-fidelity rendering into your Streamlit apps.
What to expect on this page
Why use yFiles Graphs for Streamlit?
Import and Visualize
Import from popular Python graph packages and create revealing yet concise visualizations. Just pass the graph data of NetworkX, graph-tool, igraph, PyGraphviz, or structured node and edge lists to the component and interactively explore your network.
Automatic Layouts
Benefit of yFiles' superior automatic layout algorithms. Easily arrange your graph with different layout styles: Hierarchic, organic (force-directed), tree, orthogonal, circular, or radial. Each layout style highlights different structural features of the graph and helps you gain new insights into the data.
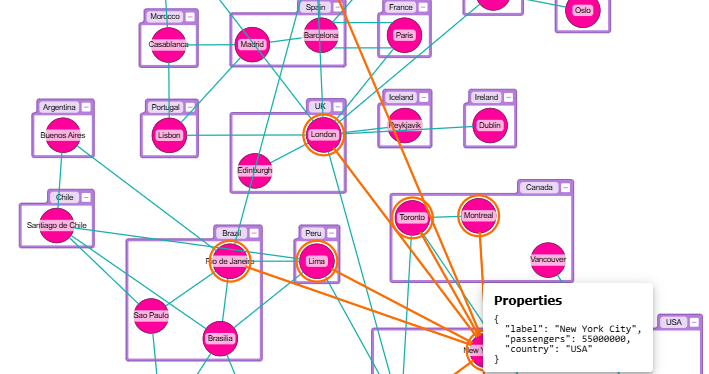
Data-driven mappings
yFiles offers customizable, data-driven mappings for nodes and edges. These mappings let you adjust visual aspects of the diagram - like color, scale, and edge thickness - as well as structural aspects like an item label or position.
Features
Choose graph layout
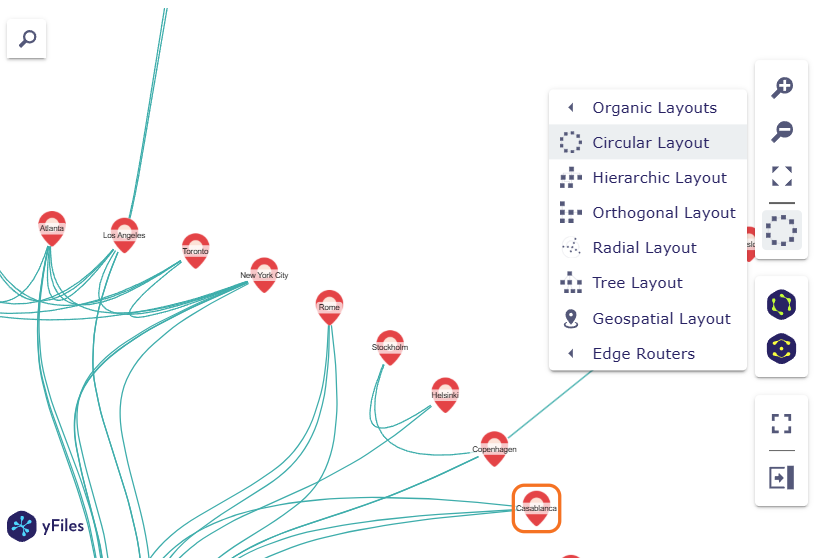
Select a graph layout from the toolbar to rearrange your graph items automatically.
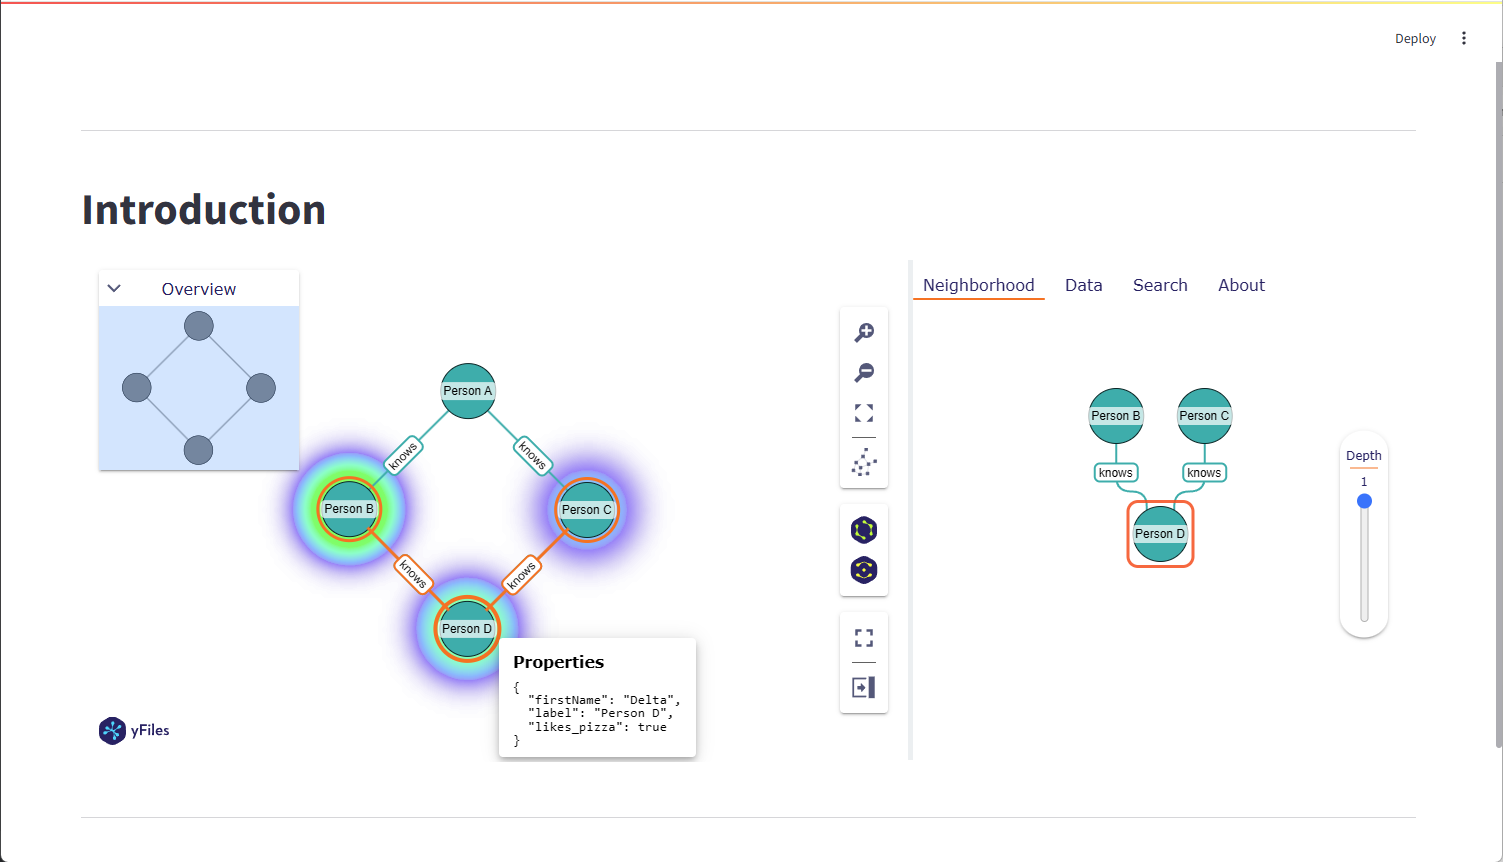
See item neighborhood
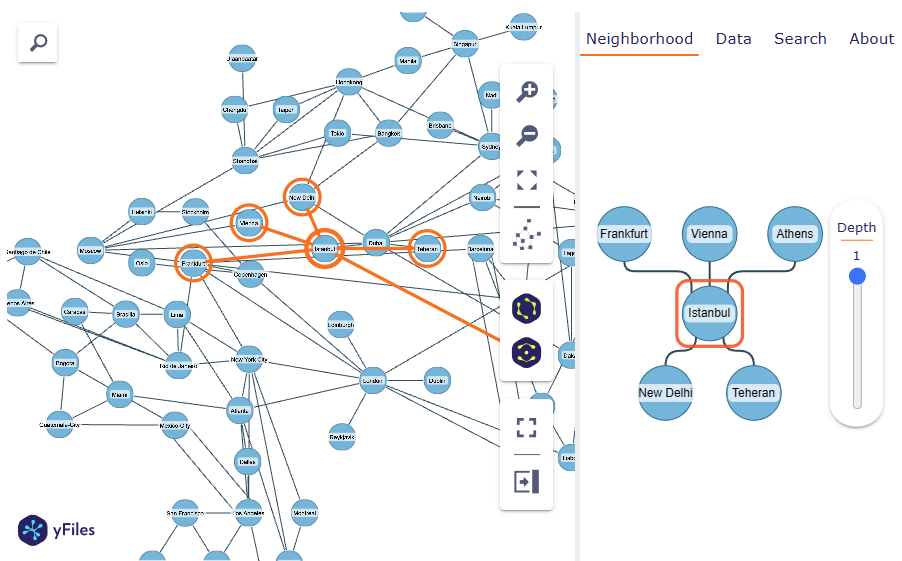
Check the sidebar's Neighborhood tab to explore node connections and view their adjacent items.
Import graph data
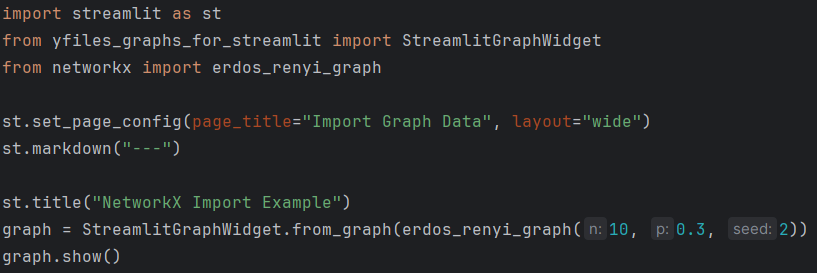
Import your graph data from popular Python packages like NetworkX, igraph, PyGraphviz, Neo4j, or any structured list of nodes and edges.
Data-driven visualization
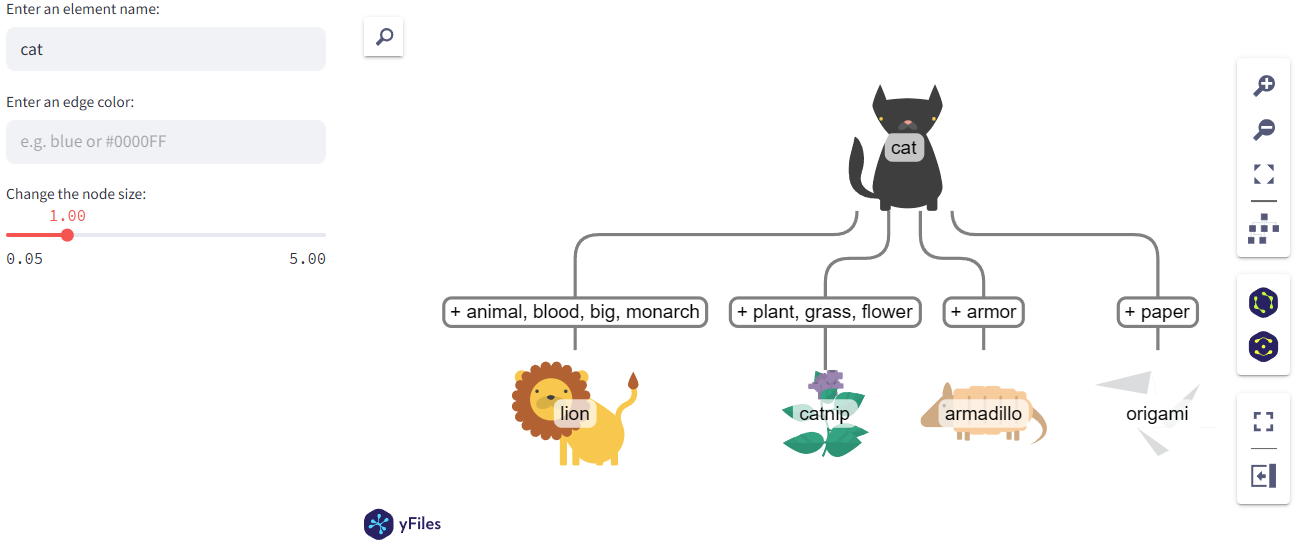
Use your data to adjust the visualization of nodes and edges with versatile data mapping functions.
Visualize data as heatmap
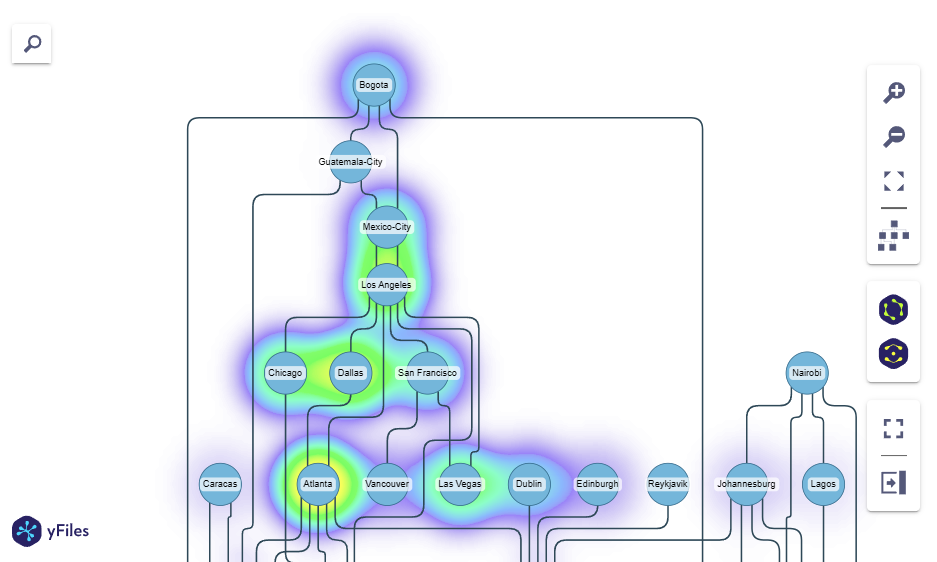
Visualize data as a heatmap overlay for an additional information layer.
Use geospatial data
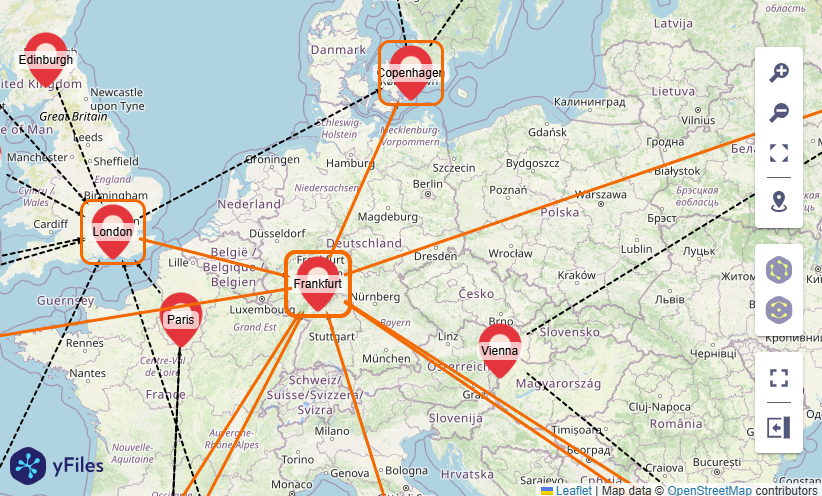
Use geospatial coordinates to display your data on a map.
Grouping support
Visualize hierarchies in your data.
Feedback?
Let us know about your use case and what features you would like to see in the future.
Contact usMore Features
Why use yFiles Graphs for Streamlit with NetworkX?
Seamless integration
Import NetworkX graphs directly without manually converting data structures. The component handles the translation seamlessly, letting you focus on your data analysis.
Full interactivity
Unlike static Matplotlib plots, yFiles graphs are fully interactive. Users can drag nodes, zoom, view details via tooltips, explore node neighborhoods, and instantly switch between different automatic graph layouts.
Professional layouts
Leverage sophisticated algorithms—such as hierarchic, organic, circular, or orthogonal—to automatically arrange even complex networks for maximum clarity and insight.
High performance
Built with WebGL technology, the visualization remains smooth and performant, even when rendering larger datasets and complex graphs.
Free license
Valuable visualizations – at no cost
We are pleased to offer you a perpetual, free, non-transferable license to install and dynamically use this component in your Streamlit apps.
Technical information
yFiles Graphs for Streamlit is an extension for Streamlit Apps
It is based on yFiles - the superior diagramming SDK. You can try a fully-functional version of yFiles free of charge. Explore the whole scope of graph drawing and integrate interactive visualizations into your own software products!
Help
Have more questions?
Find helpful information here:
Frequently Asked Questions
Getting started
Install the yFiles Graphs for Streamlit component with
pip install yfiles_graphs_for_streamlit
Instantiate the component, import structured graph data, and create your own Streamlit App!

you might want to explore


Why, how, what? —Just ask the diagramming experts!

Our team is happy to advise you – no strings attached. Let's talk about your project and find the perfect solution for your needs!
E-mail: hello@yworks.com
Your message has been sent.
Your request could not be sent. Please reload the page and try again.
If the problem persists, please report the error to webmaster@yworks.com.
Learn more in our privacy policy.