The yWorks webinars
Learn about yFiles, yEd and graph drawing

The yWorks webinars are free and suitable for everyone. You can receive an overview of the essential aspects of graph visualization or gain best practices and useful tips for implementation. Check out our webinar schedule to attend an upcoming webinar and ask questions directly to a graph-expert, or find your favorite topic in our numerous recorded webinars. The choice is yours!
Webinars Schedule

Didn't find what you were looking for?
We plan our webinars based on your needs. Send us subjects or questions you would like to see covered in a future webinar.
Recorded Webinars
Getting Started with the Visio Add-on for yFiles
Learn how to effectively export your visualizations to the Visio (.vsdx) format, while exploring key features and best practices to ensure smooth integration of Visio support. Whether you're a developer looking to enhance your web apps or someone interested in advanced visualization techniques, this session provides invaluable knowledge and hands-on tips.
Coach: Lukas Holländer, Teamlead VSDX AddOn for yFiles for HTML
What's new in yFiles for HTML version 3
In this session, our CTO Sebastian will guide you through the brand-new version 3 of yFiles for HTML.
You'll get a comprehensive overview of what's changed with this major milestone and explore the exciting new features that have been added. Sebastian will walk you through the updates our team has implemented over the past 15 months and explain why and where the API has evolved.
Coach: Sebastian Mueller, yWorks CTO
Advanced Graph Visualization for Jupyter Notebooks with Python
In this webinar, you'll learn how to create advanced graph visualizations in Jupyter Notebooks using Neo4j and Graph Data Science. We’ll explore techniques for analyzing and visualizing complex temporal and spatial data through real-world examples. You’ll discover how to transform raw data into meaningful insights, effectively visualize connected data, and address common challenges in graph analysis with Python.

Interactive Graph Editing for Developers
Discover the fascinating world of graph visualization in our webinar series, 'The Art of Graph Visualization'. In this series, you will learn techniques to create compelling graph visualizations.
In the ninth webinar, 'Interactive Graph Editing for Developers', explore advanced programming examples and hands-on insights for creating and modifying graphs interactively. Perfect for both seasoned developers and beginners, this session will deepen your understanding and empower you to integrate graph visualization effectively into your applications.

Interaction and Animation Techniques for Developers
Discover the fascinating world of graph visualization in our webinar series, 'The Art of Graph Visualization'. In this series, you will learn techniques to create compelling graph visualizations.
In the eight webinar, 'Interaction and Animation Techniques for Devs', you'll explore advanced programming examples and hands-on insights. Perfect for both seasoned developers and beginners, this session will deepen your understanding and empower you to integrate graph visualization effectively into your applications.

The ABCs of Graph Styling for Developers
Discover the fascinating world of graph visualization in our webinar series, 'The Art of Graph Visualization'. In this series, you will learn techniques to create compelling graph visualizations.
In the seventh webinar, 'The ABCs of Graph Styling for Devs', you'll explore advanced programming examples and hands-on insights. Perfect for both seasoned developers and beginners, this session will deepen your understanding and empower you to integrate graph visualization effectively into your applications.

Graph Analysis and Layout for Developers
Discover the fascinating world of graph visualization in our webinar series, 'The Art of Graph Visualization'. In this series, you will learn techniques to create compelling graph visualizations.
In the sixth webinar, 'Graph Analysis and Layout for Devs', you will learn advanced techniques for visualizing complex graph data through practical examples and hands-on exercises.
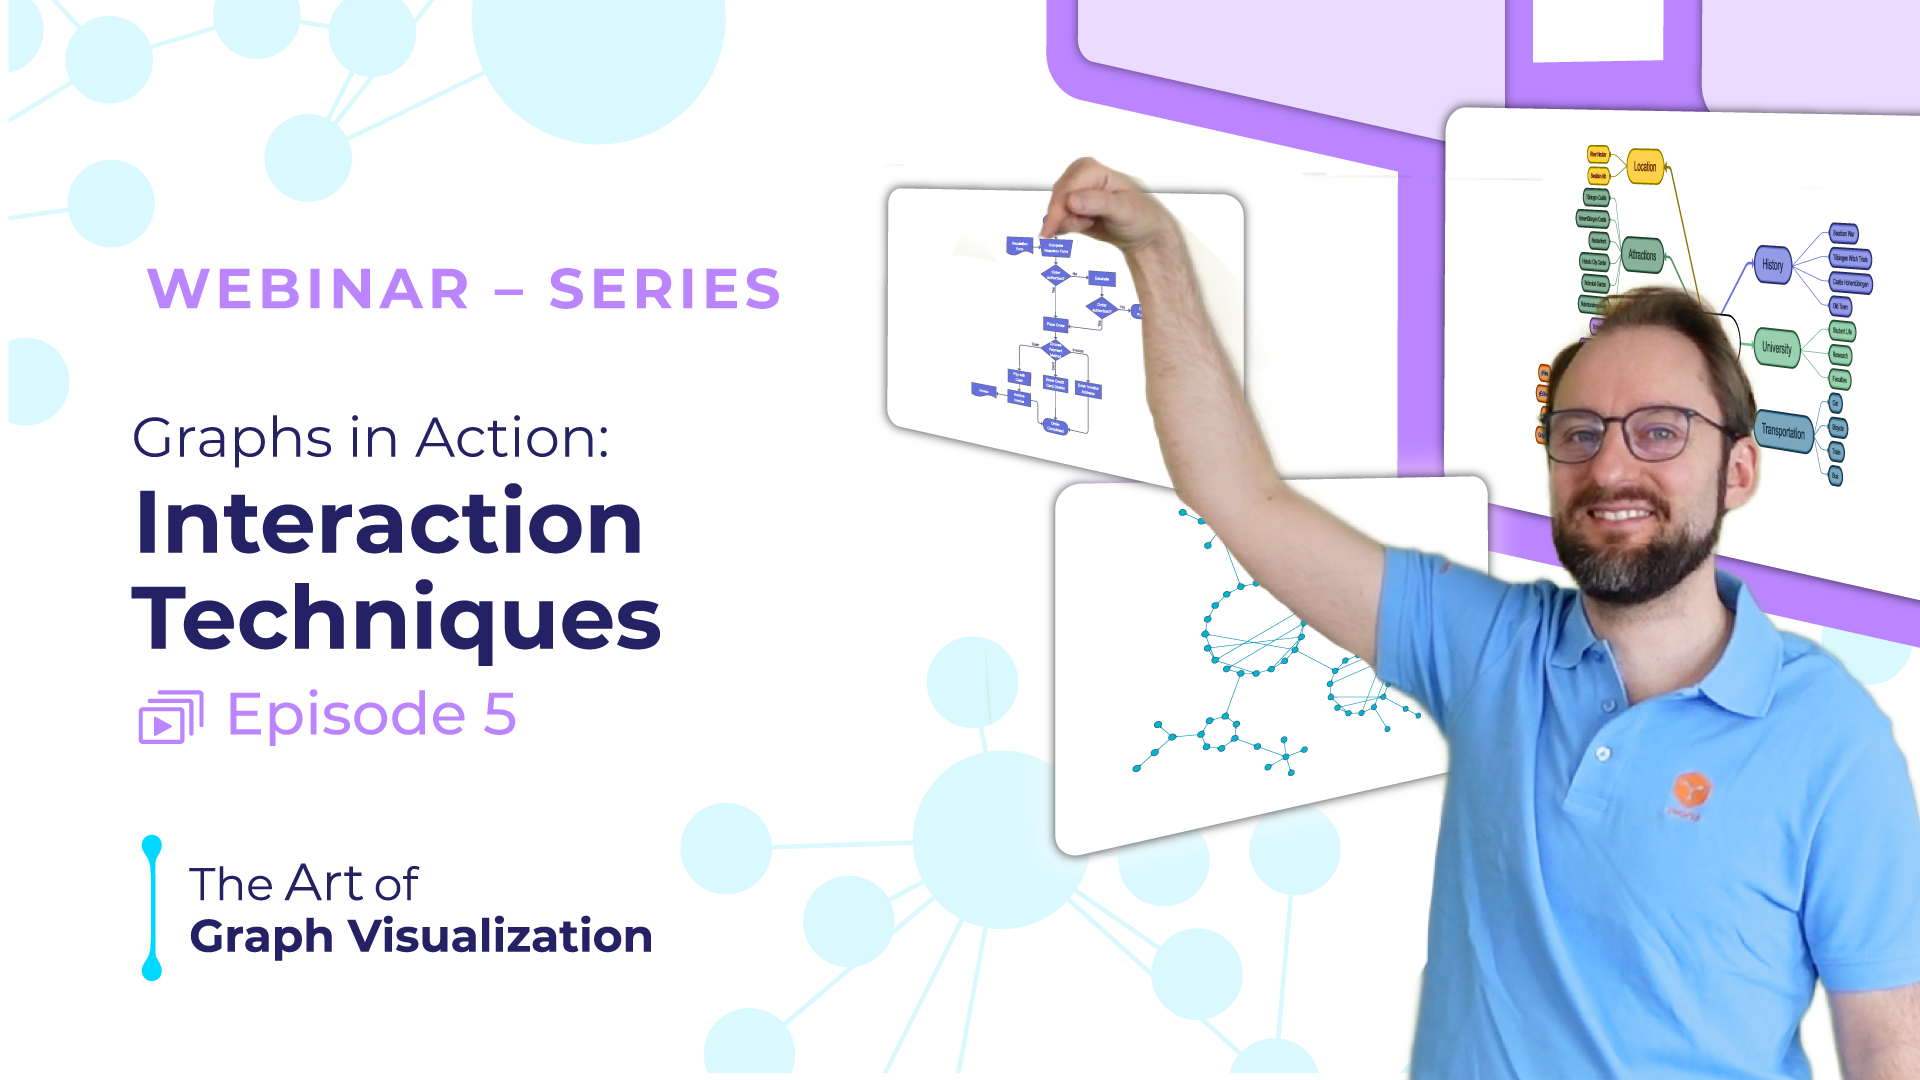
Interaction Techniques
Discover the fascinating world of graph visualization in our webinar series, 'The Art of Graph Visualization'. In this series, you will learn techniques to create compelling graph visualizations.
In the fifth webinar, 'Interaction Techniques', you will discover the art of embedding insightful interactions into your graphs. From hover effects to clickable nodes, unlock the power of interactive elements to enhance user engagement and provide a deeper understanding of your data.
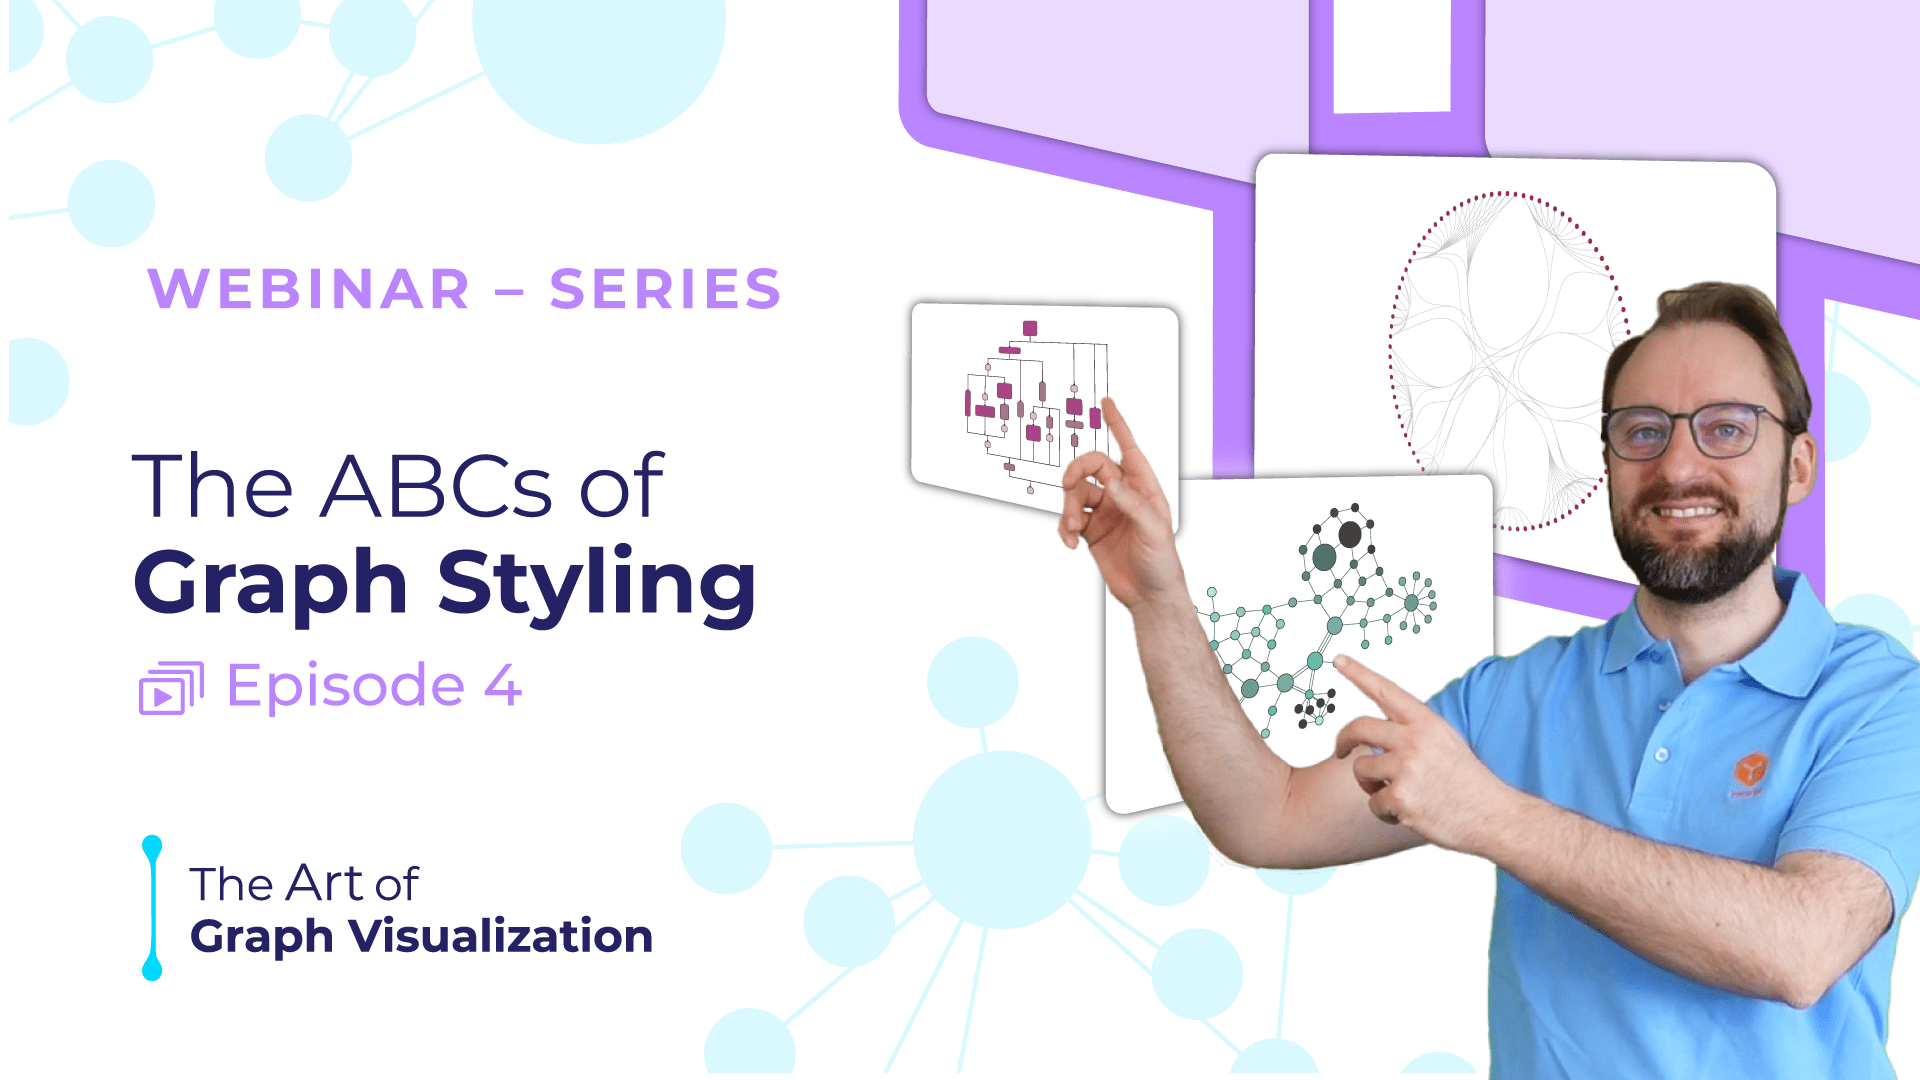
The ABCs of Graph Styling
Discover the fascinating world of graph visualization in our webinar series, 'The Art of Graph Visualization'. In this series, you will learn techniques to create compelling graph visualizations.
In the fourth webinar, 'The ABCs of Graph Styling', you'll explore the intricate world of styling graph visualizations to seamlessly integrate information into your graphs. Uncover the art of using color, shapes, and animations as powerful annotations, transforming raw data into a rich narrative.
Key topics covered:
- Visualization Learn about the structure of graph visualizations and their elements.
- Visual Encoding Master the art of color, shape, size, and animation to bring your data to life.
- Principles Discover the importance of consistency, simplicity, hierarchy, and Gestalt in creating effective visualizations.
- Technologies Explore the use of HTML, CSS, SVG, and WebGL to elevate your graph styling techniques.
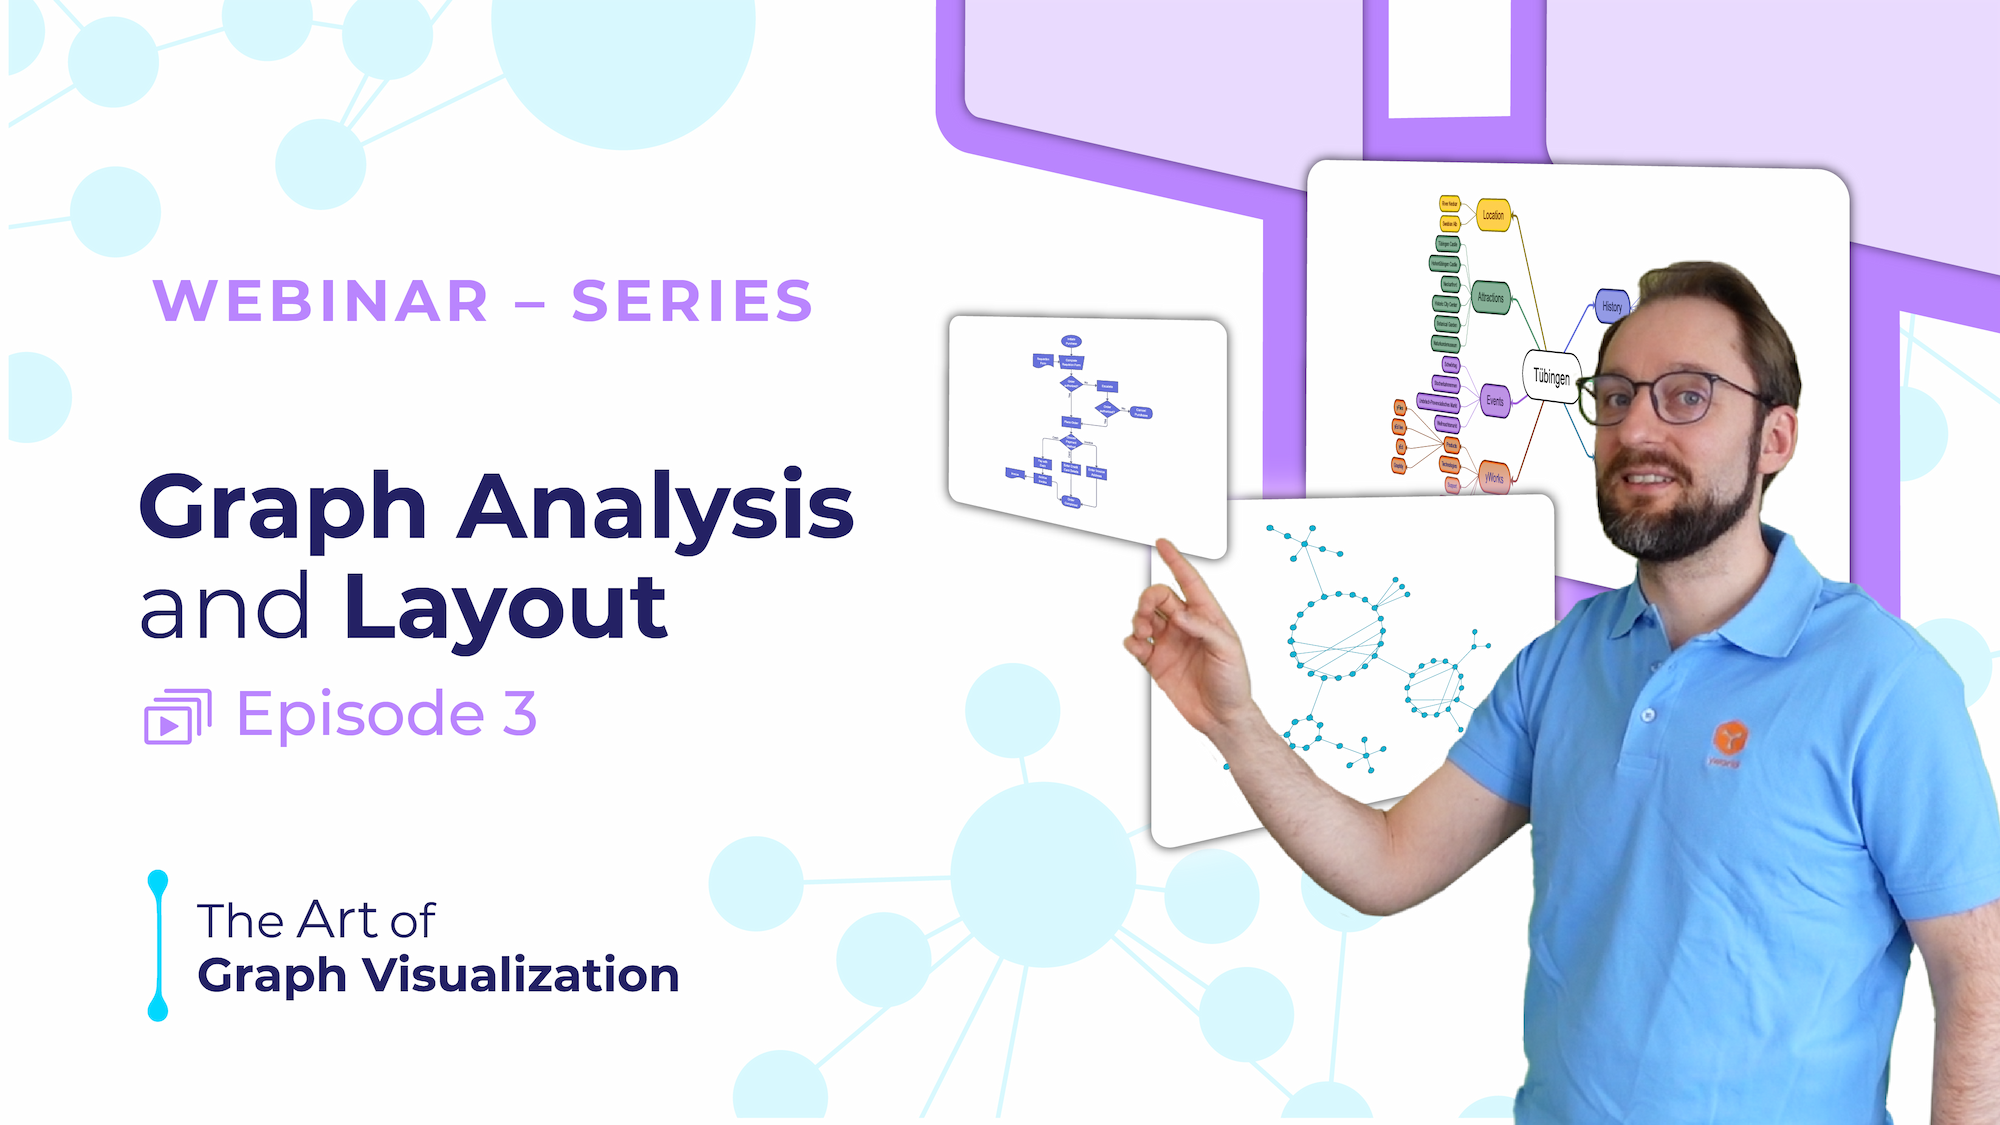
Graph Analysis and Layout
Discover the fascinating world of graph visualization in our webinar series, 'The Art of Graph Visualization'. In this series, you will learn techniques to create compelling graph visualizations.
In the third webinar, 'Graph Analysis and Layout', you will learn how to effectively analyze your graph, unveiling hidden patterns and relationships. From hierarchical to force-directed layouts, you'll gain expertise in choosing the most suitable arrangement to amplify the visual impact of your data.
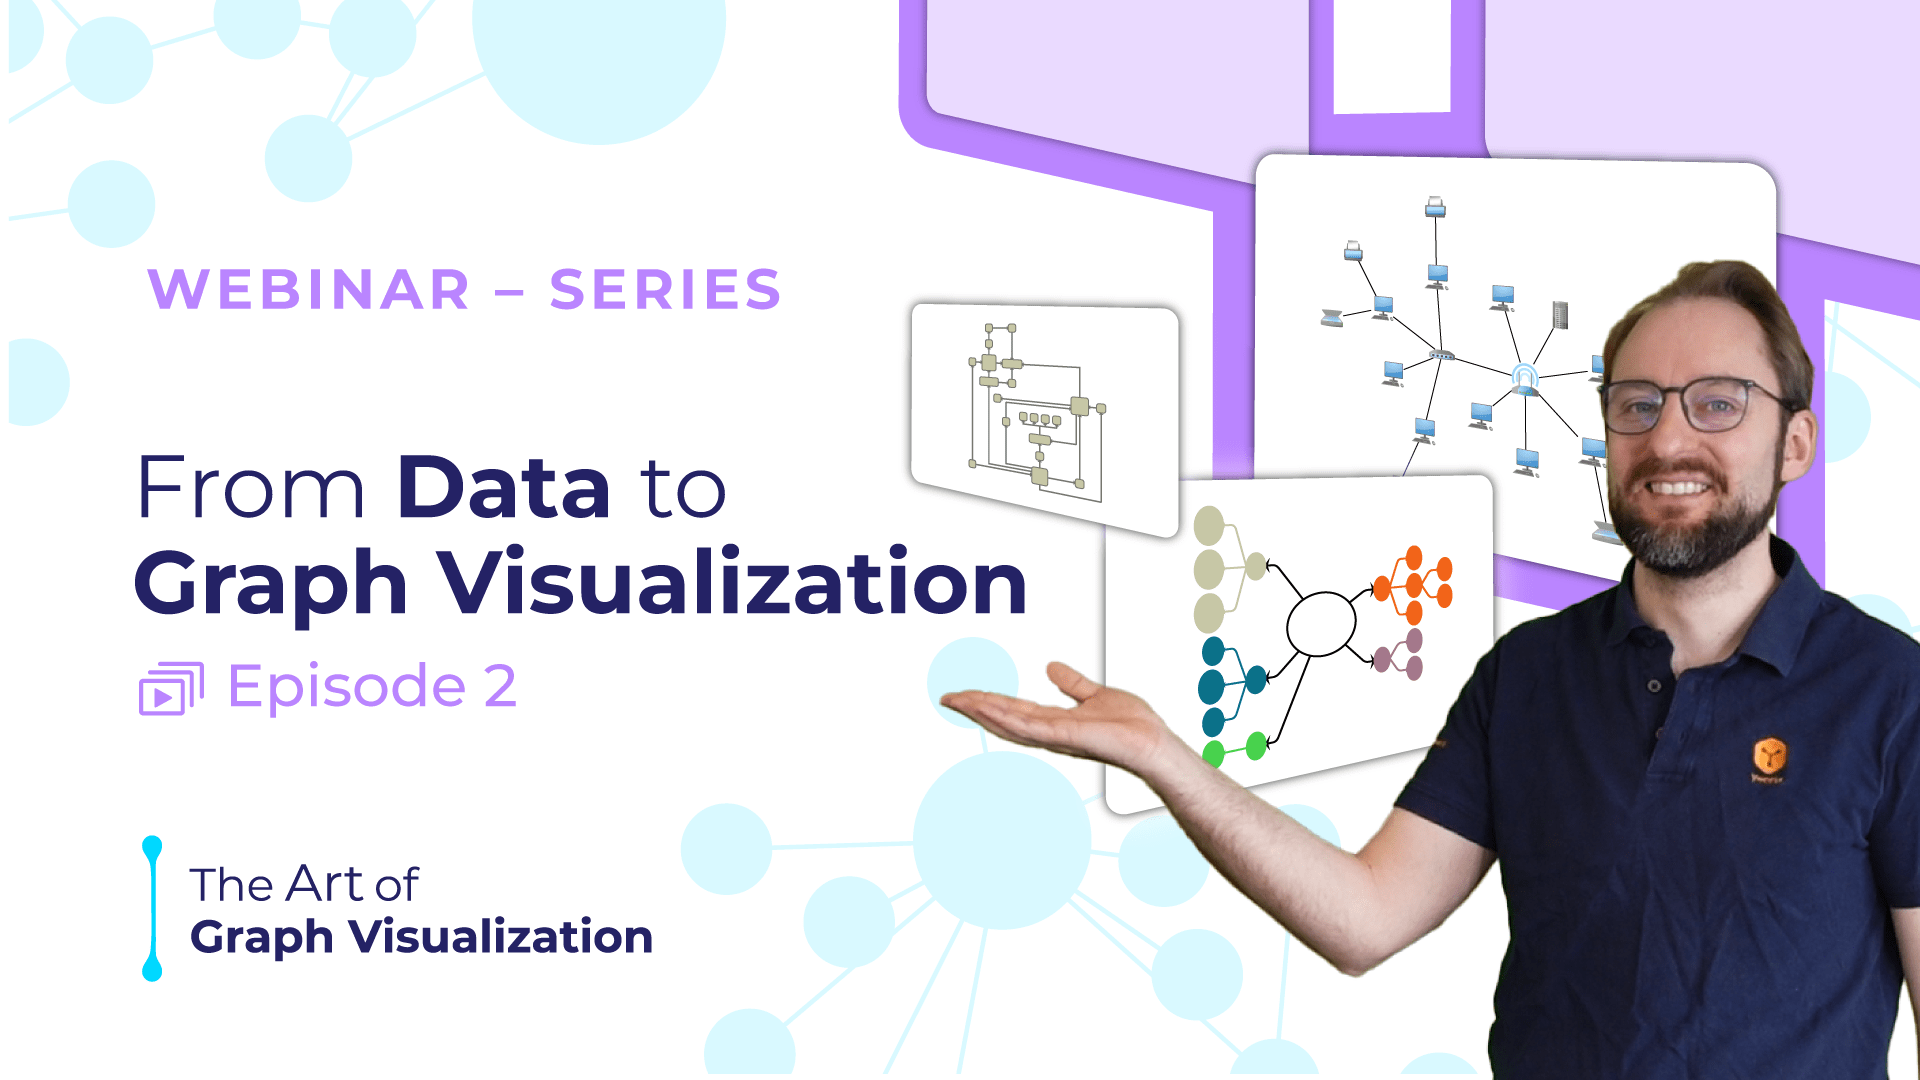
Getting Started: From Data to Graph Visualization
Discover the fascinating world of graph visualization in our webinar series, 'The Art of Graph Visualization'. In this series, you will learn techniques to create compelling graph visualizations.
In this second webinar, 'Getting Started: From Data to Graph Visualization', you will learn how to work with your data and create compelling diagrams.
In this webinar, the following free diagramming apps are showcased:
yEd Live, Data Explorer for Neo4j, App Generator, and diagram creation with python
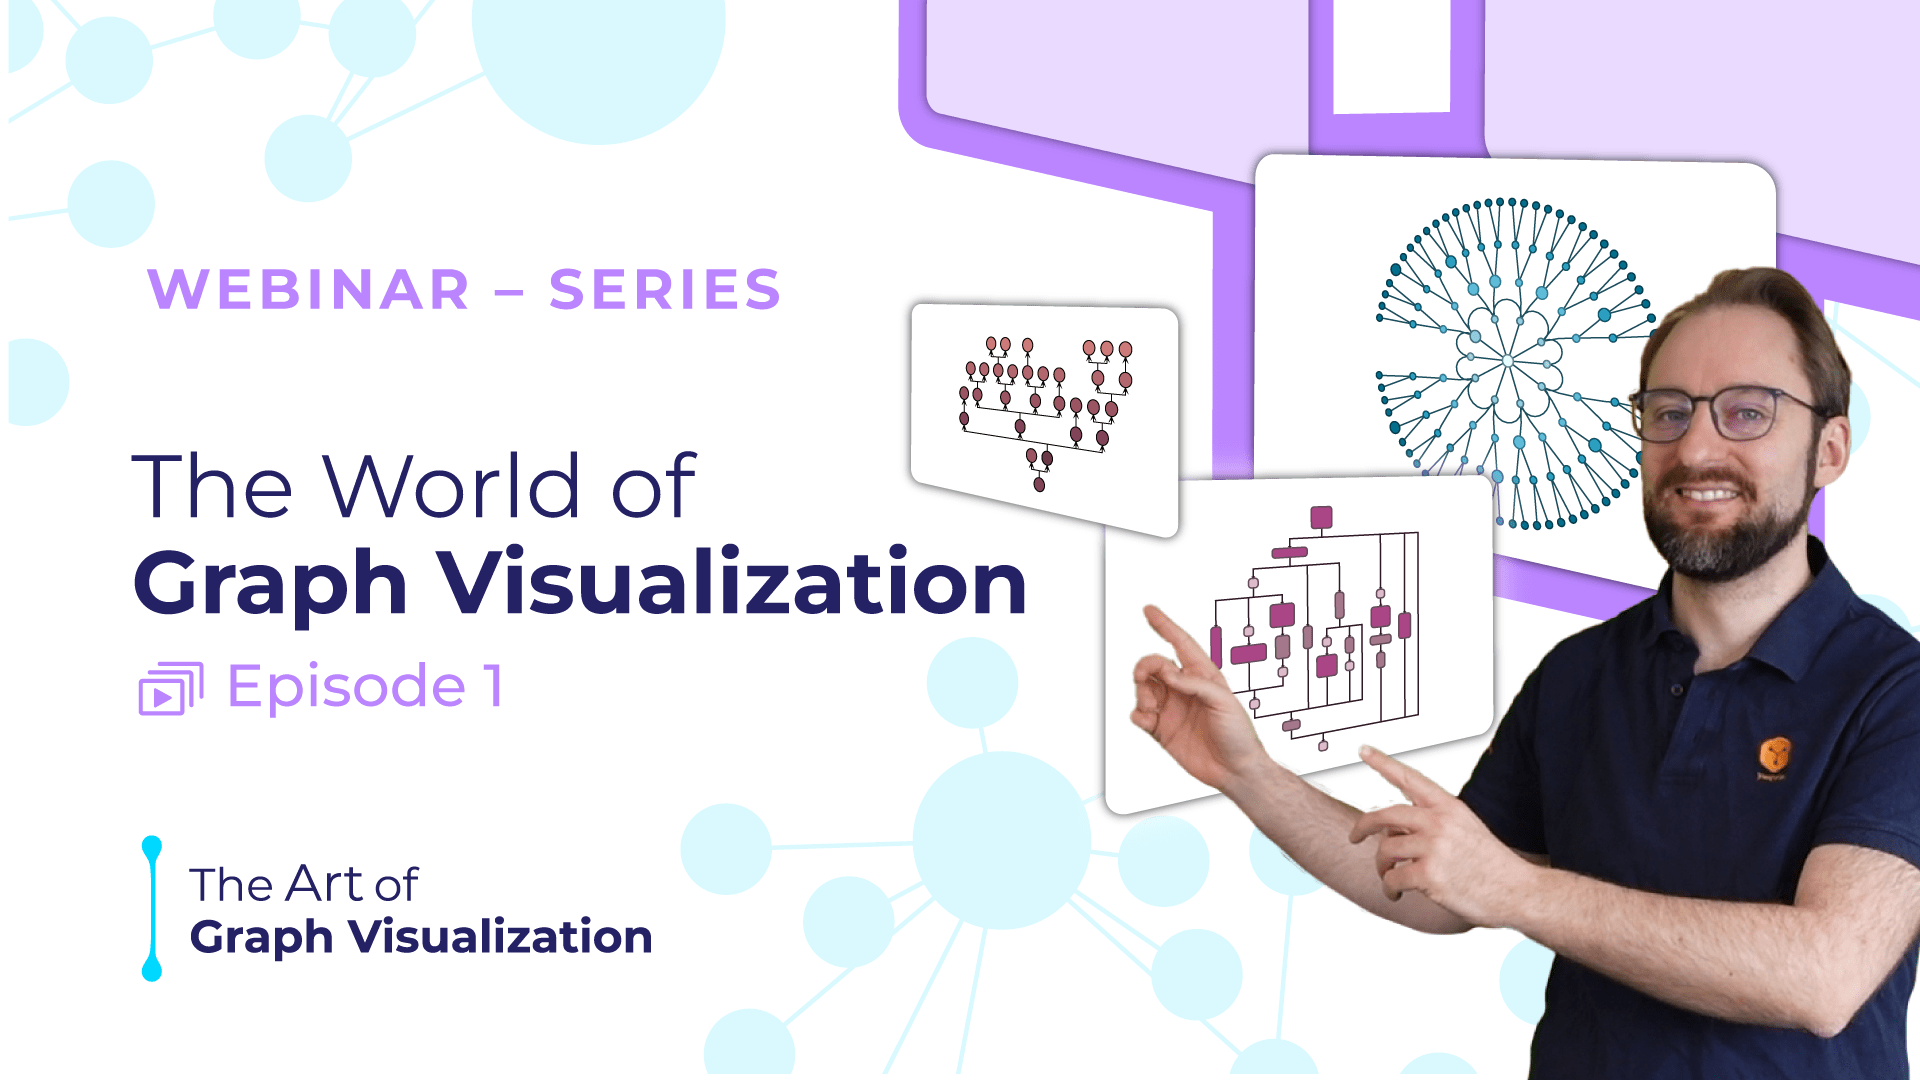
From Networks to Knowledge: The World of Graph Visualization
Discover the fascinating world of graph visualization in our webinar series 'The Art of Graph Visualization'. In this series, you will learn techniques to create compelling graph visualizations.
During the first webinar, we explore how graphs are omnipresent in our daily lives. Whether they appear as metro maps, mind maps, supply chains, workflows, or social networks, they play a crucial role in every industry, from automotive, life sciences, and finance to technological systems in general. Learn how graph visualization empowers you to understand complex data and create intuitive visual representations.
The webinar will wrap up with a Q&A session.
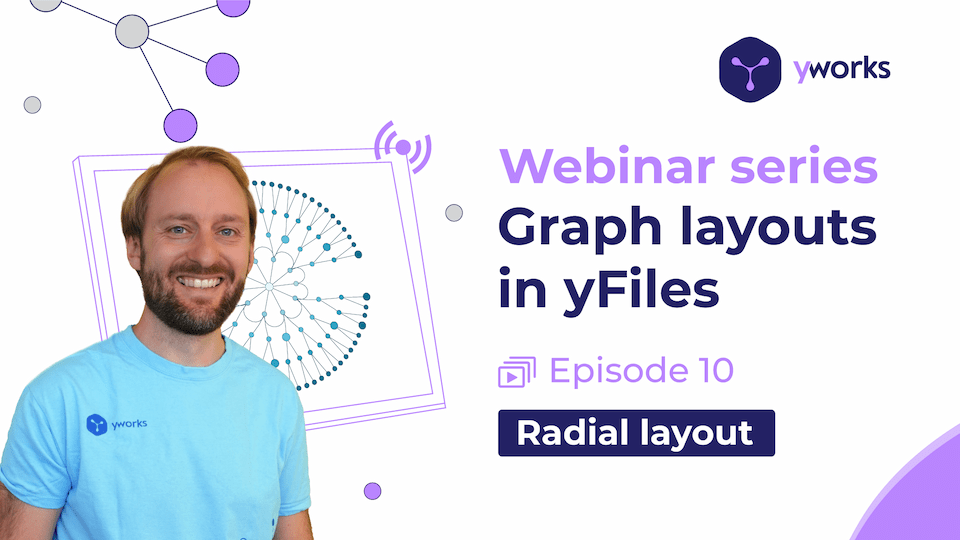
Radial layout with yFiles
In this webinar series, we present a selection of the most popular graph layouts and provide tips and tricks on how to use them effectively.
During this webinar we give a broad overview of the radial layout in yFiles. We introduce you to its applications and characteristics, giving various examples. You will learn how to assess whether the radial layout is suitable for your data, as well as the basics of using and configuring this layout with yFiles for HTML to suit your needs.
What's new in yFiles 2023?
Discover Exciting Updates in yFiles for HTML 2023.
Our Chief Technology Officer, Sebastian, unveils the latest features and enhancements coming to yFiles in 2023. In this session, you'll get an exclusive preview of the upcoming major release of yFiles for HTML. Explore captivating demos, get a glimpse of source code snippets, and gain a high-level overview of the major new capabilities in yFiles.
There is a Q&A session at the end of the webinar.
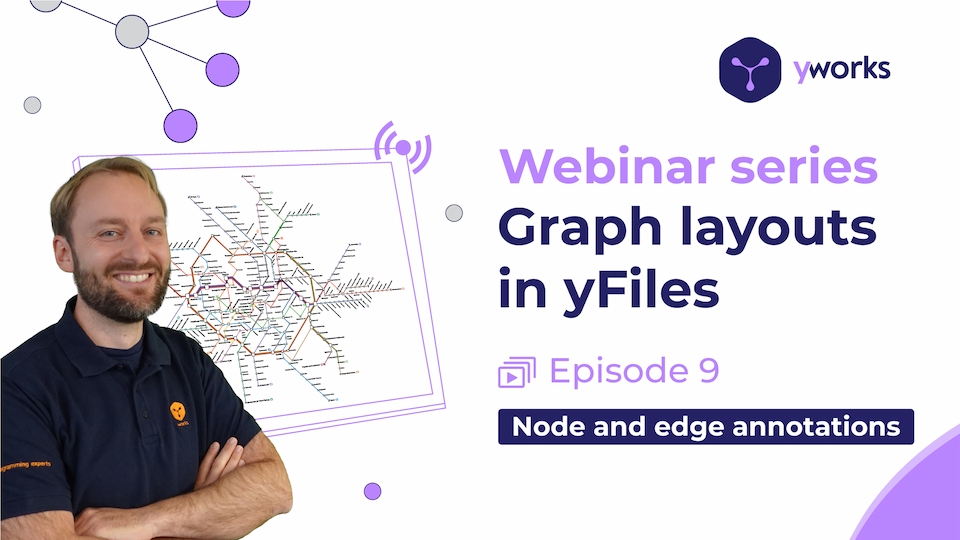
Node and edge annotations with yFiles
In this webinar series, we present a selection of the most popular graph layouts and provide tips and tricks on how to use them effectively.
During this webinar we give a broad overview of annotating nodes and edges with labels in yFiles. We introduce you to different label placement techniques and styles presenting their applications and characteristics. You will learn the basics of using and configuring them with yFiles for HTML to suit your needs.
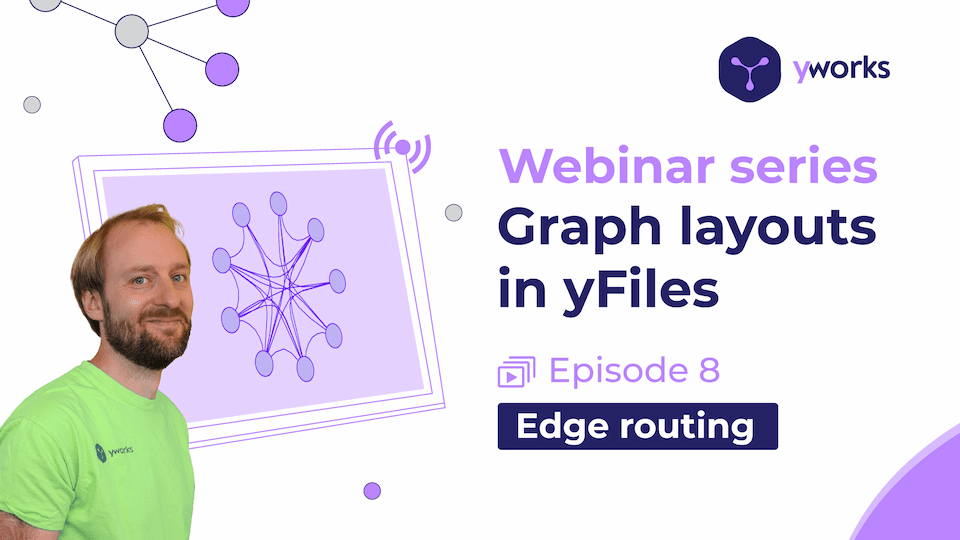
Edge routing with yFiles
This webinar gives you an overview of edge routing in yFiles. We introduce you to different edge routing styles presenting their applications and characteristics. You will learn how to assess which style is suitable for your data, as well as the basics of using and configuring them with yFiles for HTML to suit your needs.
The webinar will wrap up with a Q&A session.
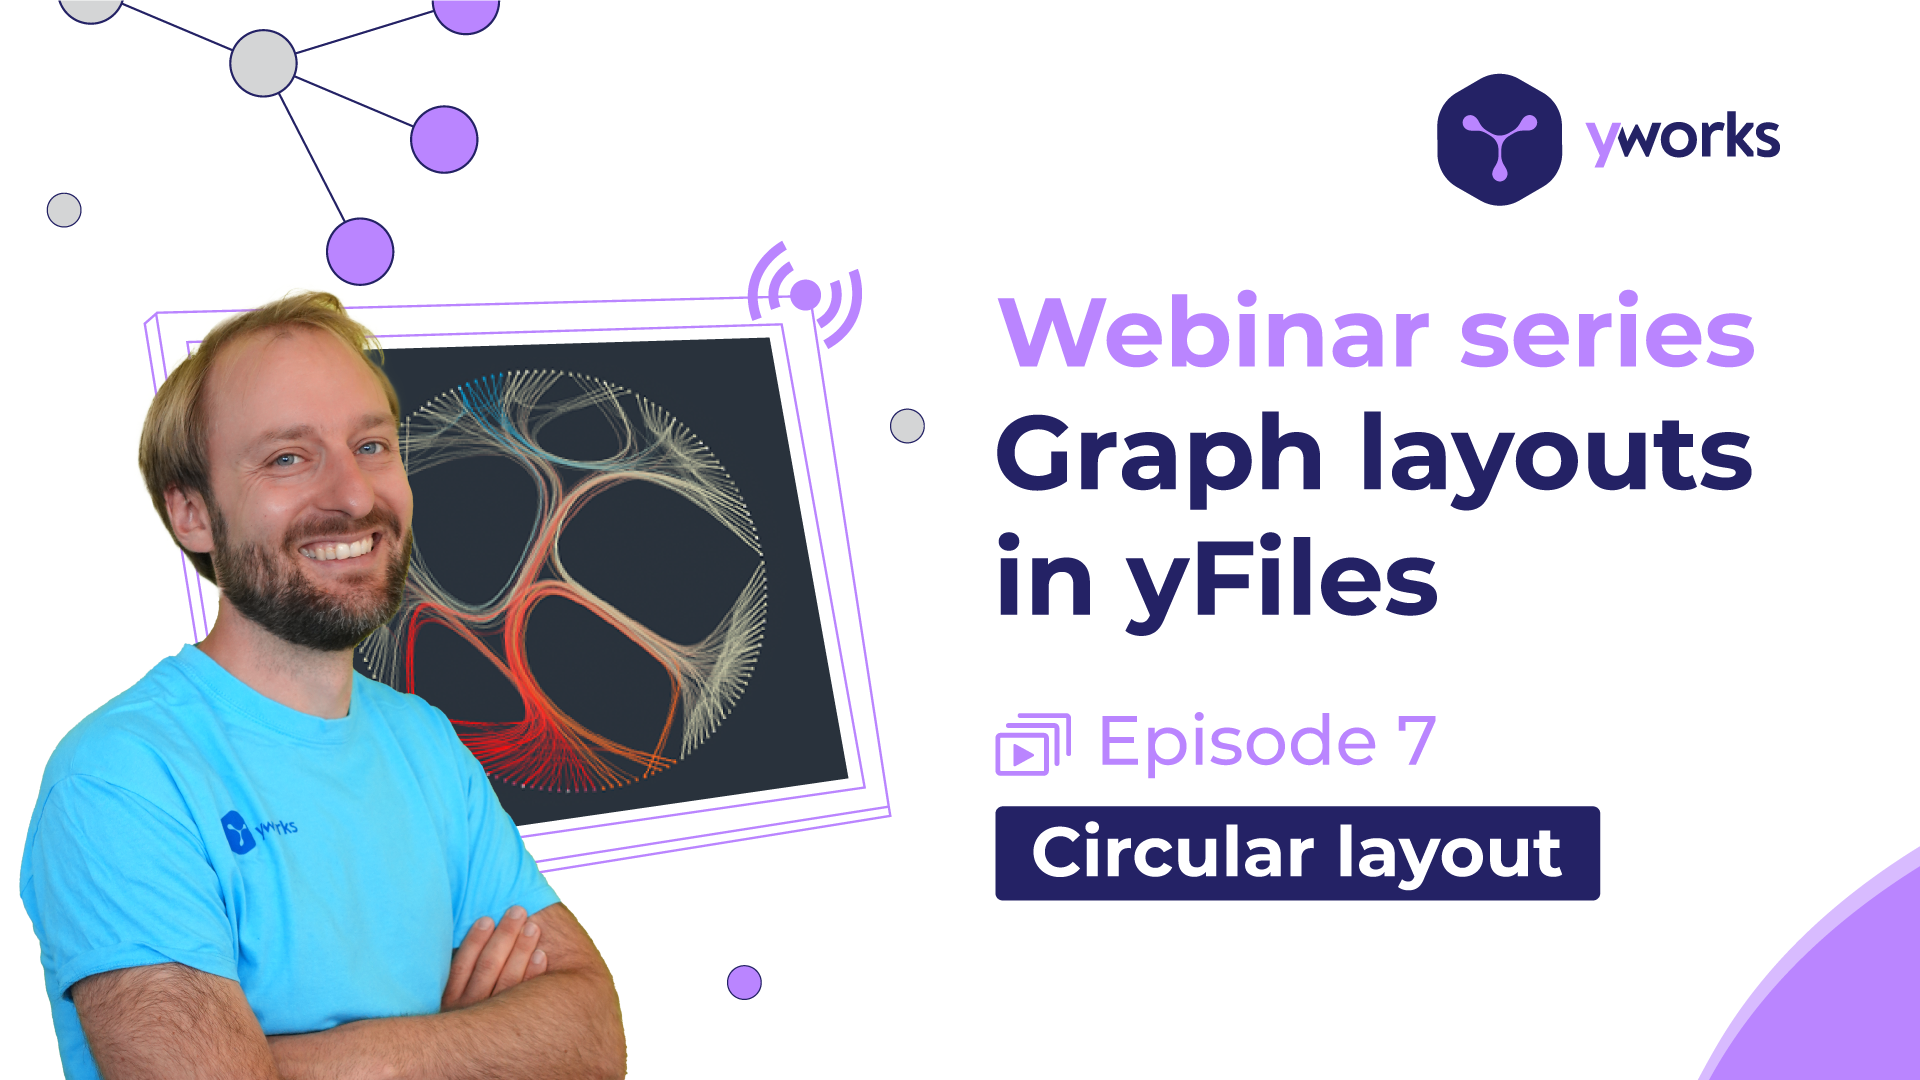
Circular Layout with yFiles
In this webinar, we give you an overview of the yFiles circular layout.
Today's session gives you an overview of the circular layout. We introduce you to its applications and characteristics, giving various examples. You will learn how to assess whether the circular layout is suitable for your data, as well as the basics of using and configuring this layout with yFiles for HTML to suit your needs. In this context, we also present the balloon layout, which uses the circular layout for creating tree-like visualizations of general graphs.
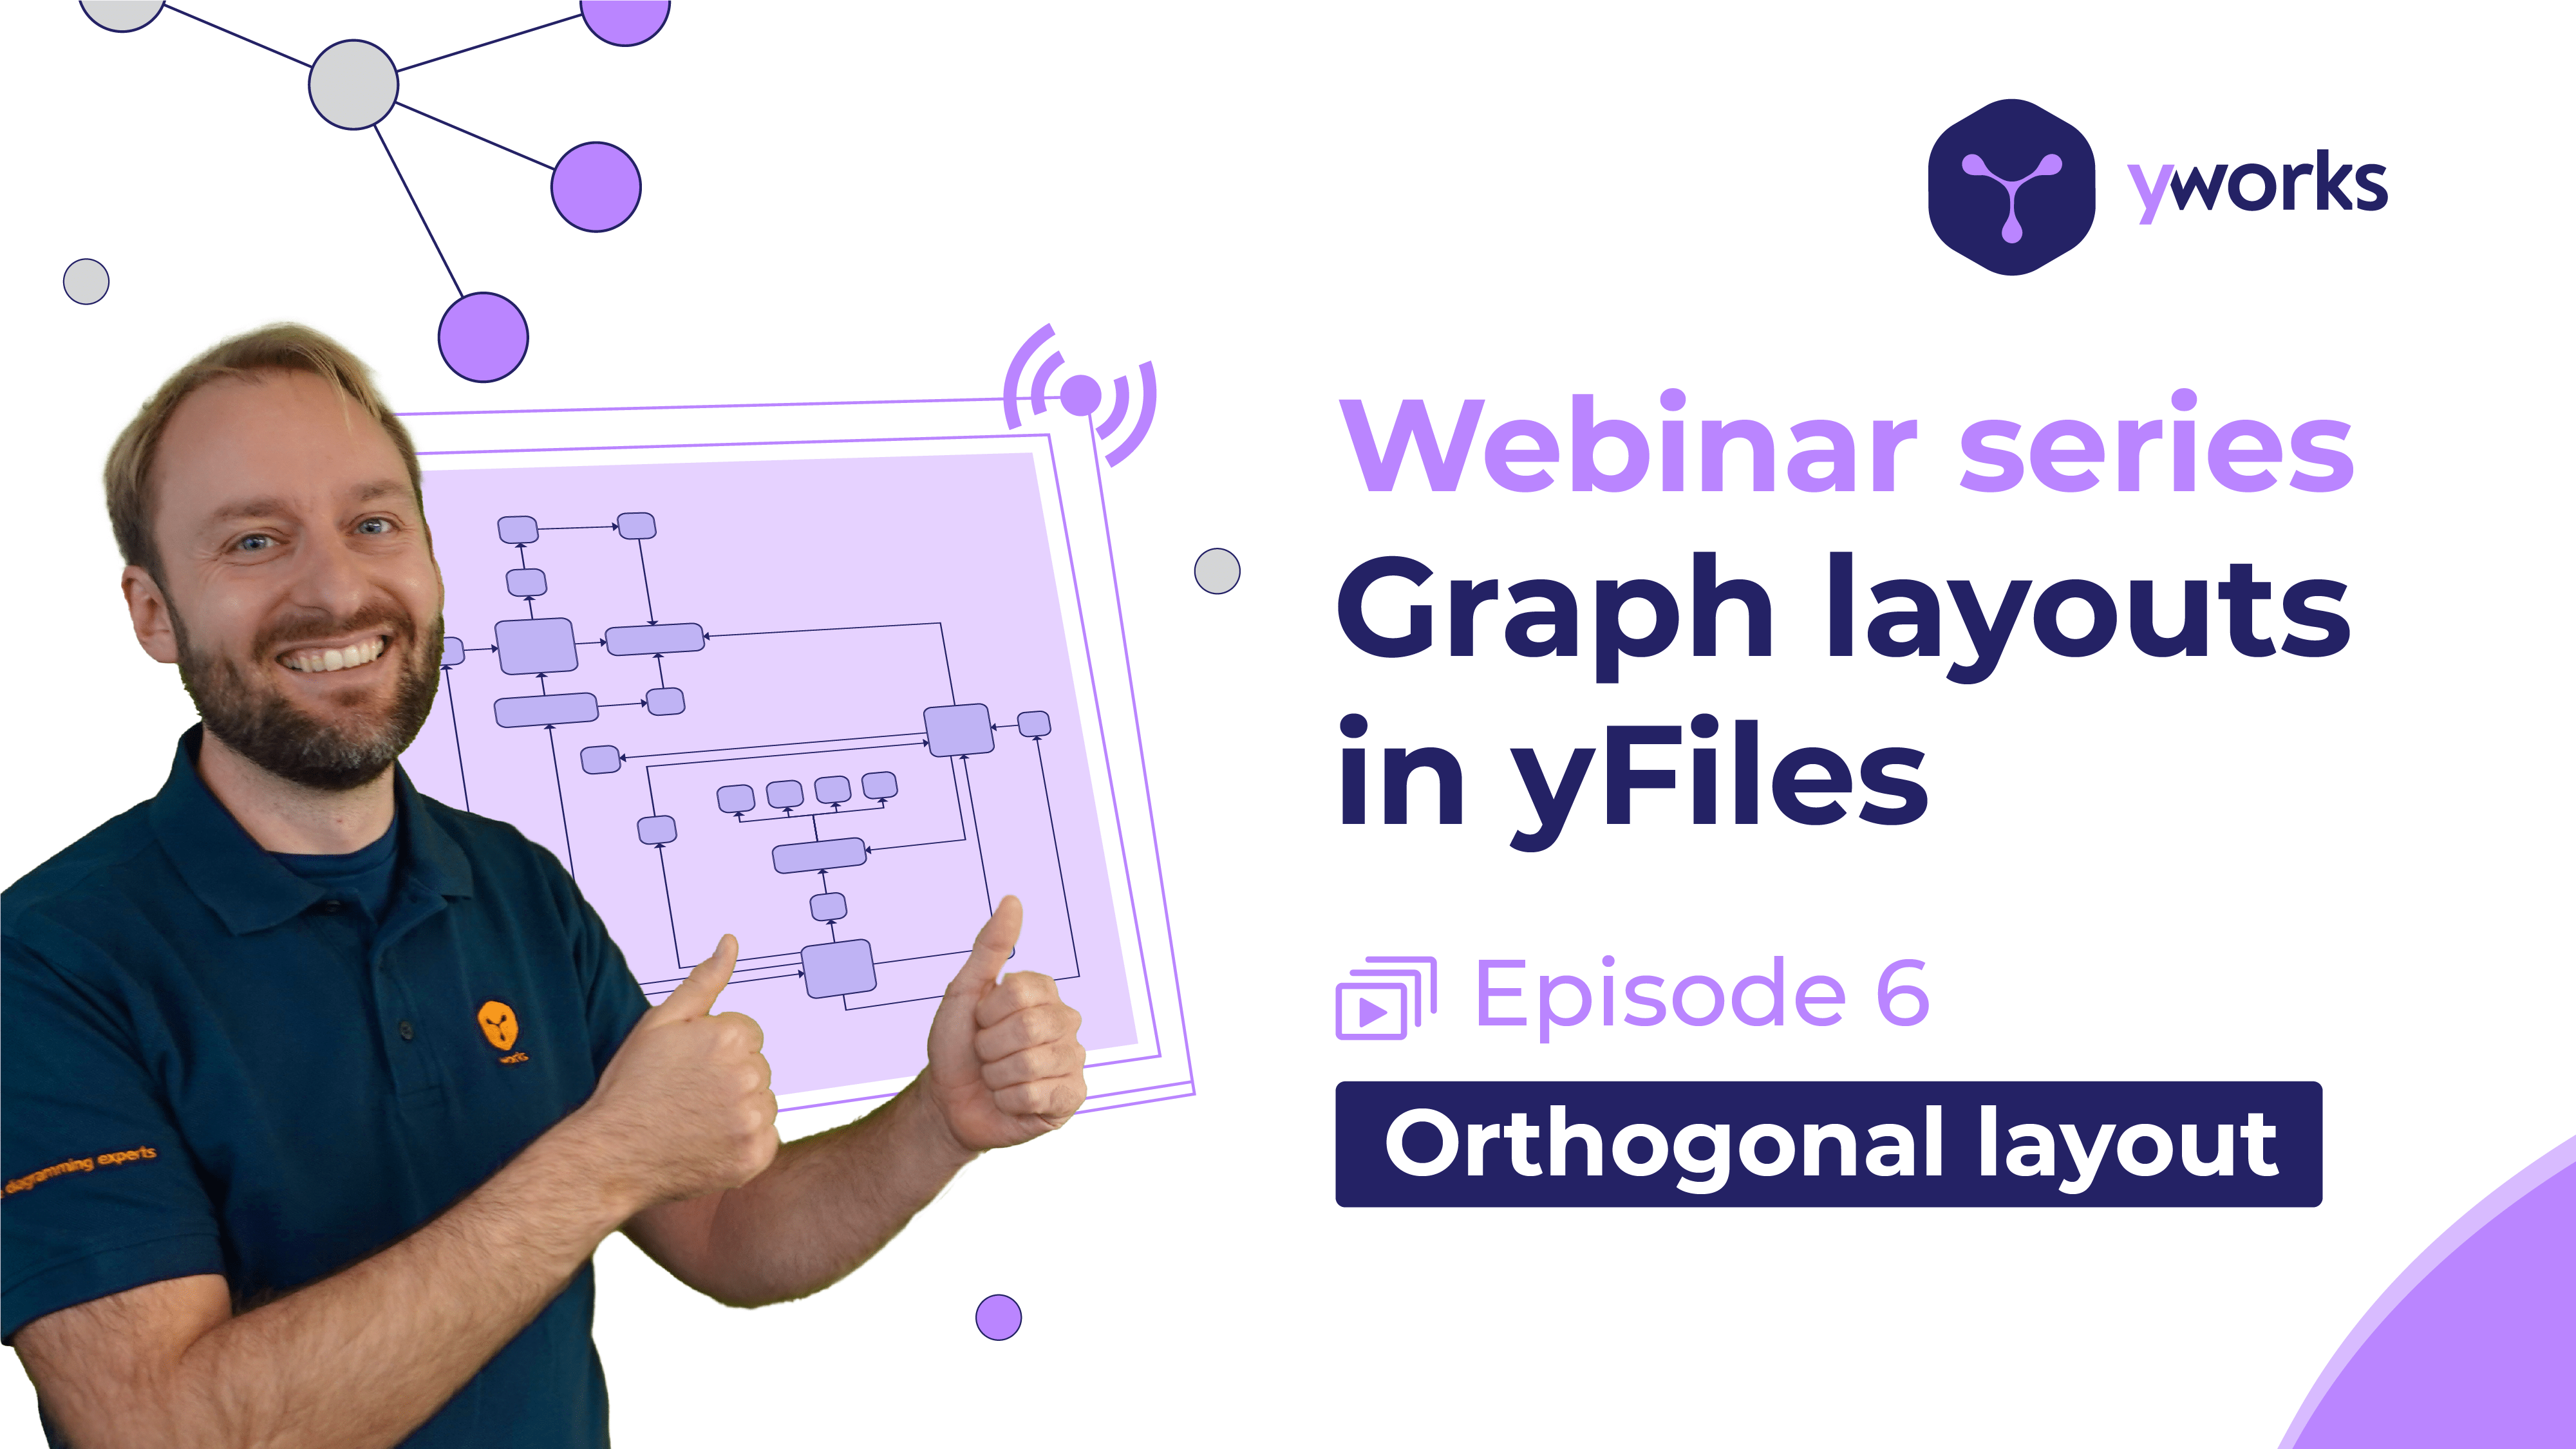
Orthogonal Layout with yFiles
In this webinar, we give you an overview of the yFiles orthogonal layout.
During this webinar we give a broad overview of the orthogonal layout. We introduce you to its applications and characteristics, giving various examples. You will learn how to assess whether the orthogonal layout is suitable for your data, as well as the basics of using and configuring this layout with yFiles for HTML to suit your needs.
What's new in Graphity 2022
In this webinar we will introduce all the new features of Graphity - the diagramming editor for Atlassian Confluence. Alongside this, you will get tips and tricks for working with Graphity.
More information about Graphity for Confluence:
https://graphity.com
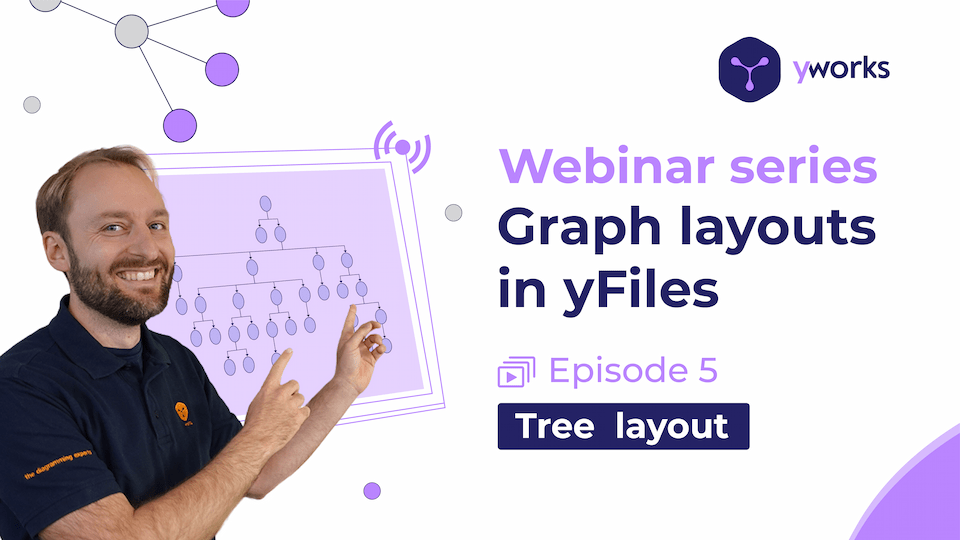
Tree Layout with yFiles
In this series of webinars, we present a selection of the yFiles layouts.
This webinar gives you an overview of the yFiles tree layout. We introduce you to its applications and characteristics, giving various examples. You will learn how to assess whether the tree layout is suitable for your data, as well as the basics of using and configuring this layout (in HTML) to suit your needs.
Learn more about yFiles
Evaluate yFiles for free
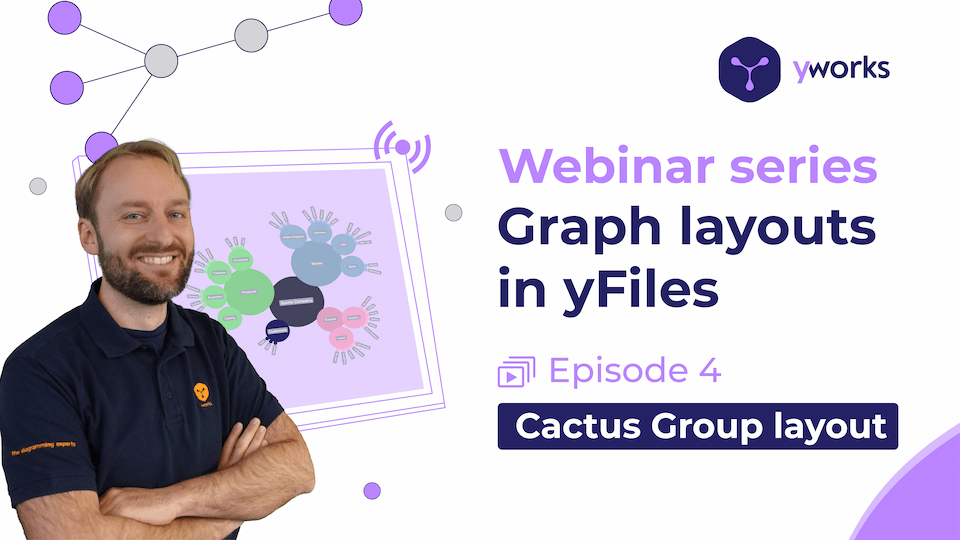
Cactus Group Layout with yFiles
In this series of webinars, we present a selection of the yFiles layouts.
This webinar gives you an overview of the yFiles cactus group layout. We introduce you to its applications and characteristics, giving various examples. You will learn how to assess whether the cactus group layout is suitable for your data, as well as the basics of using and configuring this layout (in HTML) to suit your needs.
Learn more about yFiles
Evaluate yFiles for free
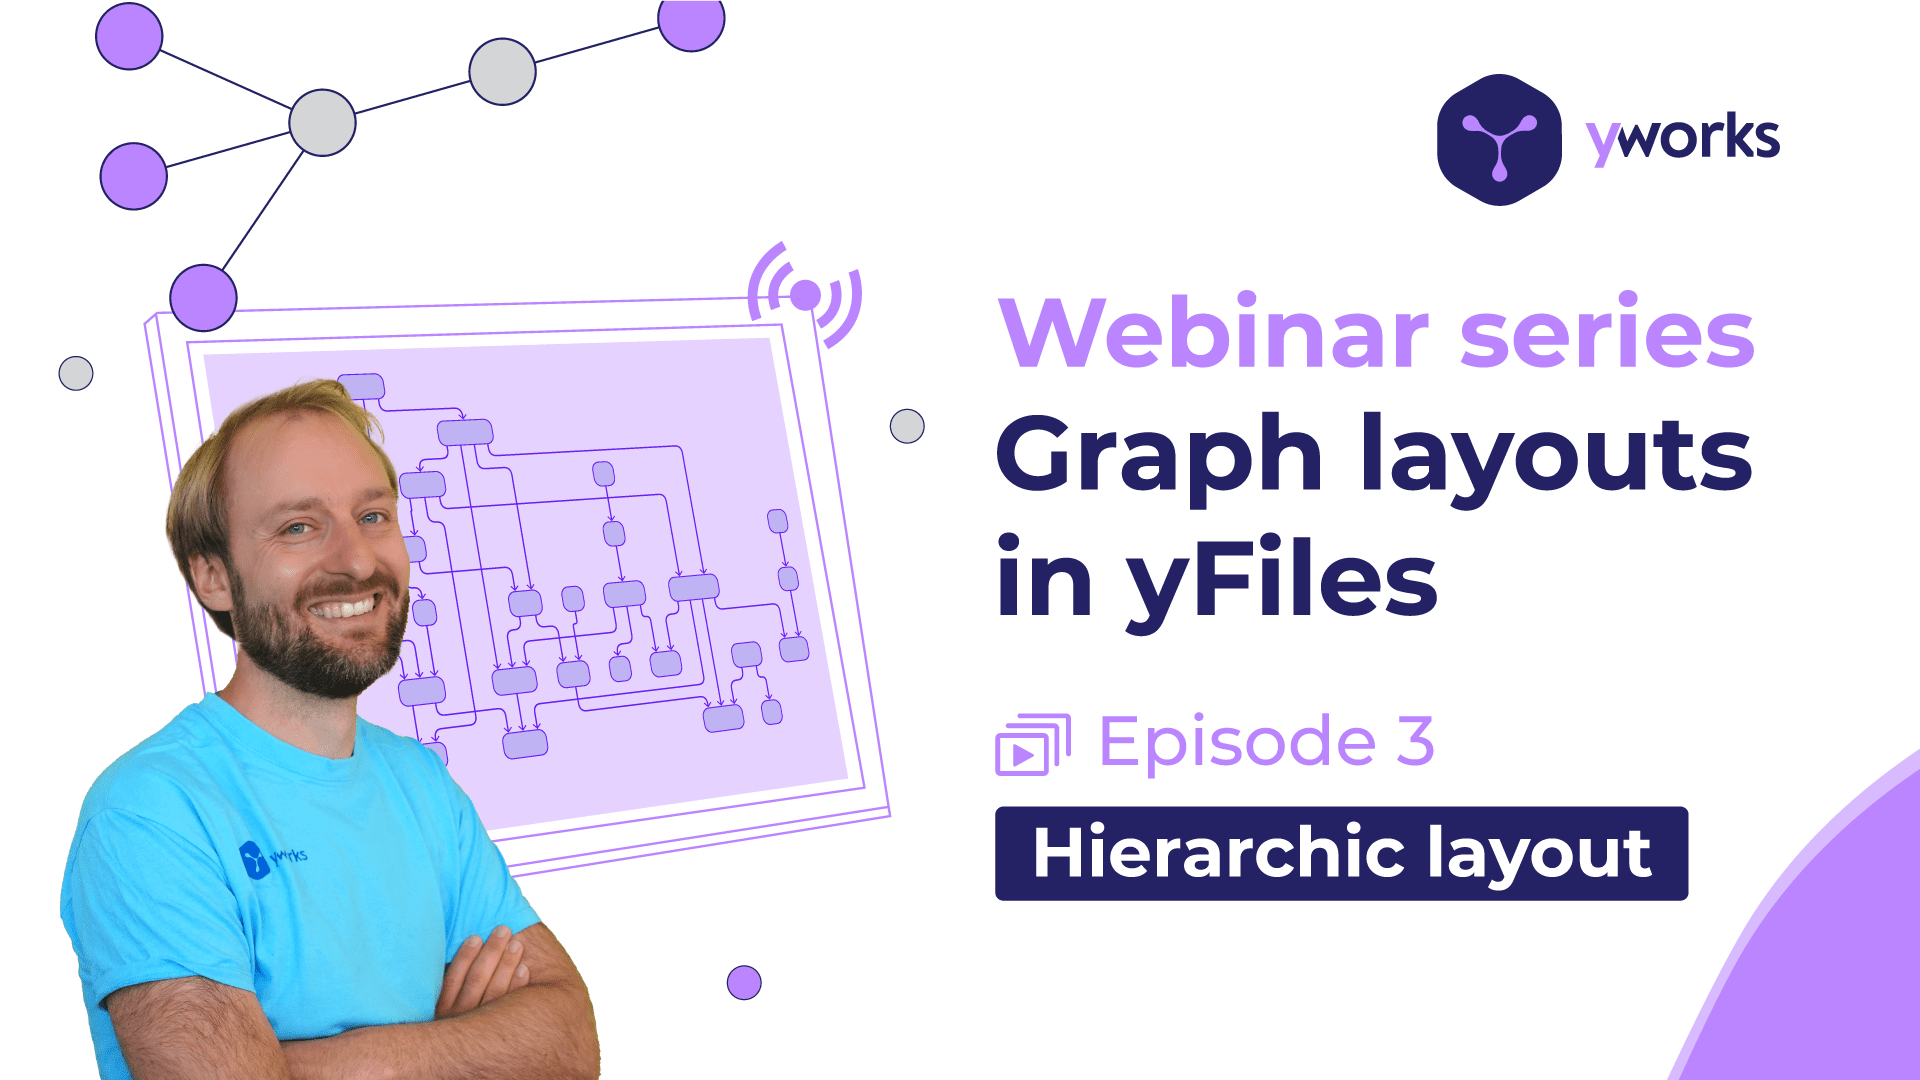
Hierarchic layout with yFiles
In this webinar, we give you an overview of the yFiles hierarchic layout.
We introduce you to its applications and characteristics, giving various examples.
You will learn how to assess whether the hierarchic layout is suitable for your data,
as well as the basics of using and configuring this layout (in HTML) to suit your needs.

yFiles Graphs for Jupyter
In this webinar you will get an introduction to the free yFiles graph visualization plugin for Jupyter Notebooks. We'll show you how to install and use the plugin to render, layout, and analyze graphs from various data sources in the context of Jupyter Notebooks and the Jupyter Lab.
At the end of the webinar there will be a Q&A session during which we'll be answering your questions!
Learn more about yFiles
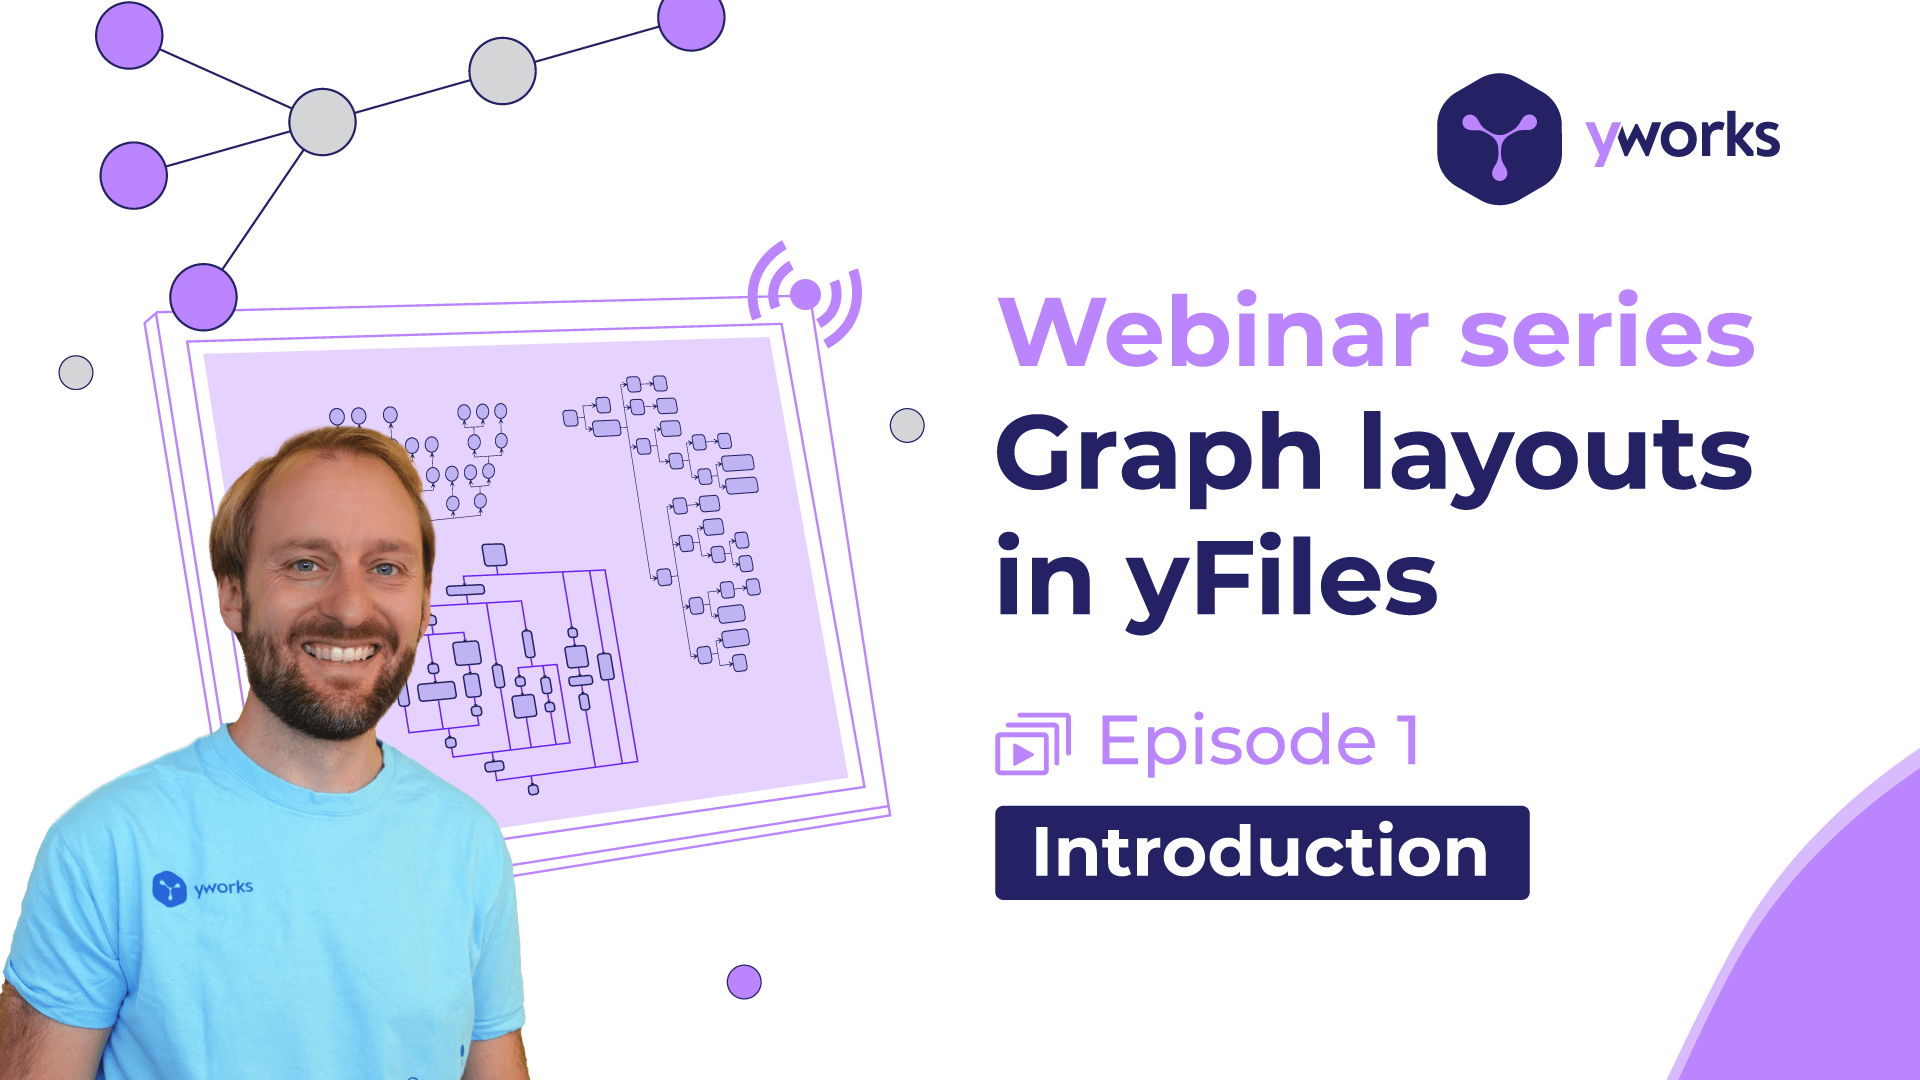
Graph layouts in yFiles
In this series of webinars we present a selection of the yFile's layouts.
In the first webinar we give a broad overview of the most important layouts in yFiles. We introduce you to their main applications and characteristics giving various examples, and show how to easily apply them using the yFiles diagramming library. In the subsequent webinars we then take a closer look on these layouts. Each webinar will focus on one particular layout presenting concrete coding examples in yFiles for HTML. Altogether, in this series of webinars you will learn the basics on how to assess whether layouts are suitable for your data as well as the basics on how to use and configure the layouts for your needs.
At the end of the webinar there will be a Q&A session during which we'll be answering your questions!
Learn more about yFiles
Try yFiles for free
What's new in yFiles 2022?
This webinar shows you the recent features coming to yFiles in 2022. We introduce you to the new automatic layouts, new interactivity, and styling options. Additionally, we explore a few source code snippets as well as discuss the latest features of yFiles.
The focus of this webinar is on yFiles for HTML's view features, but layout and interaction apply to other platforms as well.
Coach: Sebastian Mueller, yWorks CTO
Learn more about yFiles:
https://www.yworks.com/products/yfiles
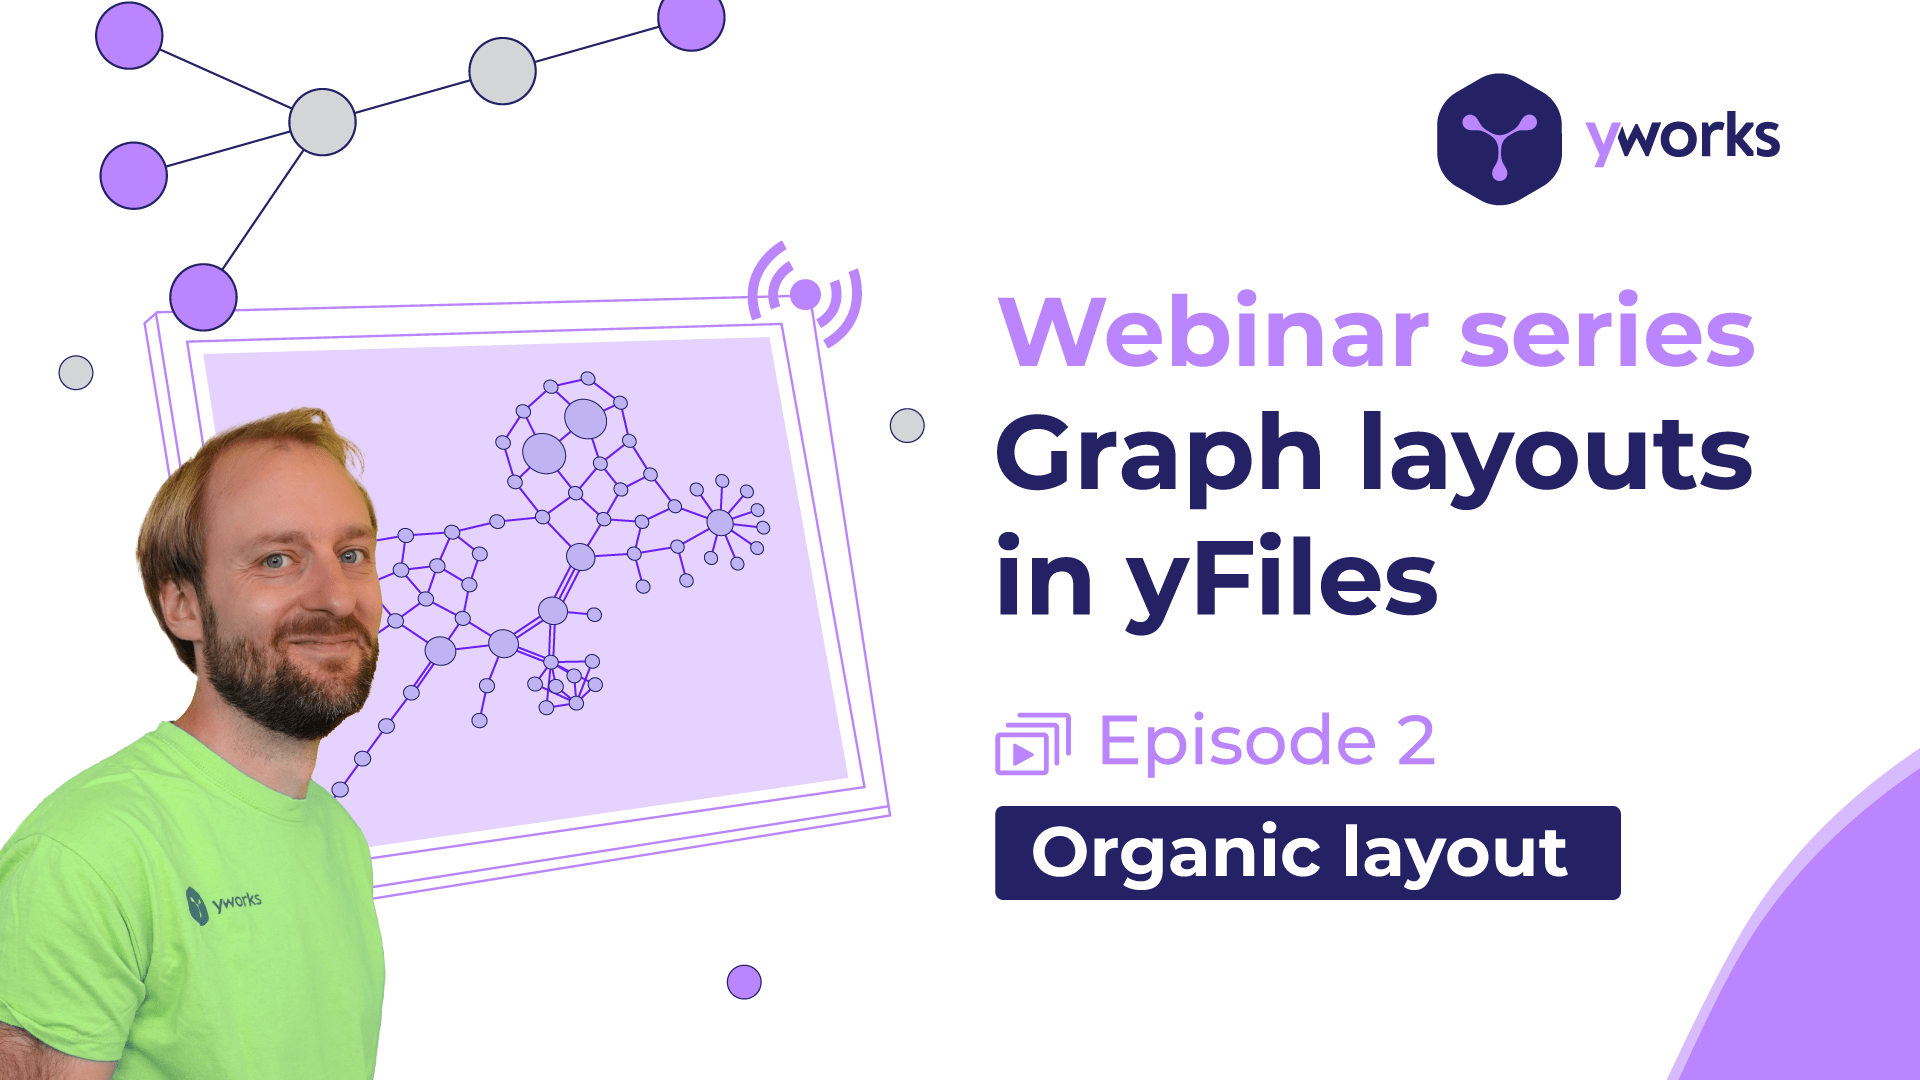
Organic Graph Layout with yFiles
In this webinar, we give you an overview of the yFiles organic layout.
We introduce you to its applications and characteristics giving various
examples. After discussing the layout's main features and capabilities,
we take a closer look at integrating sublayouts such as parallel structures,
stars and tree structures. Altogether, you will learn the basics on how to
assess whether the organic layout is suitable for your data as well as the
basics on how to use and configure the organic layout in yFiles for your needs.
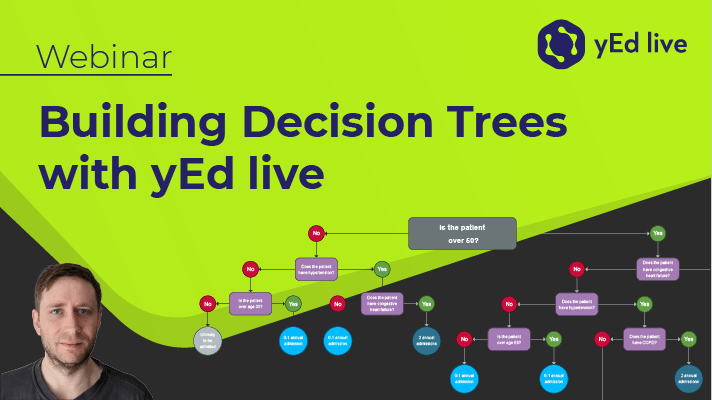
Building Decision Trees with yEd Live
A decision tree guides a user from an initial question into one of the multiple possible end states. Each step along the decision process presents a choice that will branch down further until the user reaches a result.
In this webinar, we interactively build decision trees in yEd Live from scratch. We see different approaches on how to use the tools provided within yEd Live so that the presented techniques can be applied to almost any other diagram creation with yEd, yEd Live, or Graphity for Confluence.
Learn more about the yFiles family of diagramming libraries!
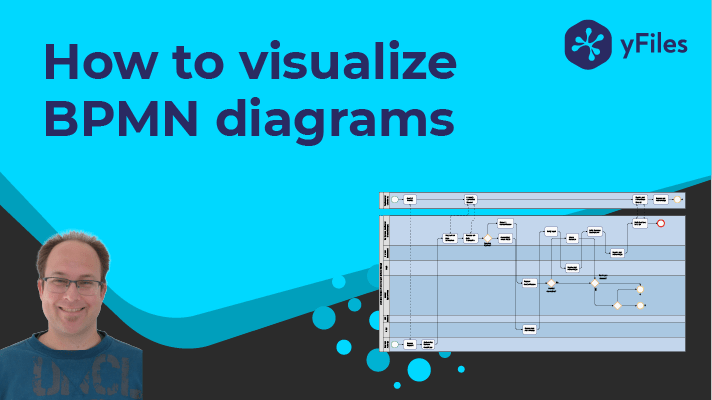
Visualizing Business Process Diagrams with yFiles - BPMN
Visualizing Business Processes improves the understanding of the process and how the process flow works. To give organizations the ability to communicate these procedures with multiple stakeholders, a standardized model, and visual notation is essential.
In this webinar, you learn how the BPMN standard works and how to visualize business processes with yFiles using your BPMN data.
The following links provide more information about BPMN and how it is supported by yFiles:
Learn more about the yFiles family of diagramming libraries!

Graphity - Diagrams for Confluence: Migrating from Confluence Server to Cloud
In this free webinar, we show you how to effortlessly migrate your Graphity for Confluence diagrams from Atlassian Confluence® Server to Atlassian Confluence® Cloud. Also, we present the new features of Graphity 1.4.
Since Confluence Server will reach end of sale soon, a lot of Confluence users are looking to migrate to Confluence Cloud. Luckily, the migration of Graphity is very straight-forward and quick. This webinar shows you the few steps that are necessary to bring your diagrams to Confluence Cloud using Atlassian’s own migration assistant together with the migration feature of Graphity.
Additionally, you will be introduced to the great new features of Graphity 1.4, like isometric and sketchy diagrams and the new icon search.
More information about Graphity for Confluence:
graphity.com
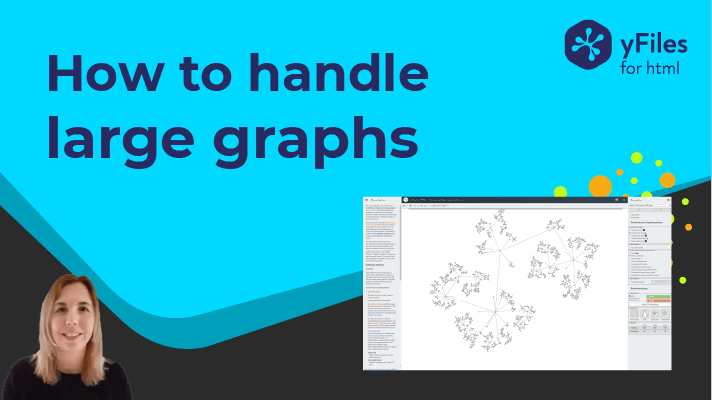
Techniques and tips for displaying and editing very large graphs
In this free webinar, we present techniques and tips for manipulating and editing large graphs.
Transforming large raw business datasets into a meaningful visualization can be a challenge. Large graphs often suffer from higher complexity, which generally makes them hard to grasp.
Most of the time, only a small part of the diagram is of interest, and a typical “hairball” graph might look impressive but does not provide much insight to the viewer.
Reducing the complexity is an excellent strategy for browsing large graphs.
However, even after complexity reduction, the graph instance can still be very large, and thus we need techniques to display the graph elements efficiently and interact with them smoothly.
In this webinar, we focus on two aspects to tackle these challenges.
Namely, reducing the data complexity to obtain a smaller graph structure, including e.g., aggregation, clustering, or filtering, and improving the rendering and interaction performance, using WebGL, customizing user interactions, and more.
Learn more about the yFiles family of diagramming libraries:
https://www.yworks.com/products/yfiles
What's new in yFiles 2021?
Take a look at the new 2021 yFiles major releases! Hear what we have to offer, see what's new, and learn how your app or developer experience can benefit from the new features.
There will be a focus on yFiles for
HTML in this webinar, but you will also learn about features that will be part of all platforms that yFiles is supported on:
Coach: Sebastian Mueller, yWorks CTO
Learn more about the yFiles family of diagramming libraries:
https://www.yworks.com/products/yfiles
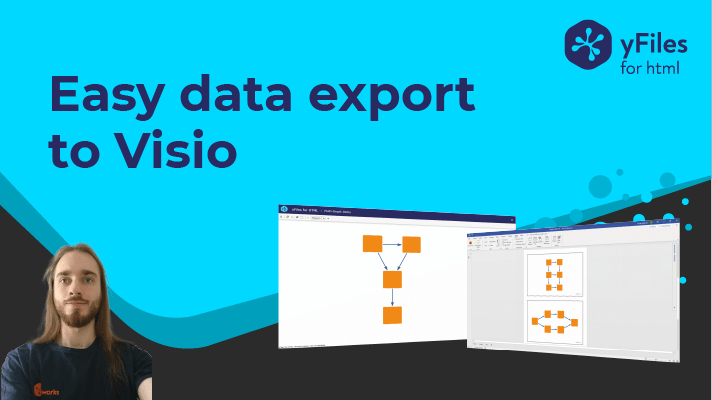
New features in VSDX Export for yFiles the diagramming SDK
In this recorded webinar we will give an introduction to the new features in the VSDX Export Add-on 2.0.0 for the yFiles for HTML diagramming SDK.
You will learn how to:
- enhance existing Visio files with yFiles diagrams,
- add multiple yFiles diagrams to a single Visio file.
Learn more about the VSDX Export for yFiles for HTML here:
https://www.yworks.com/vsdx-export

Collaborative Editing with Graphity
In this webinar, the Graphity lead developers present the new collaborative editing feature of Graphity. Graphity is the professional diagram editor plug-in for Atlassian Confluence.
More information about Graphity for Confluence:
https://graphity.com
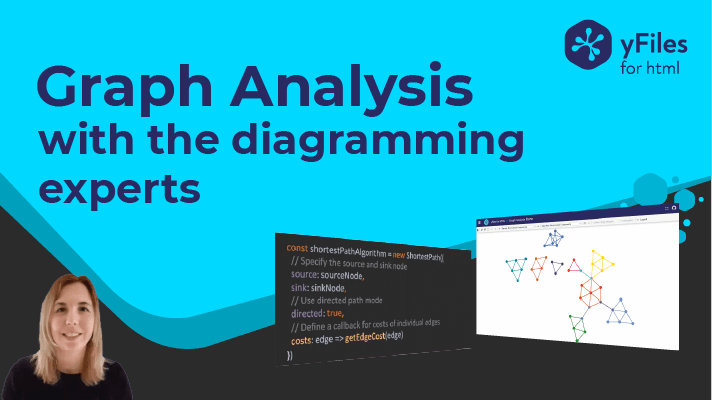
Graph Analysis with yFiles
In this webinar, we introduce you to the different types of algorithms yFiles offers, for example, clustering algorithms, path-related algorithms, or graph structure analysis algorithms. We present use cases where the algorithms come in handy and you will learn how to run an analysis algorithm in your own application.
Additional links
Developer's guide - Clustering
Developer's guide - Node Aggregation
Developer's guide - Centrality Measures
Developer's guide - Shortest Path and Reachability
All interactive yFiles demos

Exploring CovidGraph with yFiles (Guest webinar at CovidGraph.org)
In this webinar, yWorks CTO Sebastian will demonstrate how CovidGraph can help researchers around the world intuitively and visually navigate through the publications, genes, patents, and more that make up the knowledge graph.
Sebastian will go into detail about the custom visualization application, specifically designed to meet the needs of end-users and built by yWorks in just a few days. He will further introduce you to the tools and frameworks used by the CovidGraph project and show you how you can reuse this knowledge in your own projects. This webinar will start with a general introduction to the topic and the tools involved, and then briefly go into some technical aspects of the solution.
More about information on CovidGraph:
https://healthecco.org/

Graphity for Confluence Plug-in: Setup and Administration
Graphity's lead developer shows setup and administration of the Graphity plug-in within a Confluence installation and Confluence Cloud:
- General admin settings
- Managing built-in item palettes
- Managing shared item palettes
- Plug-in administration in Confluence Cloud
More information about Graphity for Confluence: https://graphity.com
Visualization Tools for Complex Data - No Code, Low Code, and full Code
In this webinar, you will learn about some of the tools yWorks uses and provides for creating bespoke graph visualization apps for complex data. We will introduce you to the "data explorer for neo4j". Also you will get see our new rapid application development and scaffolding tool - the yFiles app generator. You will learn how these tools can be used to create bespoke graph visualization apps to support domain-specific use-cases.
Coach: Sebastian Mueller, yWorks CTO
Learn more about the yFiles family of diagramming libraries:
https://www.yworks.com/yfiles-overview
What's new in yFiles 2020?
In this free webinar we will give you a sneak peek of the new features and functionality that will be available across all the upcoming 2020 yFiles releases, i.e. web platform, Java, and .NET:
- Isometric rendering
- Automatic layout support for clear area/fill area layouts
- Support for large graph analysis with community detection and aggregation
- Bezier curve routing style
- Improved Node.js support
- Additional language and framework-specific support for TypeScript, Angular, React, Vue developers
- New label style with rich formatting support
Learn more about the yFiles family of diagramming libraries:
https://www.yworks.com/yfiles-overview
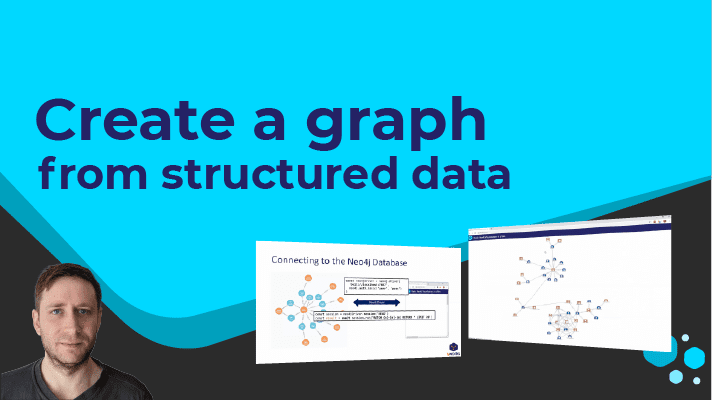
How to visualize your Neo4j database with yFiles
Learn how to load and visualize data from your Neo4j database with yFiles, and get to know some of the vast possibilities to obtain a better understanding of your data. We will show you, step by step, how to connect to your Neo4j database and load your data in a mini web app to create a clear visualization using the yFiles diagramming software component.
Learn more about the yFiles family of diagramming libraries:
https://www.yworks.com/yfiles-overview
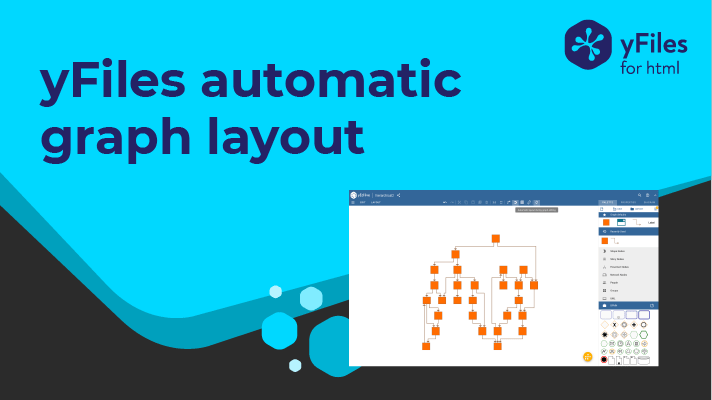
yWorks Webinar: yFiles Automatic Graph Layout
In this webinar we give an overview of the yFiles automatic graph layout algorithms. We introduce you to what automatic layout means and explain the differences between algorithms that place all graph elements, edge routing and label placement algorithms. We present the different main layout styles included with yFiles (hierarchic, tree, organic, etc.) and show you their main characteristics. You will learn how they differ from each other and how they compare, and also about the different use cases they are suited for.
Learn more about the yFiles family of diagramming libraries:
https://www.yworks.com/yfiles-overview

Graphity Webinar: Tips and Tricks
Graphity's lead developer shows you tips and tricks for Graphity for Confluence:
- Custom item palettes
- Integrated linking of Confluence pages
- Read-only mode
- Editor and integration improvements
- Feature Outlook for Graphity 1.2
More information about Graphity for Confluence:
https://graphity.com
yWorks Webinar: Understanding Connected Data through Visualization
In this webinar you will learn what tools you can use to get the most out of connected data visualizations:
- Why you should not always visualize connections in your data as connections in a diagram
- When simply getting the graph on the screen is not enough
- Why detailed custom item visualization makes a difference
- How customized interactivity can improve the user experience of your apps
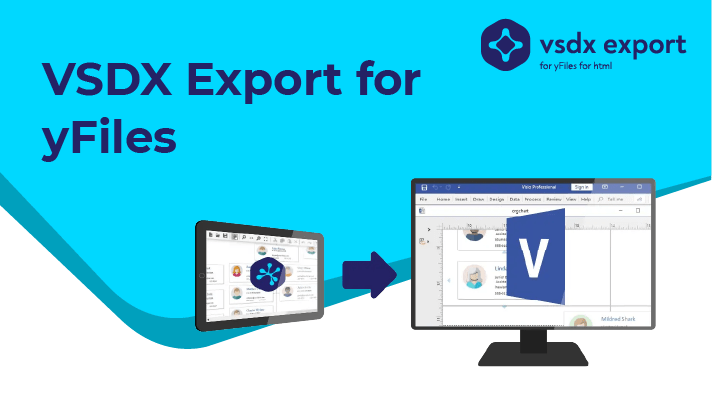
yWorks Webinar: VSDX Export for yFiles
In this webinar we introduce the new VSDX Export add-on for yFiles for HTML. This add-on lets you export yFiles diagrams to Microsoft Visio's *.vsdx file format.
The webinar consists of two parts: The first part gives a general overview of the features and use cases of the VSDX export. We also demonstrate the minimal setup to get started.
In the second part we briefly explain Visio's shape model and how the add-on converts yFiles graphs to Visio shapes, masters and style sheets. Afterwards there is a live coding session, where we show how you can import Visio stencils and use its masters and style sheets as templates for nodes. In the questions & answers of this second part we demonstrate how, for example, a company logo can be added to the created Visio file.
Learn more about the VSDX Export for yFiles for HTML here:
https://www.yworks.com/vsdx-export
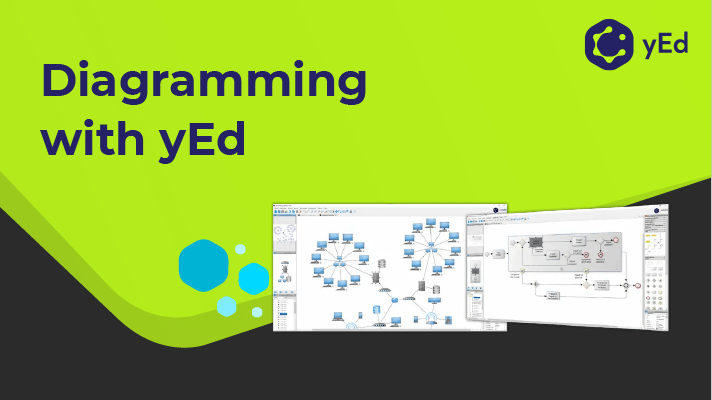
yWorks Webinar: Diagramming with yEd
In this webinar, we give you an overview and how to diagram easily with yEd, the oldest member of the yWorks diagram editor family.
More information about the yWorks diagram editor tools:
yEd - https://yworks.com/yEd
yEd Live - https://www.yworks.com/products/yed-live
Graphity for Confluence - https://graphity.com
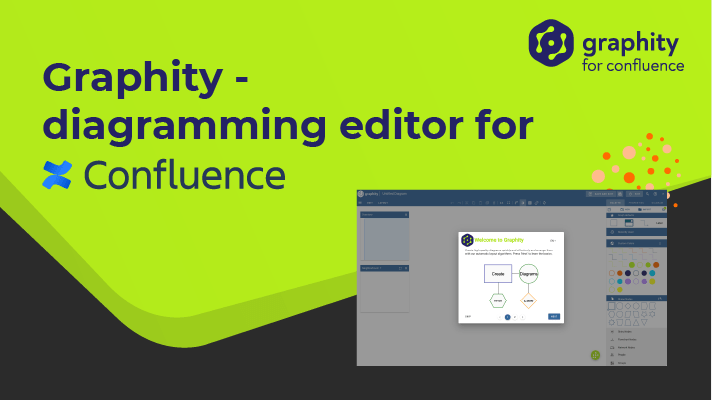
yWorks Webinar: Graphity - Diagramming Editor for Confluence
This half hour long webinar gives an introduction to Graphity the all-purpose diagramming editor for the enterprise wiki "Atlassian Confluence".
Topics included:
- Why you need Graphity
- Graphity and yEd Live
- Diagram Creation with Graphity
- Tips and Tricks
- Development Roadmap
- Q & A
More information about Graphity for Confluence:
https://graphity.com
yWorks Webinar: What's new in yFiles 2019
The webinar consists of two parts: The first part is about features that are available in all platforms (Java, .net, Web). We show new features and functionality concerning automatic graph layout and graph analysis algorithms. We show the new compactness options for the hierarchic and the tree layouts, and the integrated labeling and bus layout feature of the generic edge routing algorithm.
The second part is specifically about yFiles for HTML, the software diagramming API for the web. We show NPM module bundling, EcmaScript Modules, and ES2015+ features, as well as code completion improvements for Visual Studio Code and WebStorm. We also present the new CSS animation and styling features and the improved WebGL and Canvas support.
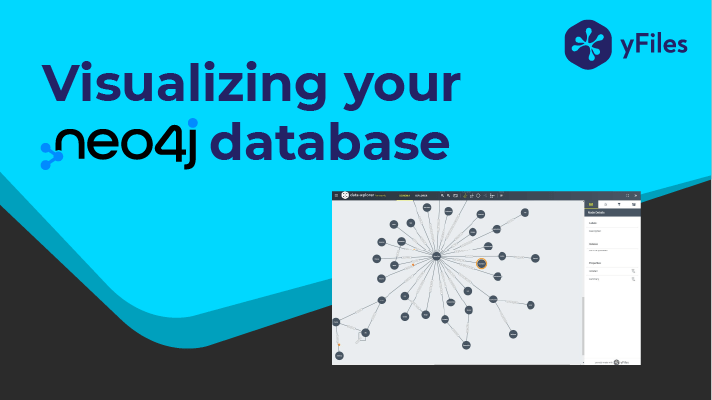
yWorks Webinar: yFiles and Neo4j
Topics include:
- brief introduction to yWorks
- an overview over the yFiles software programming library capabilities
- quick walkthrough through some of the online demos
- code walkthrough through a very simple web application that shows how to connect yFiles for HTML powered visualizations with a Neo4j database
- live coding, showing how templating with VueJS and custom layout configurations can be applied to diagrams created from graph database data, as well as how to add a heatmap effect to the visualization
yFiles - the Superior Diagramming SDK
Topics:
- Introducing: The yFiles Product Family
- Brief Overview of yFiles Functionality
- What's new? News and updates about yFiles
- Getting Started with yFiles: Making the Most of Developer Resources
- How to get Support when Developing with yFiles
you might want to explore
Why, how, what? —Just ask the diagramming experts!

Our team is happy to advise you – no strings attached. Let's talk about your project and find the perfect solution for your needs!
E-mail: hello@yworks.com
Your message has been sent.
Your request could not be sent. Please reload the page and try again.
If the problem persists, please report the error to webmaster@yworks.com.
Learn more in our privacy policy.


