Products
Downloads
Demos
RSS Newsfeed
2025-10-2
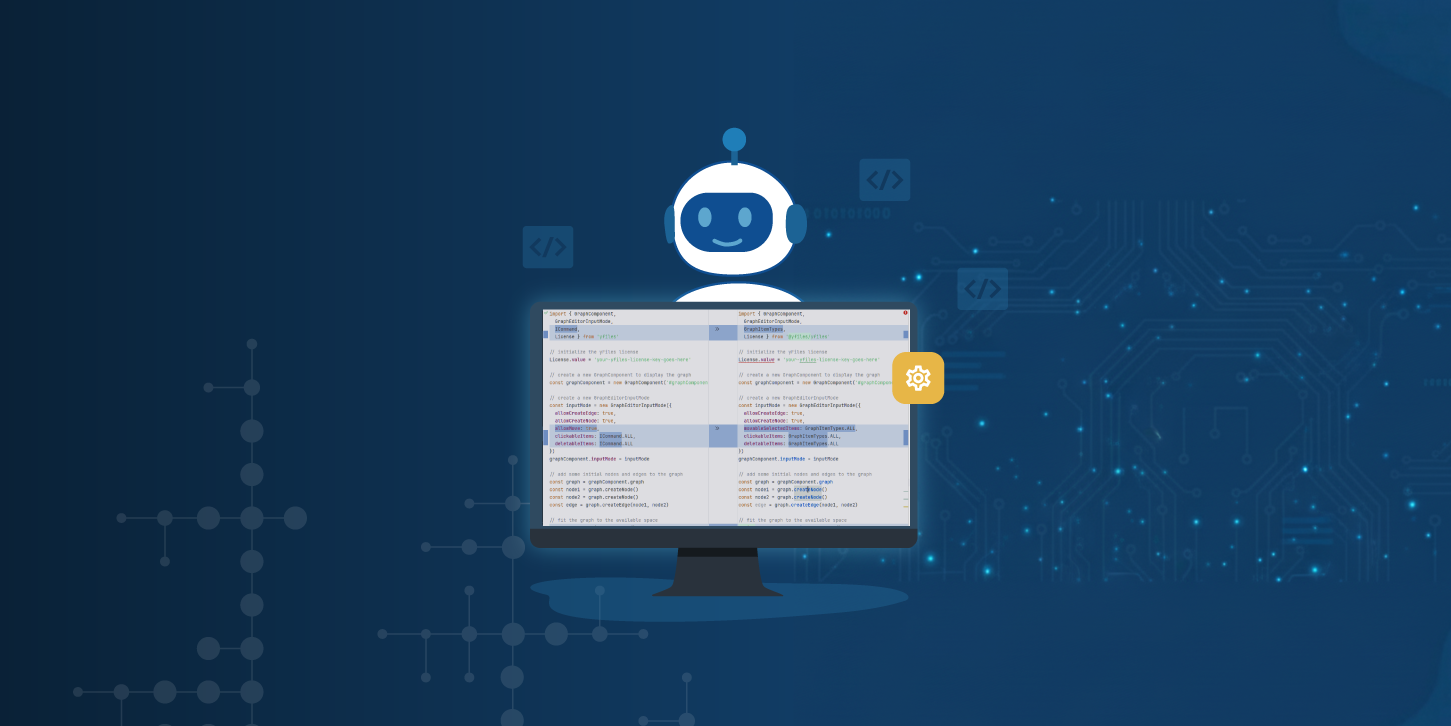
From Experiments to Agents: How yWorks Uses AI to Democratize Graph Visualization
How yWorks progressed from early LLM experiments to agentic, tool‑driven workflows that reliably answer yFiles questions and scaffold apps.
2025-4-9
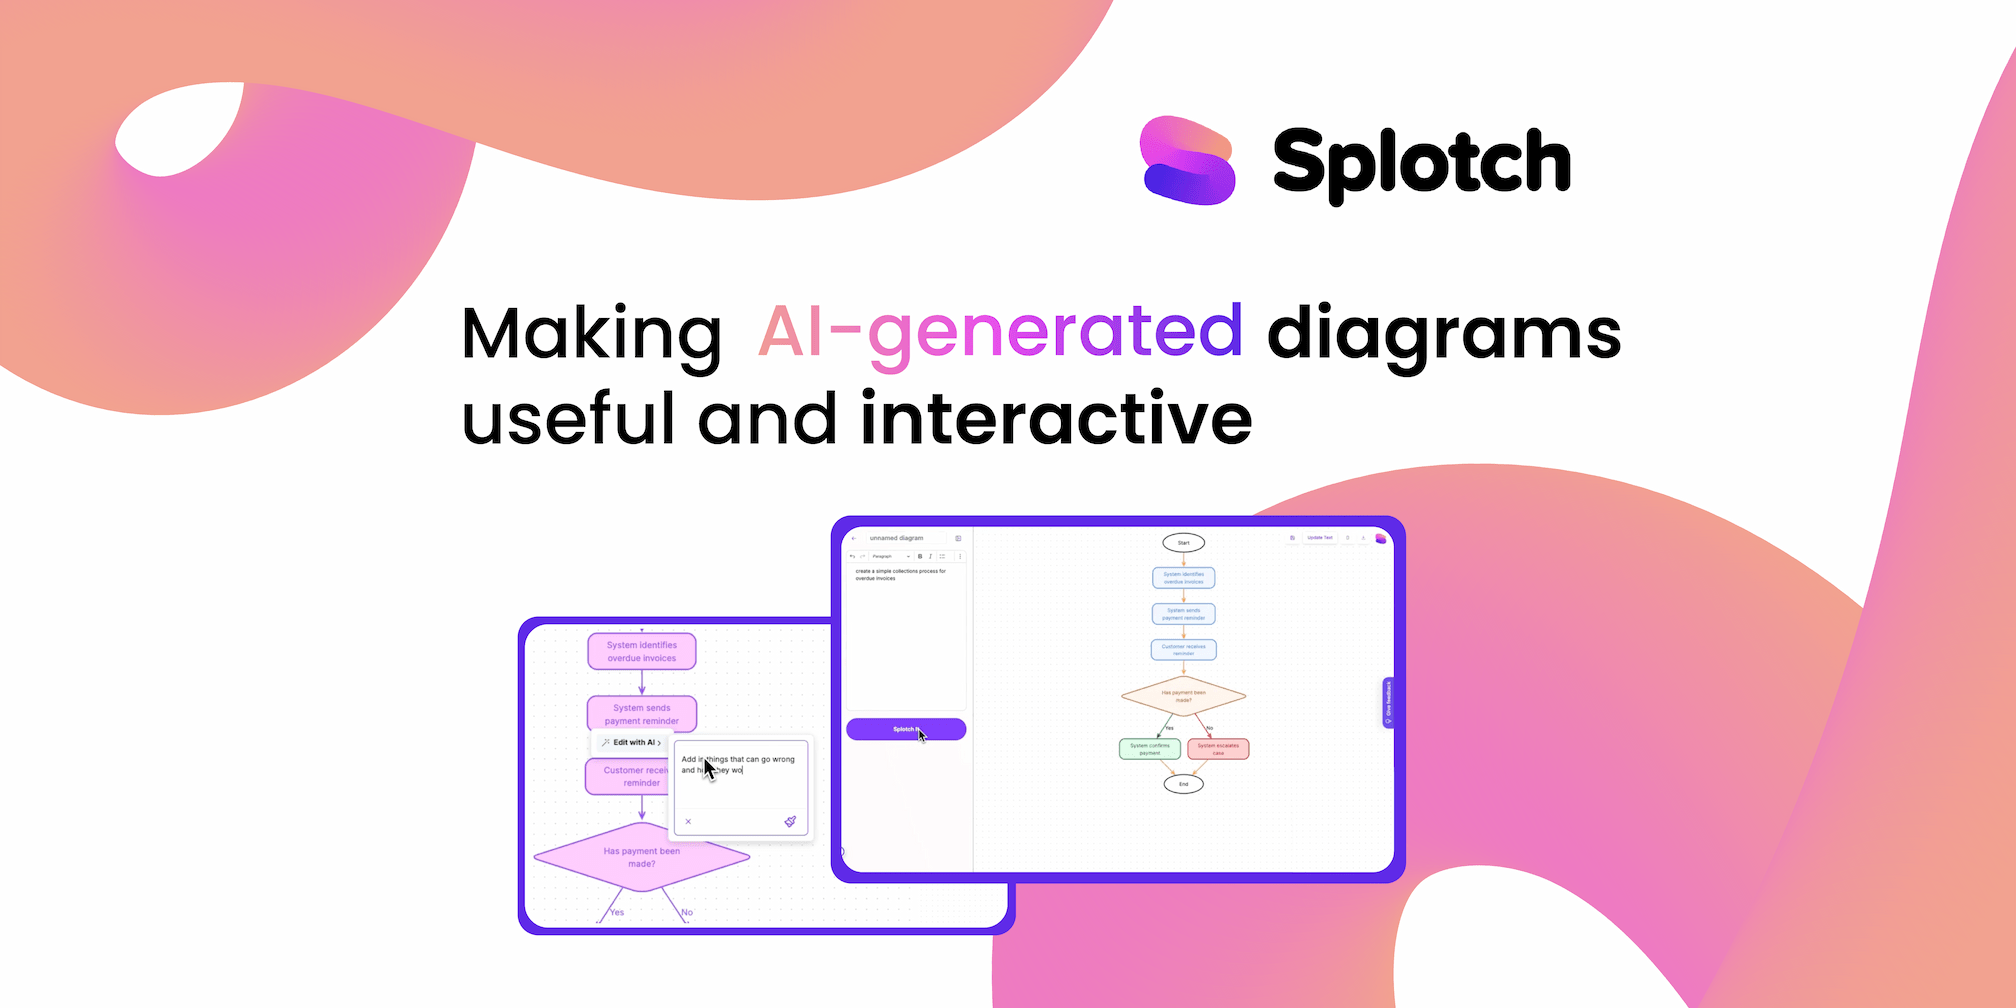
Making AI-generated diagrams useful and interactive
AI-generated diagrams need to be clear, editable, and dynamic. Discover how Splotch uses yFiles to create interactive visuals that stay seamlessly linked to text, making complex information easier to manage.
2025-3-11
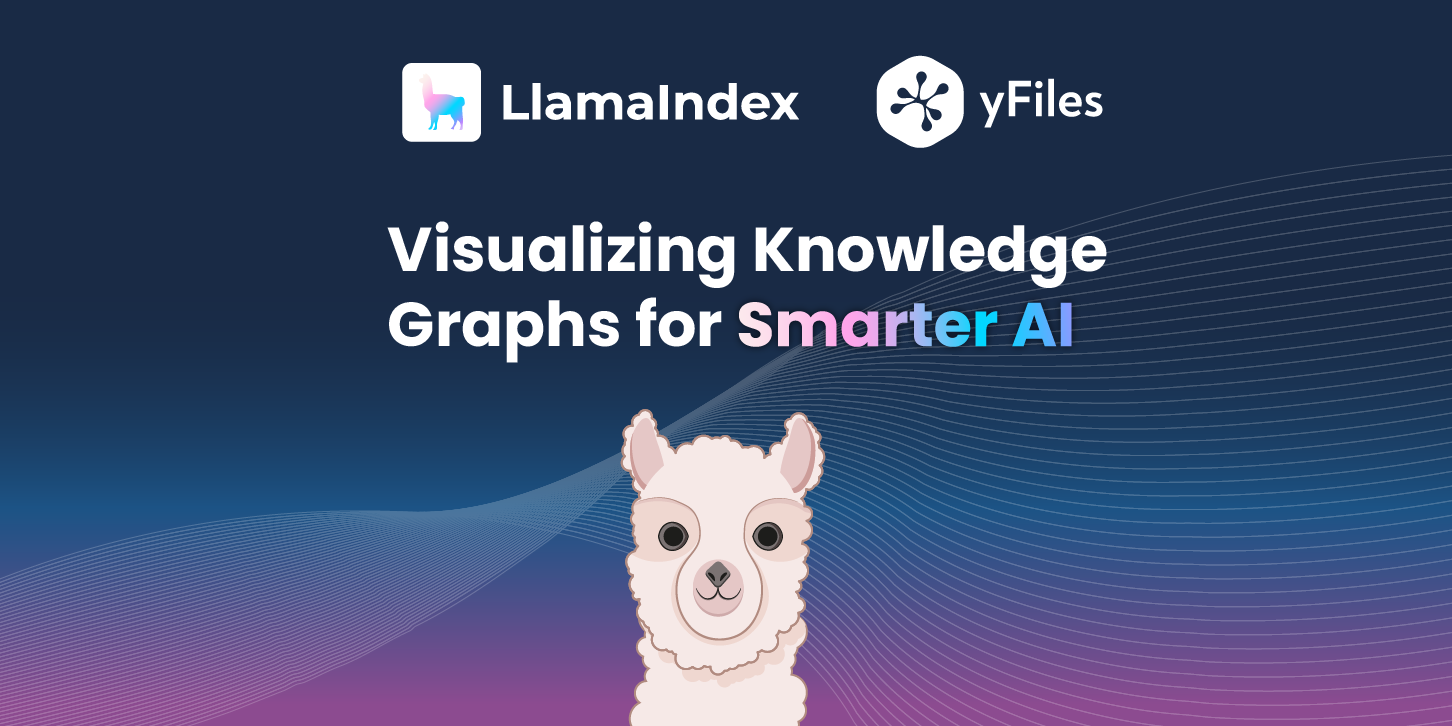
Enabling LLM development through knowledge graph visualization
Discover how to empower LLM development through effective knowledge graph visualization. Learn to leverage yFiles for intuitive, interactive diagrams that simplify debugging and optimization in AI applications.
2025-2-18
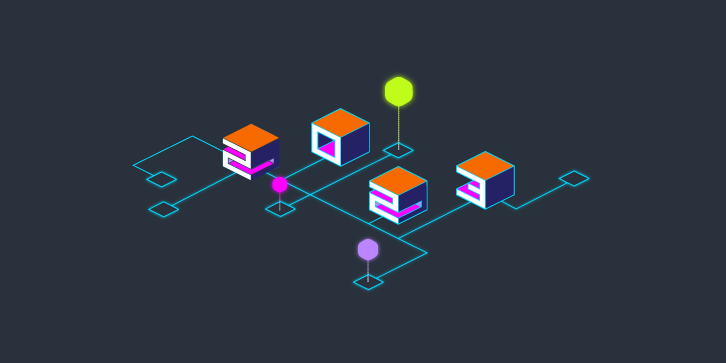
Maximizing the value of large graphs through collapsing techniques
Discover how JDisc uses advanced techniques like collapsing to enhance network visualization and management. This case study explores methods to improve clarity, usability, and decision-making in complex IT infrastructures, showcasing strategies for effectively handling large-scale network data.
2024-7-22
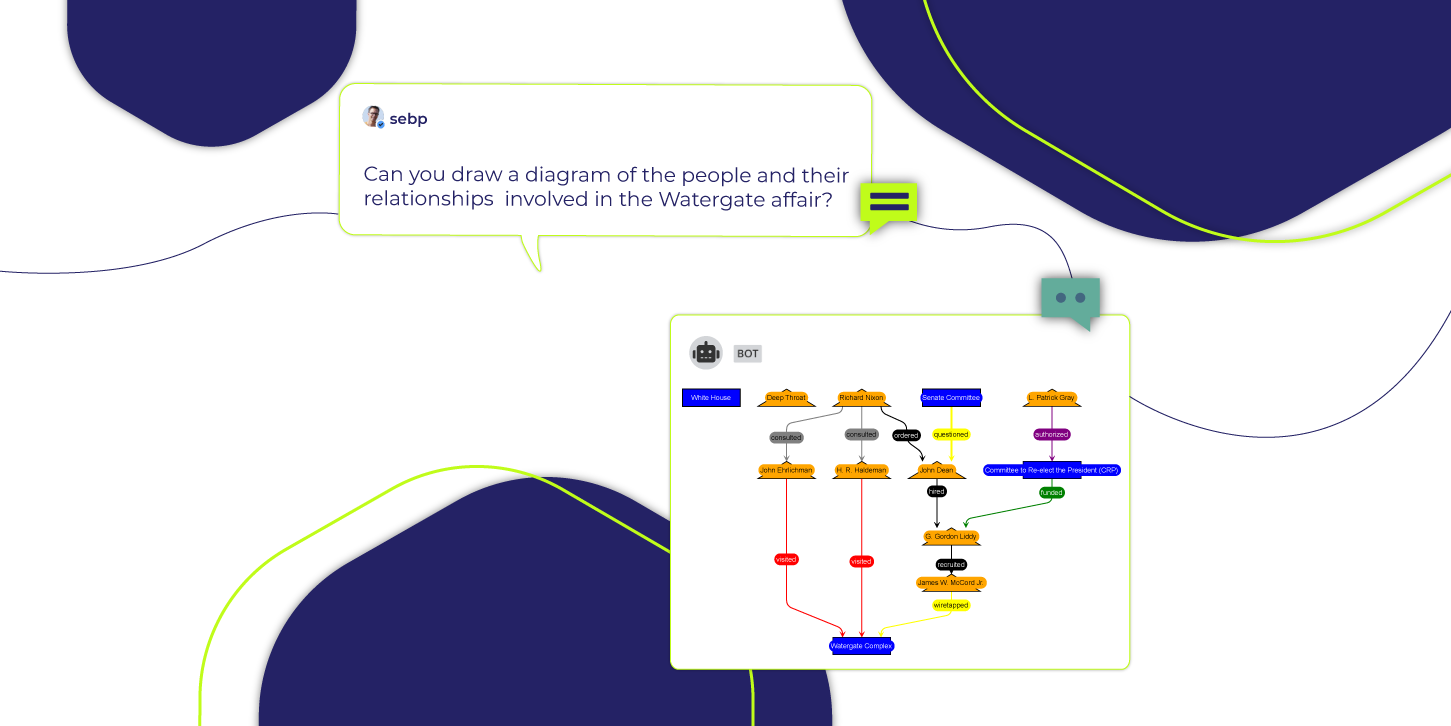
Creating Graph Visualizations by prompting Large Language Models
Benefit from the full potential of AI-supported visualization with the innovative diagram app yEd Live
2024-5-8
Exploring the Graph Behind Little Alchemy 2
Crafting Complex Graphs: Exploring Little Alchemy 2 with yFiles GraphWidget in Jupyter Notebooks.
2024-3-28
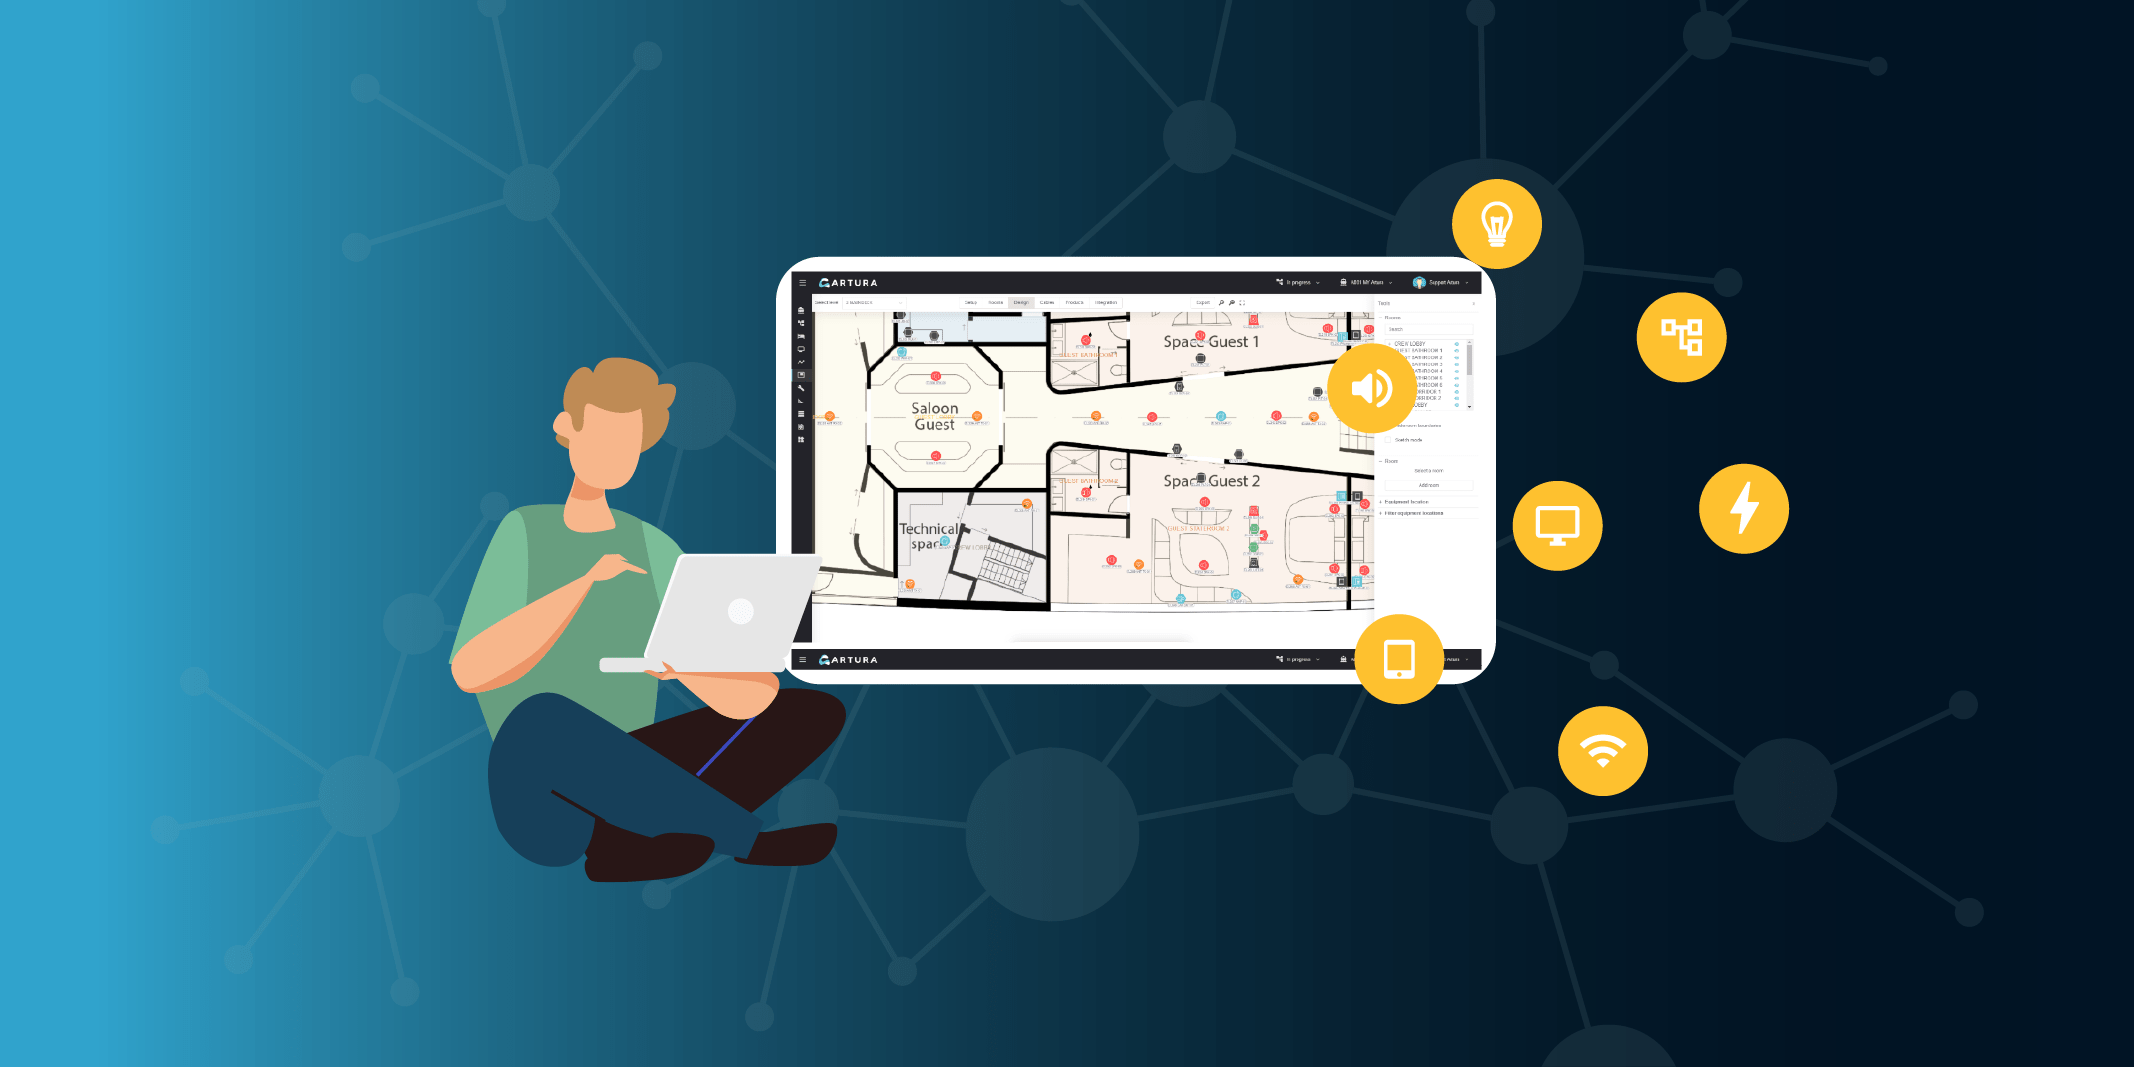
Elevating Engineering Excellence through Dynamic Data Visualization
How Artura boosted design & development with graph visualization.
2024-1-31
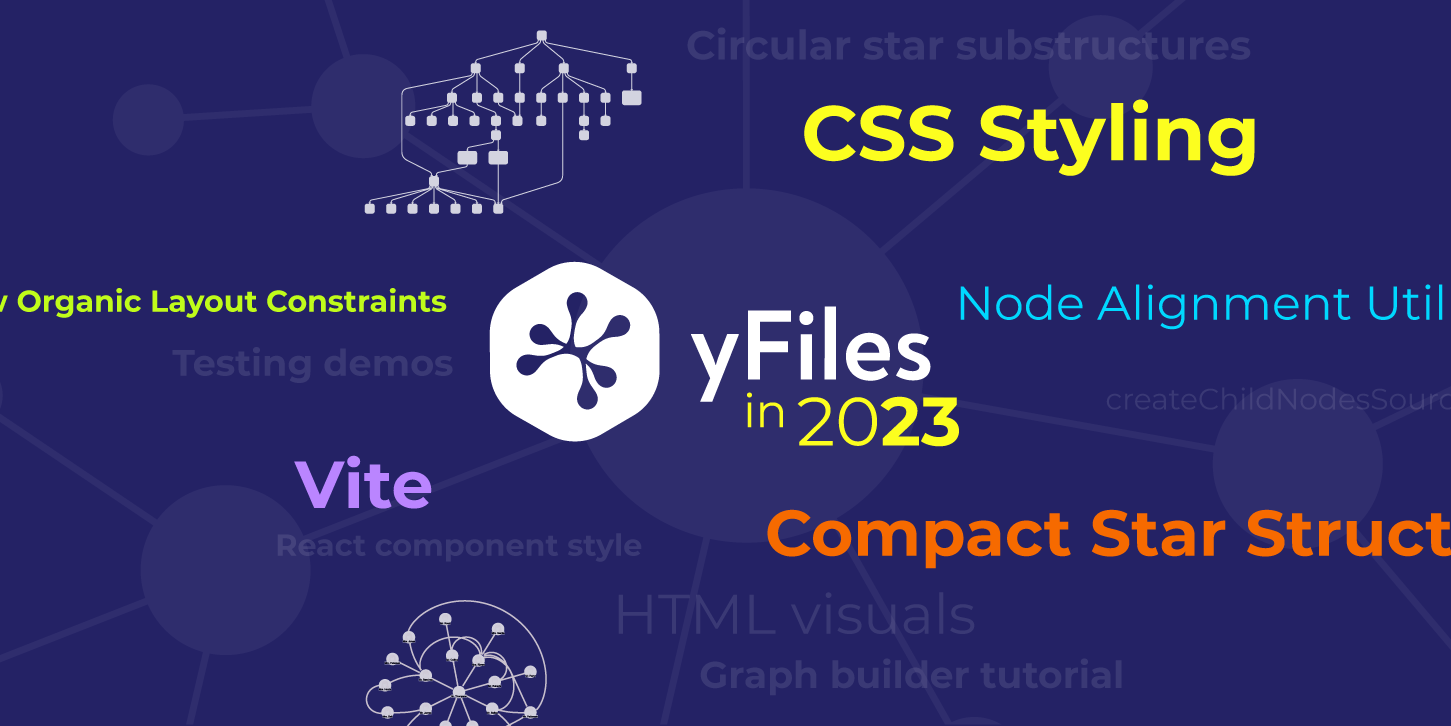
Empowering Graphs: A Year of Transformative Innovations and Achievements with yWorks
As we reflect on 2023, we are reviewing the key moments and milestones of the past year. From new product releases and AI integration to events, making it a year filled with activity and excitement. Let's revisit these highlights together...
2023-7-10
Introducing yFiles for HTML – Major Release Version 2.6
yFiles for HTML version 2.6 brings a wealth of powerful new features and improvements that strengthen the graph visualization capabilities of developers.
2023-6-7
ChatGPT and yEd Live
Generate diagrams from a simple text description in yEd Live with ChatGPT.
1
2
3
...
16
Latest Blog Posts
From Experiments to Agents: How yWorks Uses AI to Democratize Graph Visualization
Making AI-generated diagrams useful and interactive
Enabling LLM development through knowledge graph visualization
Maximizing the value of large graphs through collapsing techniques
Creating Graph Visualizations by prompting Large Language Models
Use Cases
Business process management
Company structures
Data management
Supply chain management
Test and experience
yFiles free
of charge!
Free support
Fully functional
100+ source-code examples
Try now