Visualizing knowledge graphs for accurate and intuitive AI interactions
Knowledge graphs play a pivotal role in AI-driven applications, particularly in large language model (LLM)-powered chatbots. These graphs organize vast datasets, making information retrieval faster and more precise, which is essential for creating effective, context-aware responses.
Data frameworks like LlamaIndex bridge the gap between LLMs and various data structures that store the relevant information, making it easier to build applications that use AI features, for example with the help of CreateLlama.
To provide the necessary context to the LLM, the AI integration uses a Graph Retrieval-Augmented Generation (RAG) approach. However, managing and interacting with knowledge graphs pose significant challenges for developers. These graphs often involve complex relationships and intricate structures, making debugging and optimization difficult without clear visualization tools.
The challenge of working with knowledge graphs
Developers building AI agents often struggle with knowledge graphs due to the complexity of data relationships, the challenge of debugging response paths for accuracy, and the need to optimize data flow for performance. Without effective visualization tools, these obstacles can lead to inefficiencies, making it harder to interpret, debug, and refine AI-driven insights.
Graph visualization matters for AI developers
AI developers need tools that simplify the interaction with complex data structures. A robust visualization framework makes it easier to debug and optimize the performance of the graph, ensuring that the chatbot or AI application works effectively.
Graphs allow developers to explore the reasoning behind responses, validate the accuracy and relevance of data, and streamline the entire development process. By providing clear visual insights, graphs help accelerate the creation of more reliable and efficient AI systems.
Data-driven visualization and interactivity are key
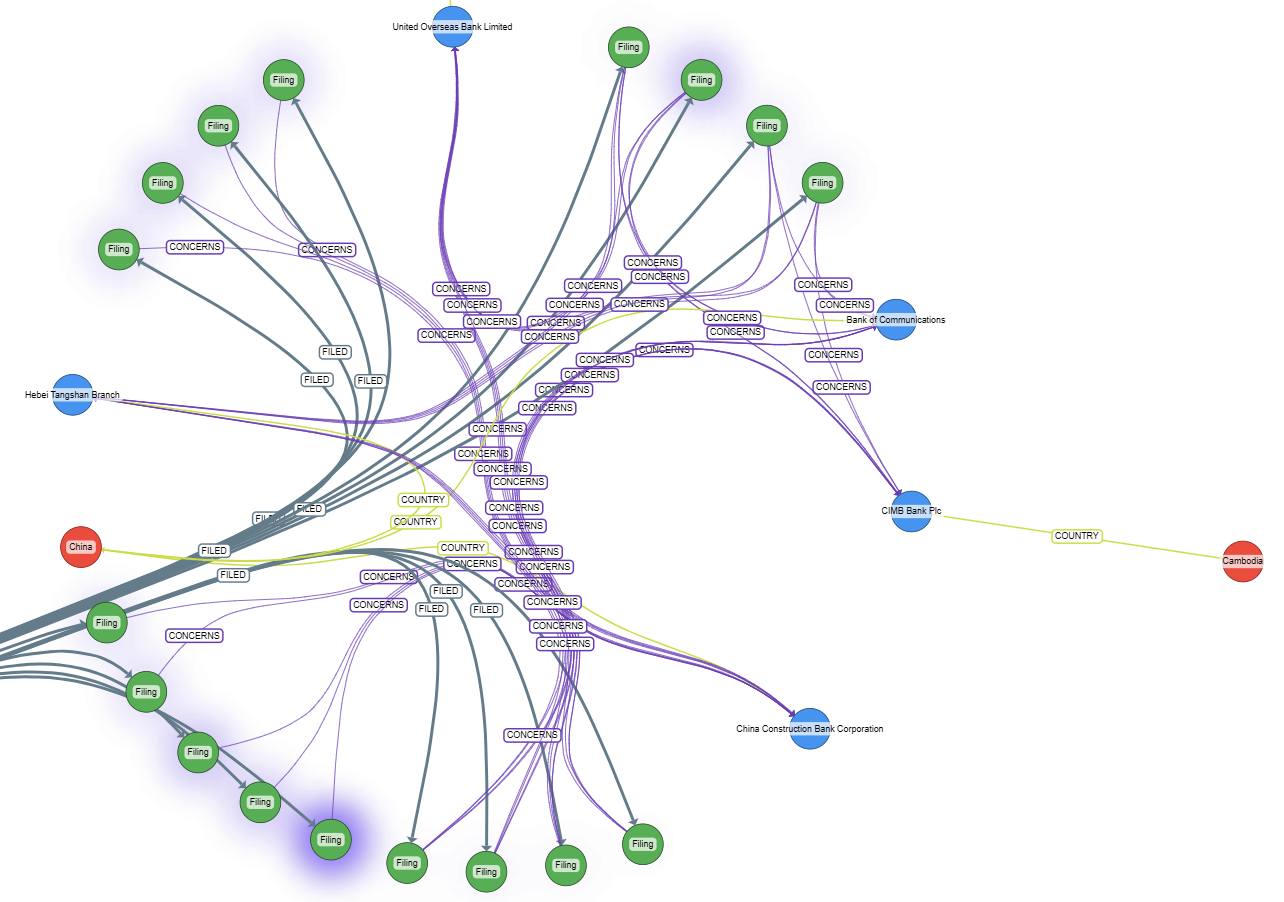
Integrating visual graph outputs into LLM frameworks like LlamaIndex provides significant benefits. Developers gain clarity in data relationships by visually mapping nodes and edges, making the flow of information more intuitive. Debugging becomes simpler as active nodes and pathways are highlighted, allowing errors to be quickly identified. Optimization improves as inefficiencies can be spotted and refined in real time.
Moreover, interactive visualizations offer significant advantages over static images, especially when dealing with large and evolving graph structures. They enable developers to seamlessly navigate complex data, zoom in on key areas, and reveal additional details as needed by interacting with the graph. Real-time updates further enhance this experience by reflecting changes instantly, allowing developers to monitor data flow dynamically, identify bottlenecks as they occur, and fine-tune their AI systems with immediate feedback.
Challenges in visualizing complex and dynamic graphs
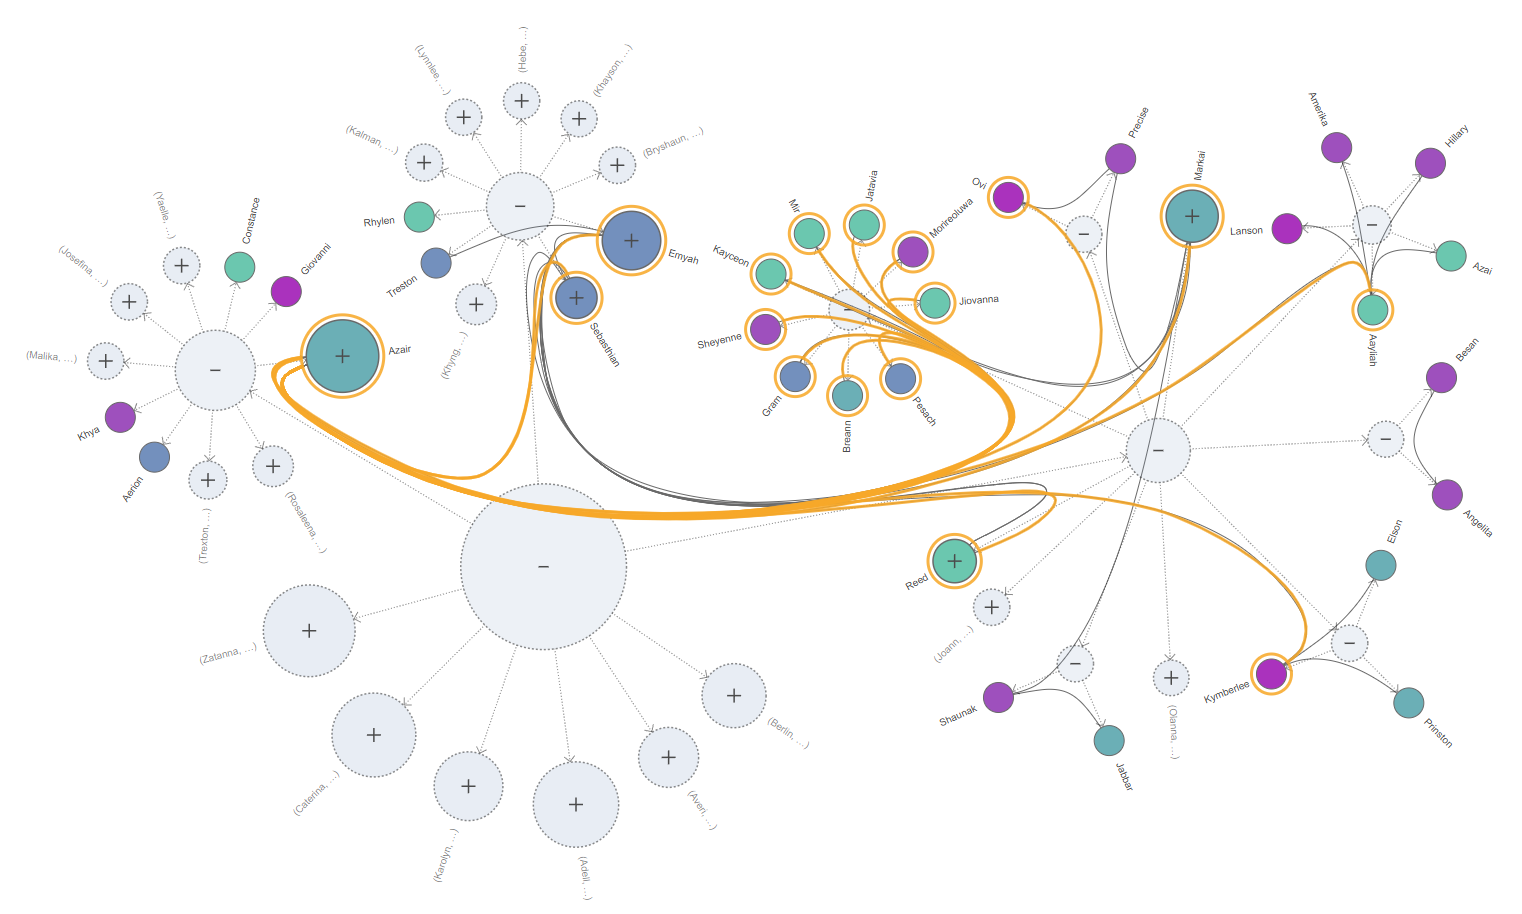
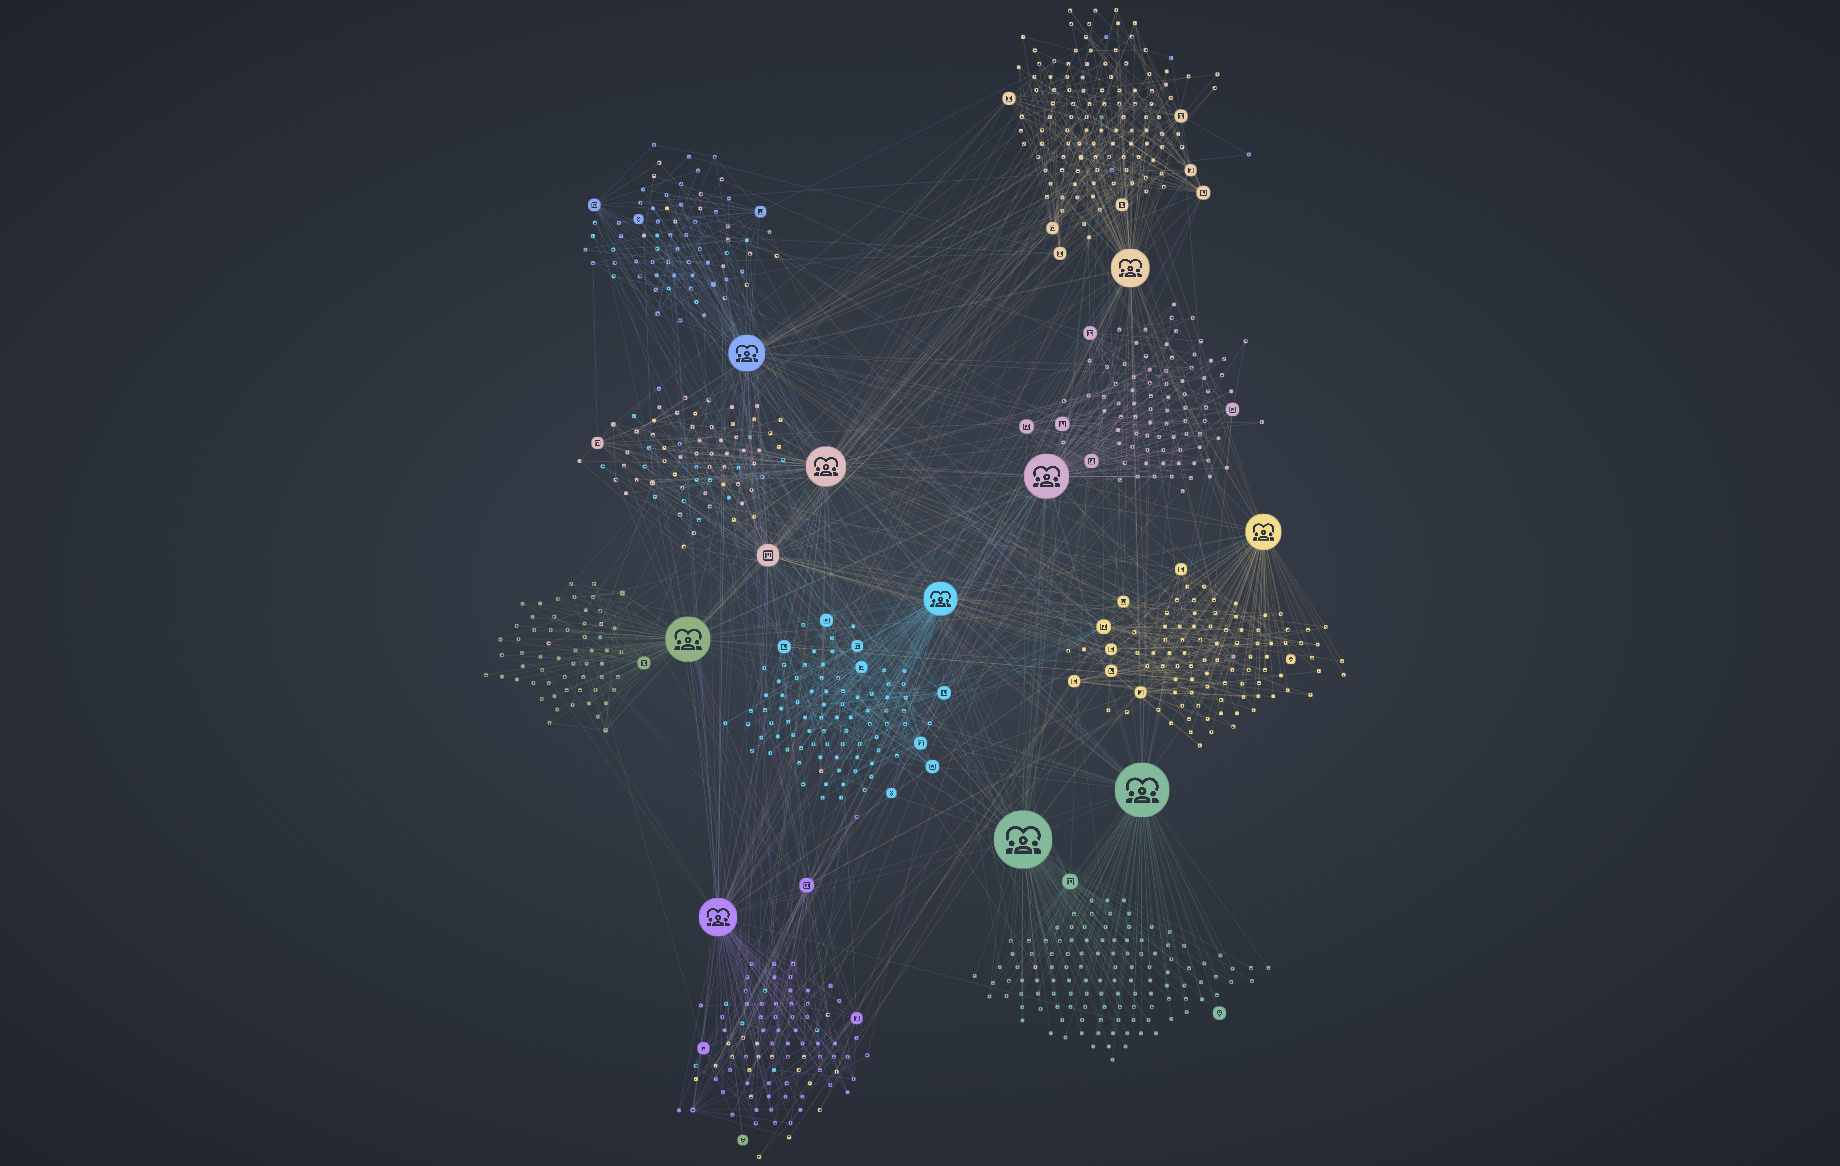
Visualizing large and complex knowledge graphs presents significant challenges, including navigating massive data sets, identifying meaningful clusters, and managing dynamic interactions. Developers often struggle with rendering large graphs, which can appear cluttered and confusing, making it difficult to identify key relationships or areas of interest.
Exploring dynamic graphs adds complexity, as real-time updates, interactive features such as zooming and folding, and grouping of nodes for clarity require advanced tools. Solutions like yFiles address these issues by offering customizable layouts, clustering options, and dynamic visualization capabilities that ensure clarity, scalability, and real-time interaction for efficient exploration and debugging of complex data.
yFiles - The Network Visualization SDK
yFiles addresses the challenges of visualizing knowledge graphs. This powerful software development kit (SDK) enables the creation of interactive diagrams and the analysis of complex networks and data relationships. By seamlessly integrating yFiles with LLM frameworks like LlamaIndex, developers can create tailored, interactive, data-driven graph visualizations.
yFiles offers a versatile API that addresses all requirements for effective knowledge graph visualization. For example, requirements like the following can be solved easily:
- Highlight active nodes and relationships during queries
- Dynamically expand to reveal deeper connections
- Offer real-time updates as data flows through the system
With yFiles, visualizing and interacting with knowledge graphs becomes intuitive, significantly reducing debugging time and facilitating better optimization of AI agents.
yFiles’ extensive library of automatic layout algorithms enables seamless integration, making it effortless for developers to render complex knowledge graphs, highlight activated nodes during operations, and dynamically adjust graph layouts for improved clarity and exploration. For instance, integrating yFiles with LlamaIndex allows developers to visually track data queries in real-time, simplifying debugging and optimization. Leveraging these existing algorithms provides developers with deeper insights and enhances the efficiency of their AI systems.
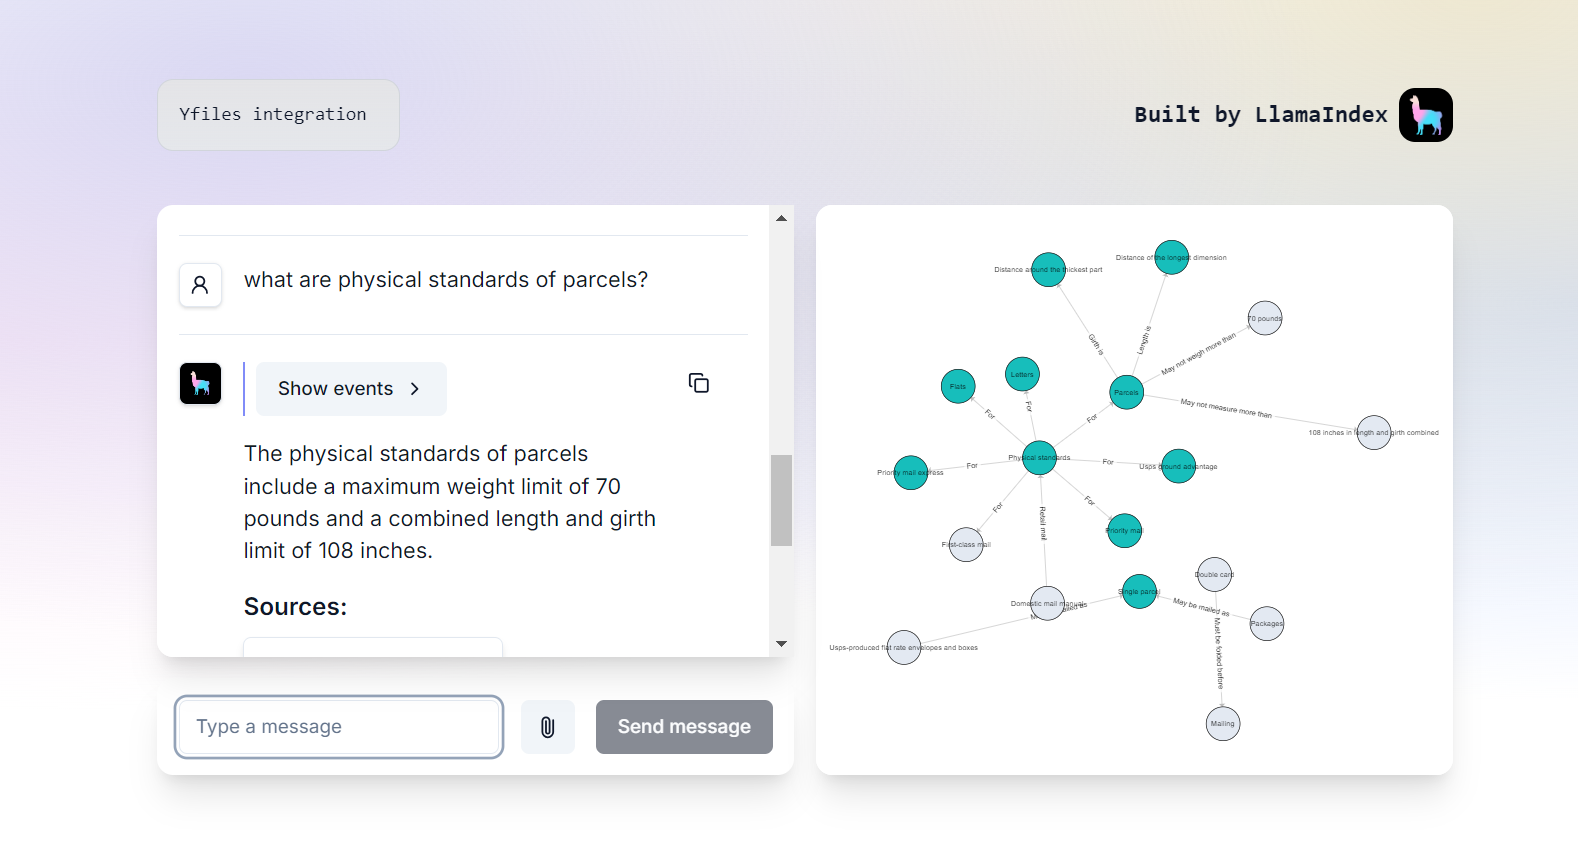
Practical Integration of yFiles in Create Llama
Discover how to integrate yFiles in a Create Llama project with this hands-on guide. The project demonstrates the process step-by-step.
For a comprehensive guide and example, visit the integration guide on https://yfiles.com/llama-index.
The yfiles-graph-for-create-llama project on Github illustrates how yFiles can be integrated in a Create Llama created project.

Graph your way to chatbot brilliance
While LlamaIndex pairs instantly with yFiles, it is not the only framework that benefits from this integration. Tools like LangChain, Haystack, and Weaviate can also leverage yFiles' powerful visualization capabilities to present and explore knowledge graphs more effectively.
Using yFiles with these frameworks simplifies the visualization and interpretability of complex relationships and data structures. Whether you're managing knowledge graphs, navigating intricate data paths, or analyzing interconnected datasets, yFiles delivers clarity and insight in real-time.
Regardless of your chosen indexing or graph-based framework, yFiles equips your projects with the tools to make interconnected data both comprehensible and actionable.
Learning and resources
Educational support
- yFiles - the Network Visualization SDK
- Detailed yFiles documentation and developer's guide for graph visualization.
- 5-steps guide to visualizing knowledge graphs.
- Interactive knowledge graph demo.
- create-llama GitHub repository.
- Explore the general yFiles + React example for integrating graph visualization with React.
Conclusion
The value proposition: Elite Knowledge Retrieval with yFiles
yFiles is an excellent choice for LLM-based projects that rely on graph data structures. It offers flexible and intuitive tools for visualizing complex relationships, making it easier to interpret and analyze large datasets.
Refine your chatbot and LLM workflows by integrating yFiles. Enhance your ability to explore and present interconnected data clearly and effectively, empowering users with precise insights and impressive visualization capabilities.
yFiles transforms the way developers interact with knowledge graphs, making them more accessible and intuitive. For LLM frameworks like LlamaIndex, yFiles offers superior visualization capabilities, ensuring efficient debugging, optimization, and data exploration. By incorporating yFiles into your workflow, you will certainly drive results by fully harnessing the power of graphs, enabling the creation of smarter, more reliable AI-driven applications