Revolutionizing graph visualization: LLM integration with yEd Live for enhanced graph editing
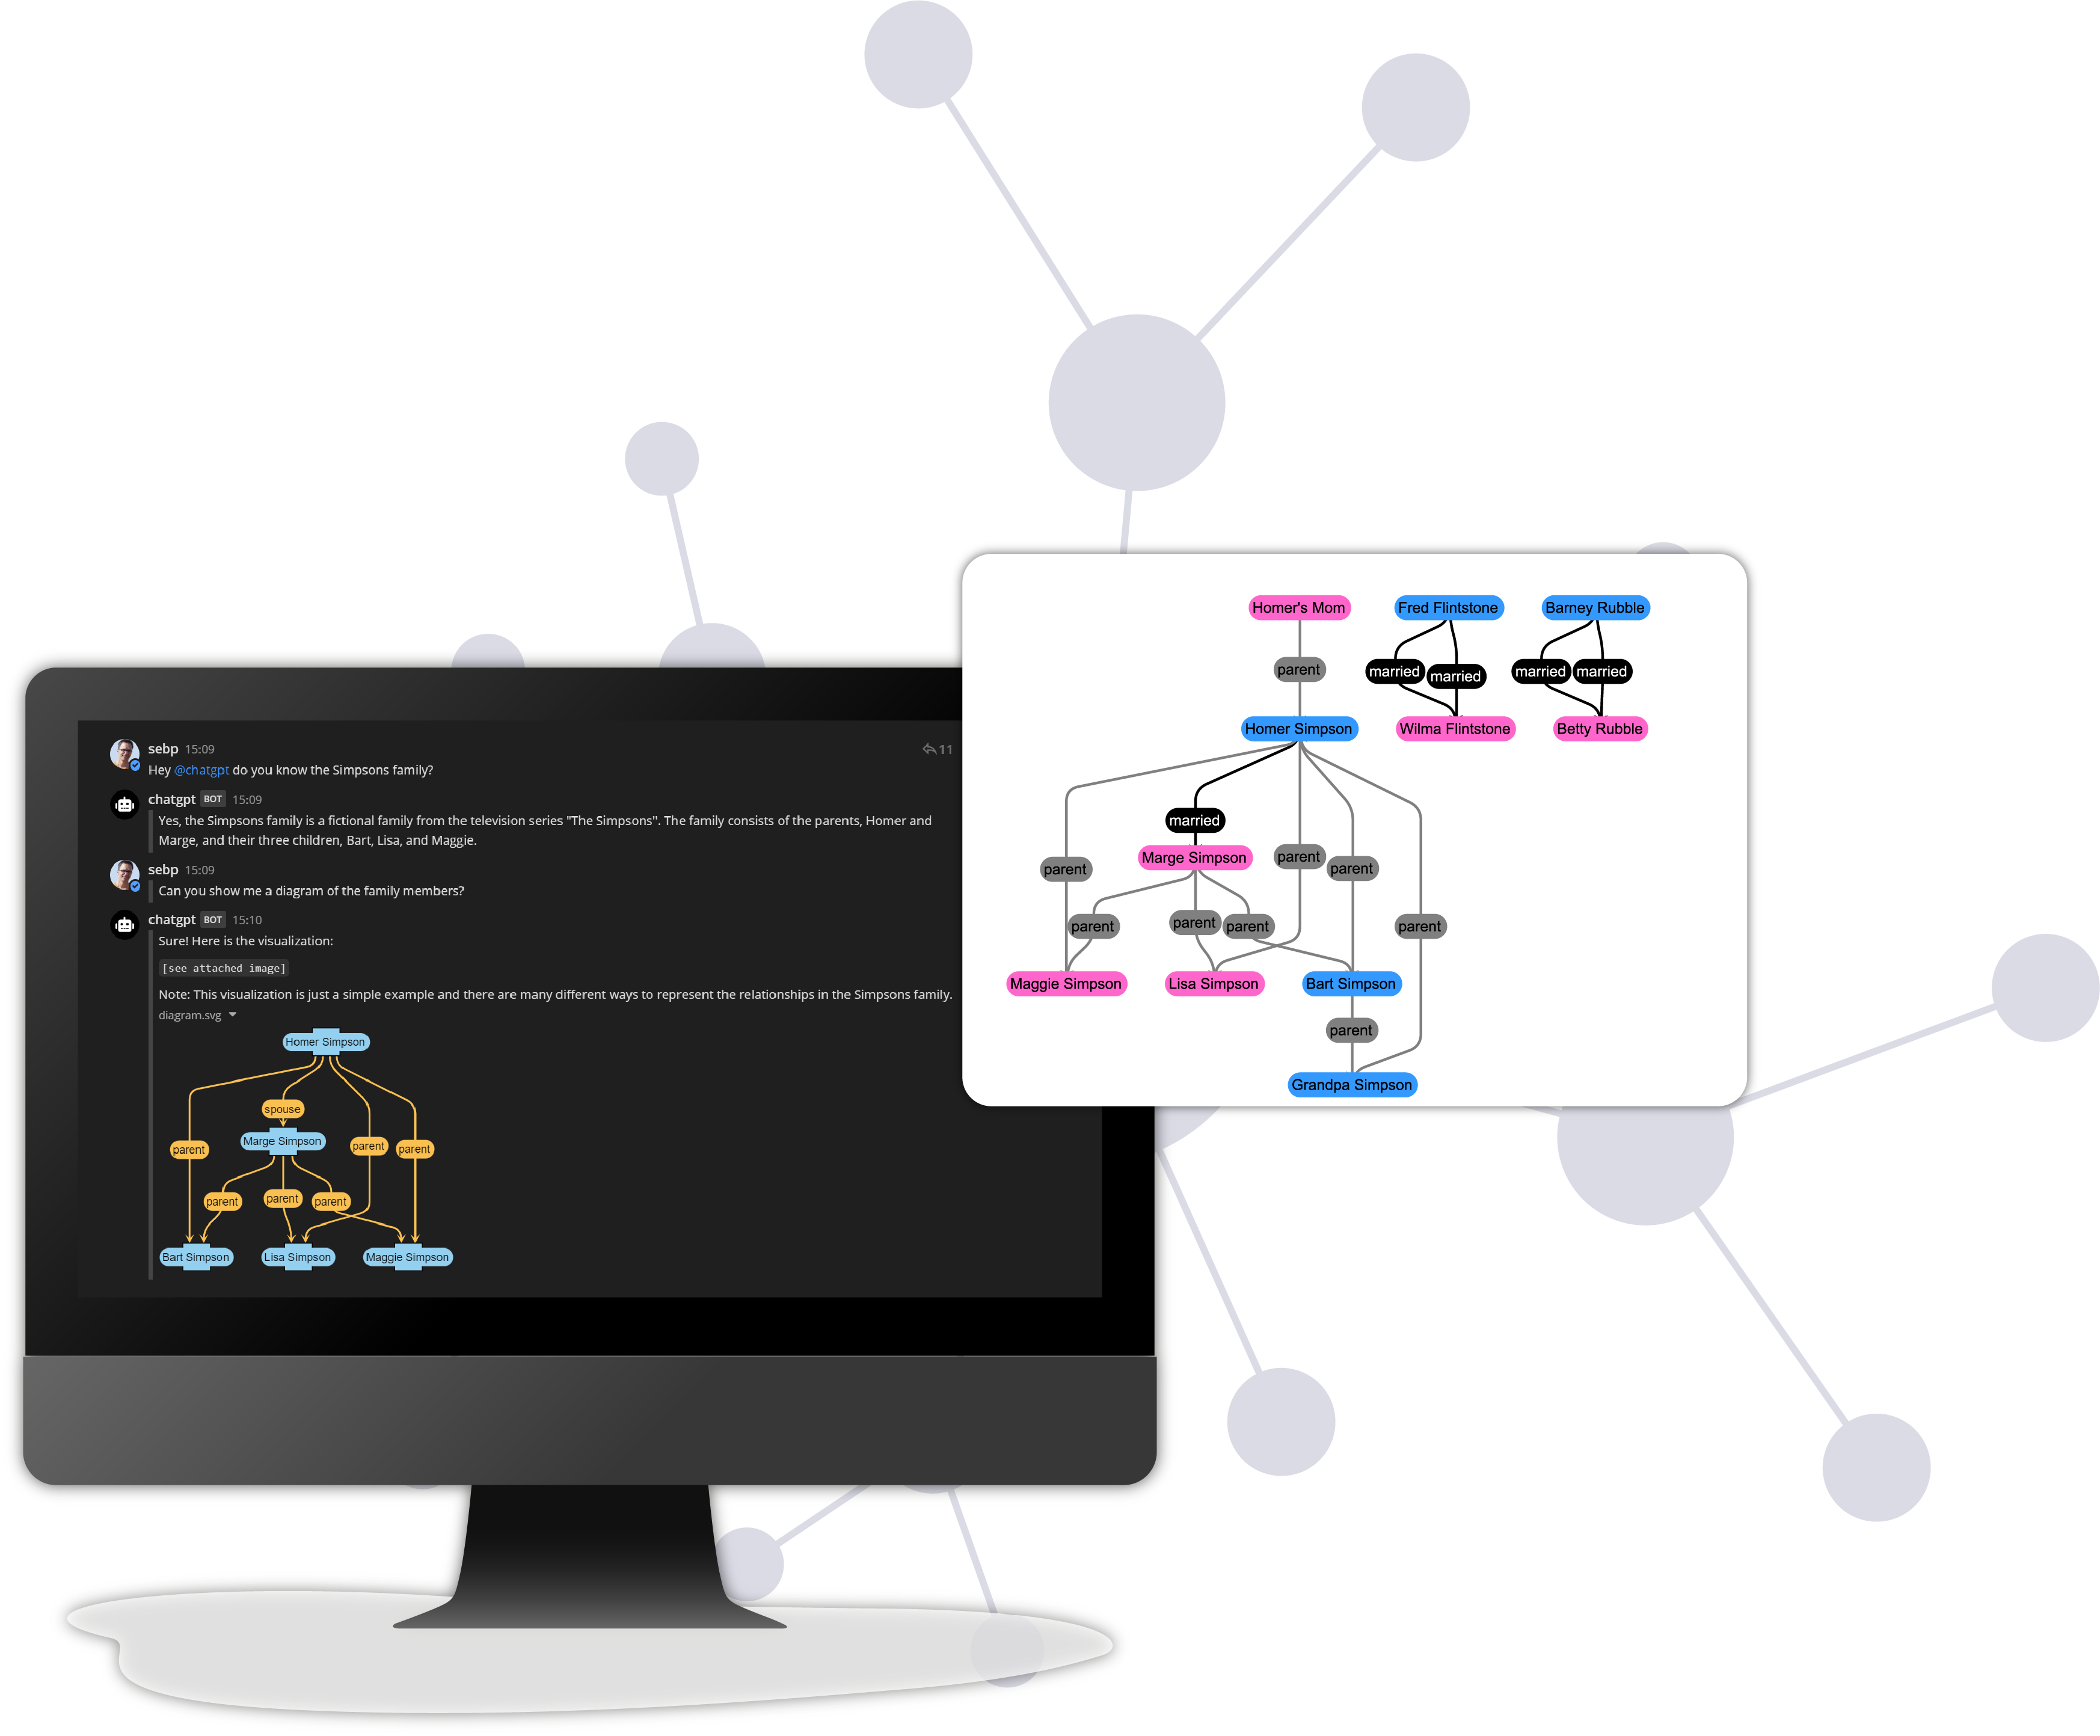
The International Symposium on Graph Drawing and Network Visualization (Graph Drawing) is a globally recognized annual academic event. In 2023, the 31st Graph Drawing took place in Palermo, Italy. Leading up to the symposium, we focused on using Artificial Intelligence (AI), particularly Large Language Models (LLMs), to enhance graph editing processes, and we submitted our findings as a contribution to the event. This text shares our experiences and insights from this endeavor, highlighting the intersection of AI and graph editing techniques.
Discover the power of AI-assisted visualization with the revolutionary yEd Live + LLM integration. Absolutely no coding skills required!
Key points of the yFiles - ChatGPT integration
Data visualization progress
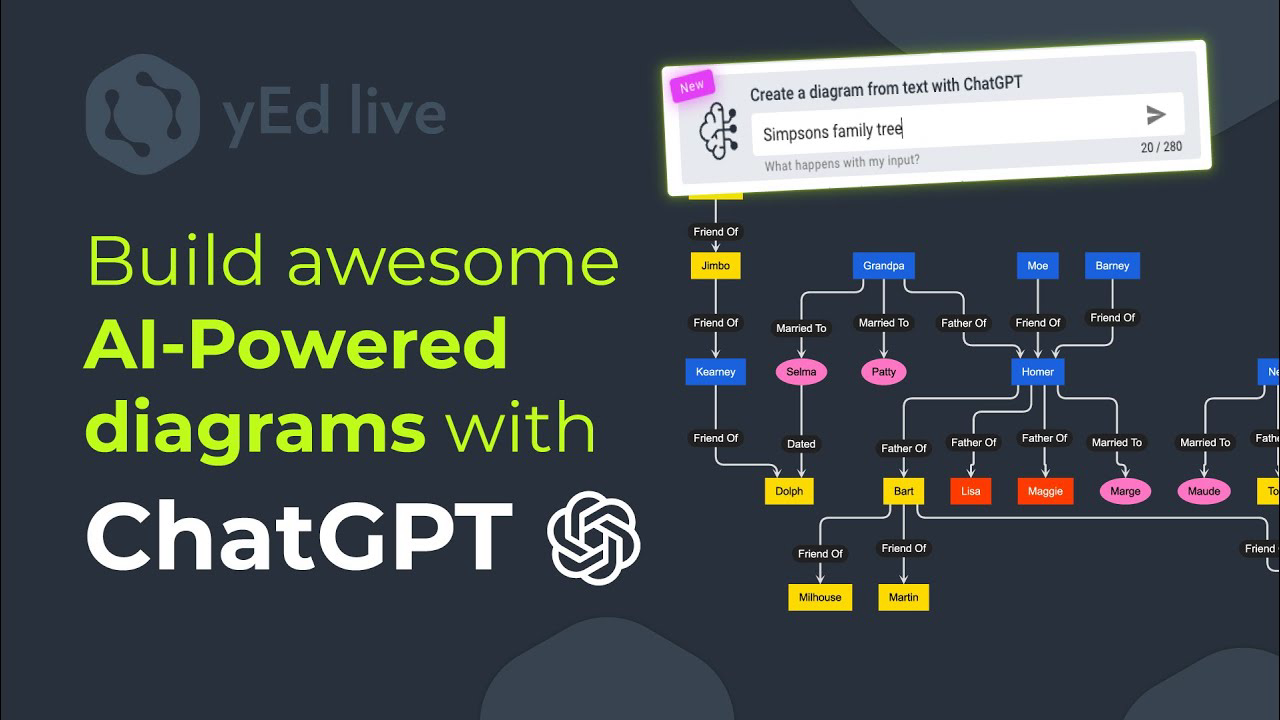
The integration of ChatGPT with yEd Live, our popular diagram editor, was set in motion a couple of months ago, heralding a new era of streamlined diagram creation and editing. This fusion promises to revolutionize the diagramming process, from brainstorming to refining, by seamlessly combining AI-driven assistance with robust editing capabilities.

The integration of Large Language Model with yEd Live marks a significant step forward in bridging natural language processing with graph editing. You can now give instructions to the yEd Live built in AI assistance, providing a novel and intuitive way to modify graph styles and layouts. The potential applications for this integration are vast, offering you a more efficient and user-friendly means of graph manipulation, enabling complex and custom interactions that cannot be represented by common user interfaces, enhancing data exploration, and allowing access to information for those with no coding skills.

Implementing LLM assistance in yEd Live
A couple of months ago, we embarked on our journey to integrate ChatGPT with yEd Live. yEd Live is basically designed to allow users to create, edit, and share diagrams in real-time through a web browser. It provides a platform-independent solution for creating various types of diagrams, such as flowcharts, network diagrams, organizational charts, and much more...
Given that we are well aware of how important user-graph interaction is for our yEd Live guests, we sought to integrate natural language support for graph editing, styling, and arranging.
We wanted to implement an intelligent assistant that lets you generate diagrams from merely a simple text description. We did make substantial progress in this regard!
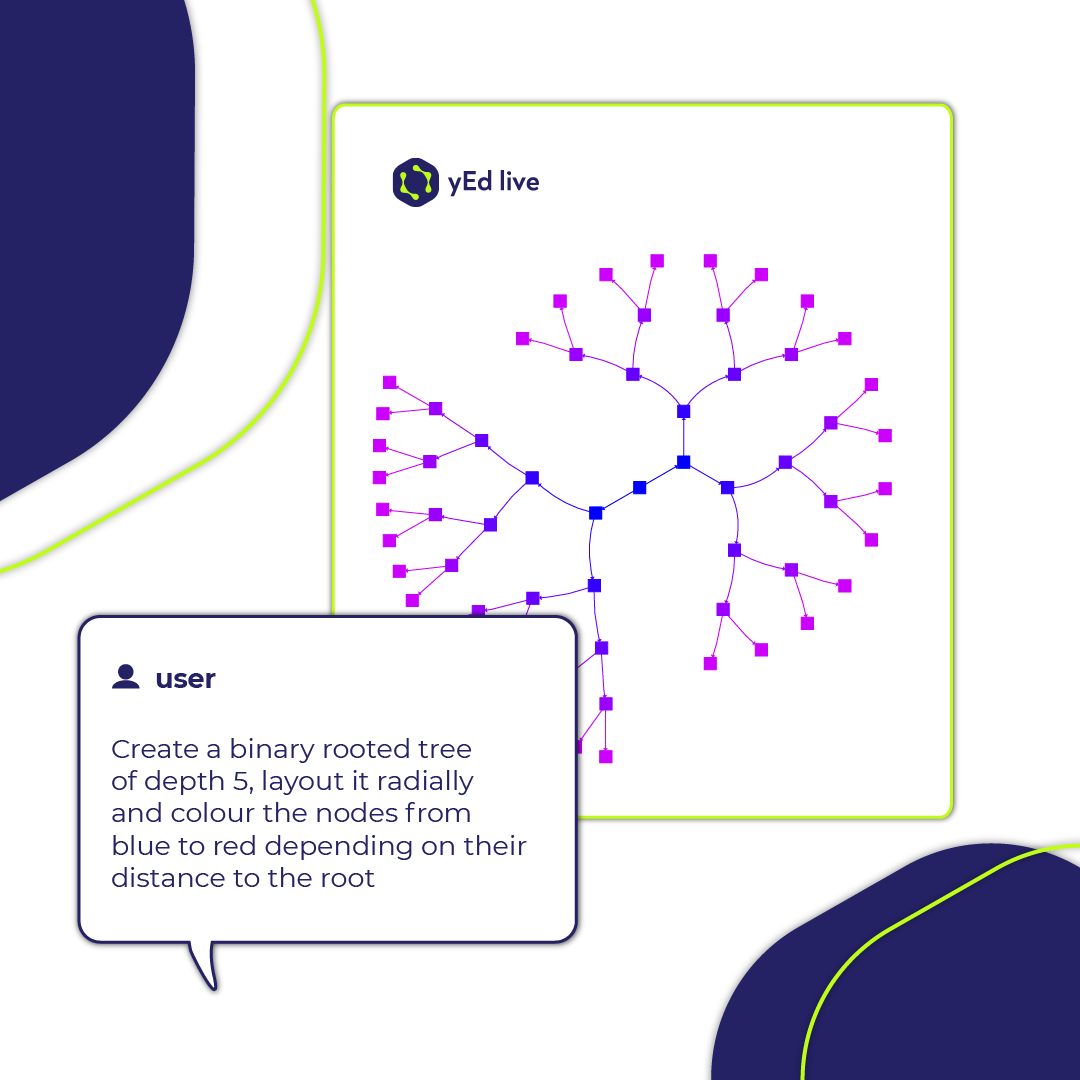
Just imagine - for one second - how hard it would be to achieve the following, using only the user interface (UI):
“Create a binary rooted tree of depth 5, layout it radially and colour the nodes from blue to red depending on their distance to the root".
This becomes effortless when using the integrated AI support. Just employ natural language commands, either through text or direct speech, to edit your graph, enabling prompts to be dictated and given via audio.
Try out the following sample inputs
- Select all nodes with one edge
- Color the selected nodes in blue
- Please change the color of the blue nodes to pink
- Add a label with "hello" to the selected nodes
- Change labels with "hello" to "user""
yWorks researchers integrate LLM with yFiles, sharing insights and challenges
So how exactly did this integration come about? Following is an overview of what the yWorks researchers were aiming for, the challenges they faced and the lessons they learned!

The integration process commenced with experimentation using the LLM (ChatGPT's large language model), and gradually refining the approach based on trial and error.
 The main observation was that when you do a graph drawing, typically you have
very basic operations... but sometimes you would like to use more complex and specific functions.Benjamin Niedermann, Layout Expert, yWorks
Overcoming challenges: GPT-3.5's unpredictability in graph visualization
Challenges included the unpredictability of GPT-3.5's responses and the need for precise instructions. They emphasise the importance of finding the right balance between detailed instructions and simplicity.
Their ultimate aim of course is to combine graph visualization with natural language processing, envisioning enhanced data exploration and improved user interaction. The primary goal is to make the interaction between users and the many powerful capabilities of yFiles, more intuitive and creative.
AI-Generated code evolution -
yFiles' vision for graph layout algorithms
- Improving the AI-generated code execution
- Receiving optimal configurations automatically
- Addressing challenges related to input size

Graph creation mastery how yFiles stands out in dynamic interactive visualizations
So how does yFiles - ChatGPT integration differ from other AI-powered diagramming tools? Well, yFiles stands out in its facilitation of customization compared to many other visualization libraries due to its extensive feature set and highly flexible architecture.
One key aspect is the rich set of layout algorithms and styling options, allowing users to tailor the visual representation of graphs to their specific needs. yFiles provides a comprehensive set of APIs, enabling developers to fine-tune every aspect of the graph, from node and edge appearance to overall layout structures.
This flexibility allows developers to easily plug in ChatGPT in a programmatic way. With its comprehensive APIs, developers can fine-tune every detail of the graph, from node design to overall layout, enhancing data exploration and user interaction dynamically.

Refining the ChatGPT and yEd Live integration
While the concept of editing graphs, using natural language, is undeniably fascinating, it's important to note that it doesn't always yield the desired results. There may be situations where the LLM sometimes struggles to accurately interpret the user's query, which can occasionally lead to errors.
The good news is that, in many cases, simply resending the same input can fix the issue. Nevertheless, considering this was our first endeavour at integrating LLM’s with our yFiles SDK, we feel that we significantly streamlined the process of editing graphs.
And this is only just the beginning!
AI continuously keeps evolving! And we will continuously and relentlessly optimise this integration between yFiles and LLMs!

Concluding strides where LLM and yEd Live integration leads us next
We have successfully integrated OpenAI's LLM into yEd Live, allowing you to edit and arrange your graphs using natural language. You can now effortlessly request modifications to the styling and layout of your graphs. While the AI's results are generally satisfying, they may not always be perfectly precise. As we refine this integration, your feedback is crucial. Please share your yEd Live/ChatGPT experiences and insights with us!
Your insights matter! We would love for you to share your feedback and graph creations with us!
Unique Strengths of yEd Live + ChatGPT
Intuitive natural language interface: No need for complex coding or UI manipulation.
Focus on graph visualization: Tailored specifically for graph editing and creation.
Flexibility: Actively improving LLM integration and functionalities.
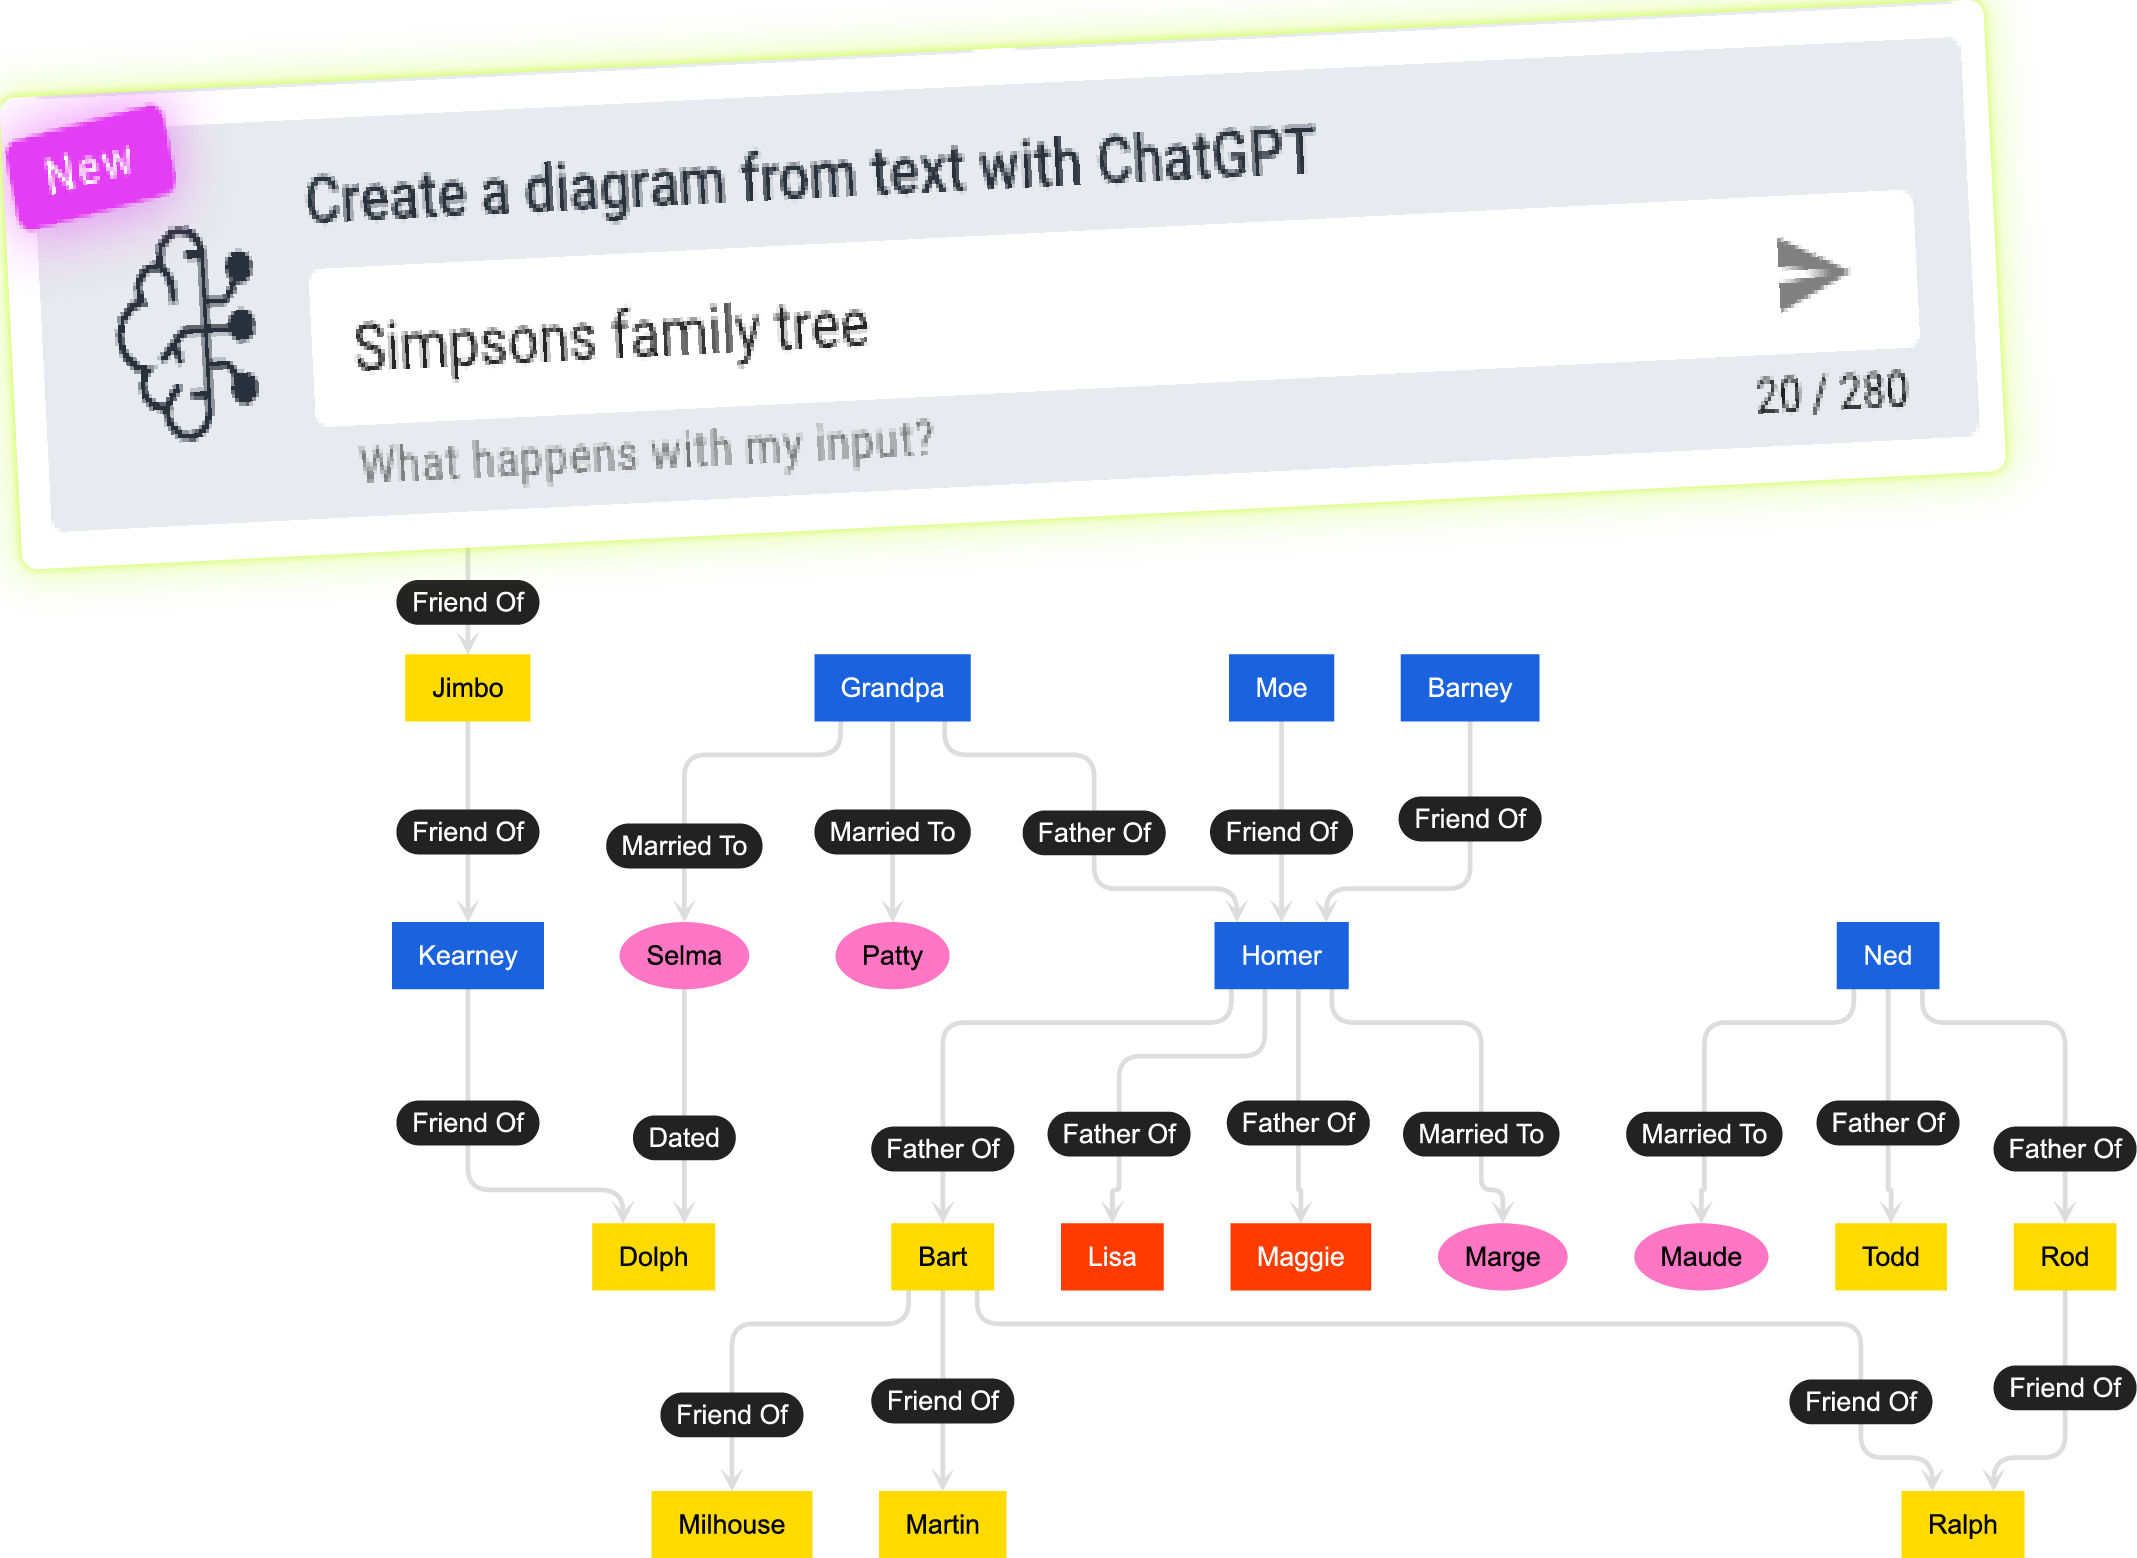
Upon accessing the welcome screen, you can utilize the new feature by typing in a description of the diagram you wish to create.
That's all it takes to explore a diagram on the desired topic.
What an efficient way to create visualizations! And absolutely no coding required!
Recap
In this groundbreaking integration, yEd Live now has an AI assistant powered by ChatGPT, enabling users to seamlessly edit and arrange graphs through natural language input. The integration represents a significant stride in simplifying complex graph modifications and interactions. While there may be occasional challenges in precise interpretation, the overall potential for streamlined graph editing is promising. Create stunning graphs effortlessly, no coding skills required.

Explore our FAQs for answers to common inquiries
Discover the power of yFiles
Transform complex data into beautiful, interactive graphs and visualize it like never before with yFiles, the diagramming SDK. Its comprehensive set of layouts and features provides endless possibilities for creating powerful graph drawings and interactive applications on any platform.


