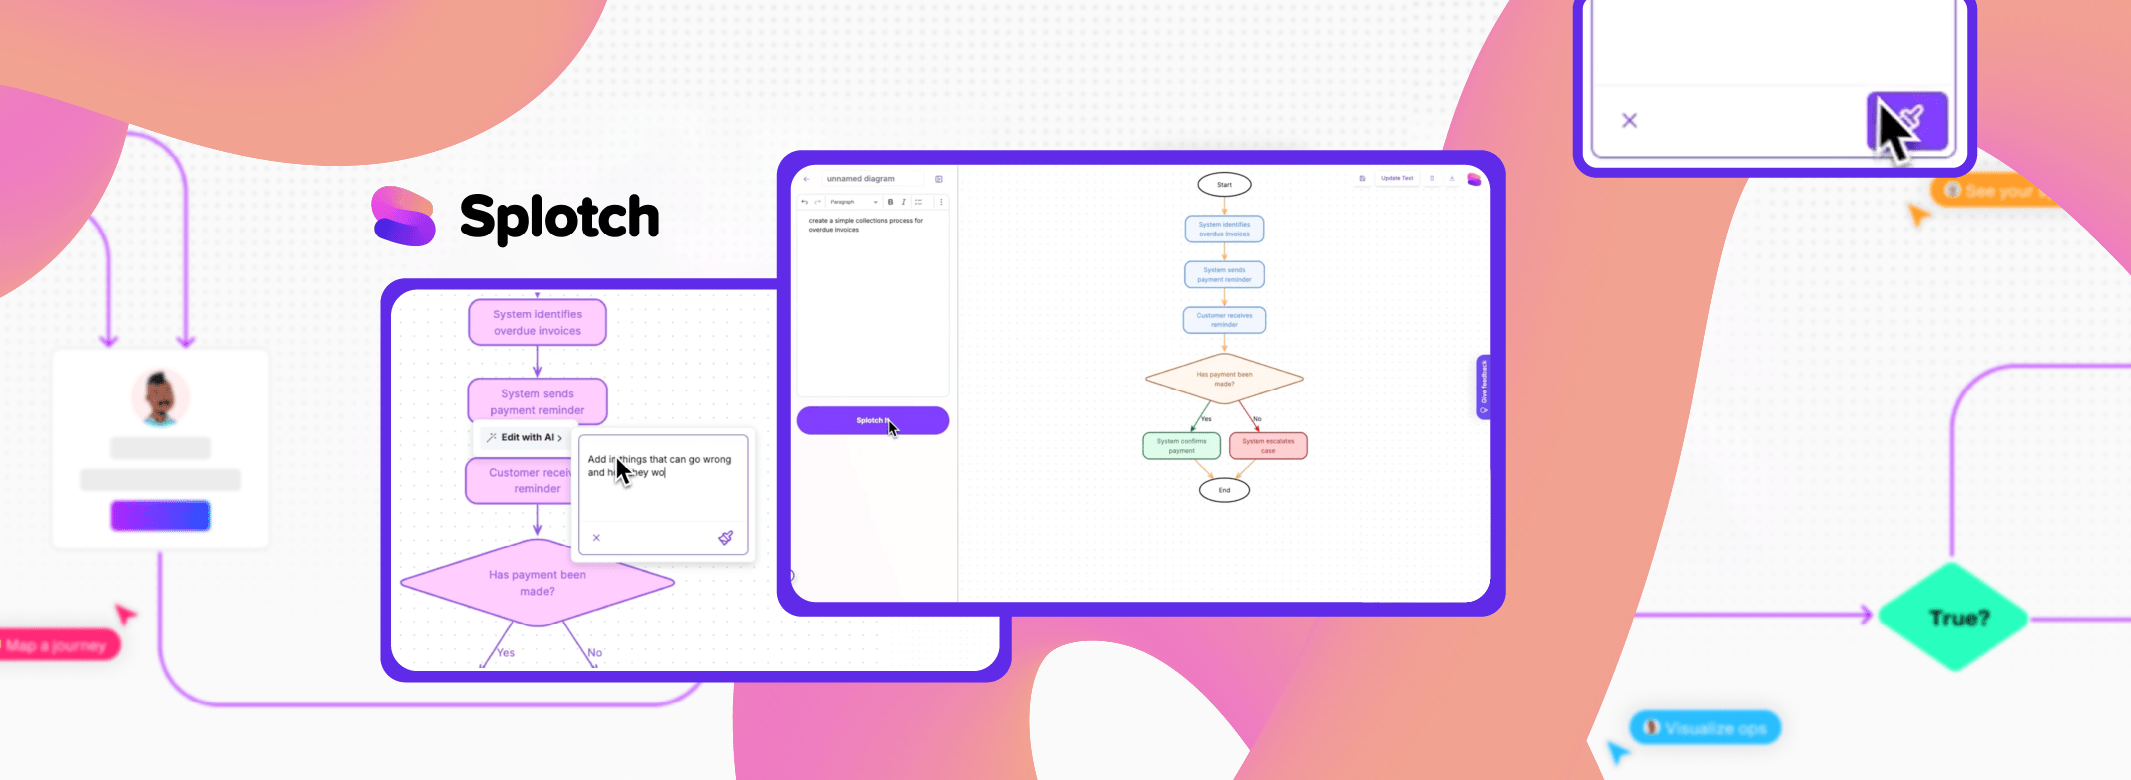
Splotch creates live diagrams from text

Splotch is a startup in the AI-diagramming space. The founders observed that too often - despite their obvious value in creating shared understanding - diagrams are not used to summarize complex content, because it requires a lot of work to create them and they end up getting obsolete. With Splotch any process or system description is turned into a live diagram synced to its text description. If a user edits the diagram, they can then push the changes to the text – or vice versa. That way, the user and their collaborators can edit at a granular text level or at the high level view of the diagram and everything still stays in sync using the power of AI.
 We knew we had to make AI generated diagrams editable and meaningful. yFiles gave us the tools to bring these diagrams to life, keeping them flexible and visually appealing.
Our users are thrilled with how interactive their diagrams can now be.Kevin Lorenz, CPO and Co-Founder, Splotch
We knew we had to make AI generated diagrams editable and meaningful. yFiles gave us the tools to bring these diagrams to life, keeping them flexible and visually appealing.
Our users are thrilled with how interactive their diagrams can now be.Kevin Lorenz, CPO and Co-Founder, Splotch
How will AI change diagrams?
Let’s consider a thought experiment: How many diagrams are created every day? One million? Ten million? While we don’t know the exact number, it’s clear that this is only a fraction compared to the number of text documents produced.
For most people, navigating complex processes still feels like the way our great-grandparents did: “Go twenty paces past the big oak tree, then turn right.” We write this down because diagrams—much like maps—take time to create, update, and explain. Before AI, only the most important processes were diagrammed, as creating them was labor-intensive. However, yFiles has consistently lowered the barrier to creating various types of diagrams, yet only a small fraction of processes that could be diagrammed ever were.
AI will drastically expand the number and types of graphs in use. Imagine if every user journey, system architecture, integration and operational process that exists as a text description had an accompanying diagram–how much better would decision-making get?
Just like AI needs context windows to function, humans need context maps: diagrams. Human memory and sense-making is visual and sequential. Stories and maps are sticky because they put information in context. Diagrams are the maps of the business world. AI is removing the lock on this treasure chest by generating diagrams from text.

Needs & objectives
Needs analysis
- Layout AI-generated diagrams in a logical, visually appealing way
- Combine manual and AI edits over many iterations while keeping the layout consistent
- Automatically change layout to fit a destination format (slides, docs, wiki, etc.)
- Allow users to customize and style nodes with icons, colors and groups
Objectives
- Give users a well-formatted “zero shot” (first attempt) diagram from text description
- Keep the layout consistent and elegant over many iterations
- Show the user how the diagram is changing by animating how the graph is changing with each edit
- Link every node to its corresponding source text and keep them in sync
Challenge: How to achieve elegant layouts over many AI and manual edits?
Can AI editing and manual editing coexist?
When Splotch started building an AI diagram generator in late 2023, LLMs could already output decent diagrams out of the box-but they were static. No edits were possible without rebuilding the entire diagram. Almost all users needed to make some changes to the AI-generated diagrams, so manual editing was a must.
At first, manual editing was easy to implement. But after manual edits were added (i.e., adding and reorganizing a few nodes), they faced a major challenge: each subsequent AI edit changed the entire structure of the diagram, making it unrecognizable. The manual changes were effectively lost.
Was it possible to give users both AI editing and fine-grained manual control? After months of experimentation, the Splotch team developed a protocol for translating text from the LLM into a data model that could be displayed in text or visual formats, and an index that kept the two views linked through iteration cycles. But one big challenge remained: how to handle the difficult math of reworking the layout with each iteration.
Is there a layout engine that can handle AI-generated diagrams?
Now that Splotch had a structured way to read the LLM output, they began looking for a graphing algorithm that could map that structure to nodes, determine distances, and draw connections in a human-readable way. LLMs are not equipped to deal with this kind of problem for visual output-especially when the output changes over time. Their first attempts piled nodes on top of each other:
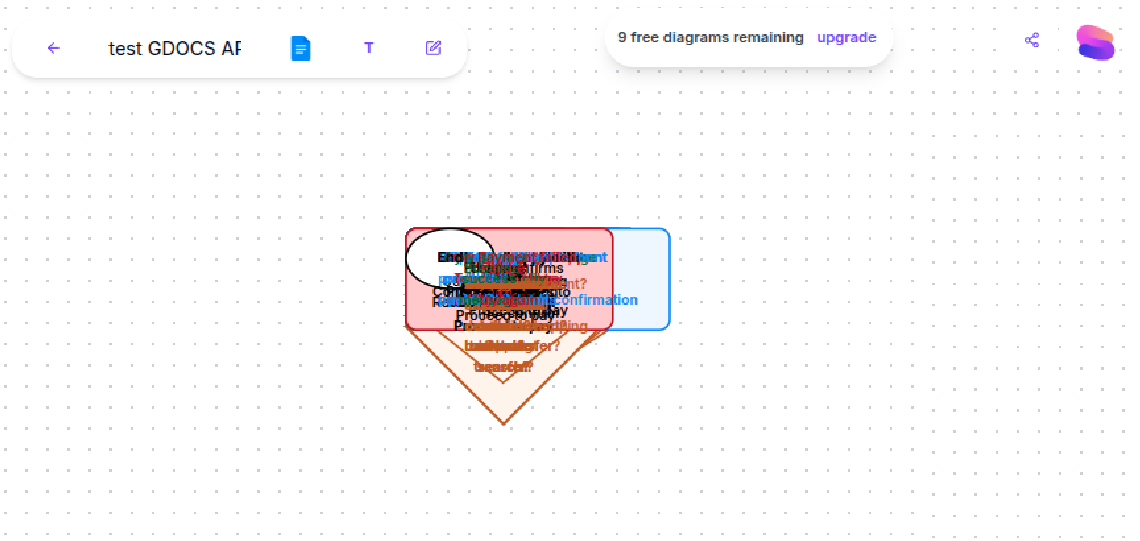
Splotch experimented with a number of graphing tools.
Why AI alone couldn't solve the problem
They experimented with various diagramming tools to address this, such as:
- Graphviz: Which arranged nodes in a way that was hard to read.
- ReactFlow: ReactFLow had good manual controls, but it didn’t offer a layout engine that could digest the LLM output.
- D3 & Mermaid: These tools were good for static visualizations but couldn’t handle AI-driven changes dynamically.
What Splotch needed was a robust graph visualization solution capable of adapting to AI-generated structures while allowing fine-tuned manual control.
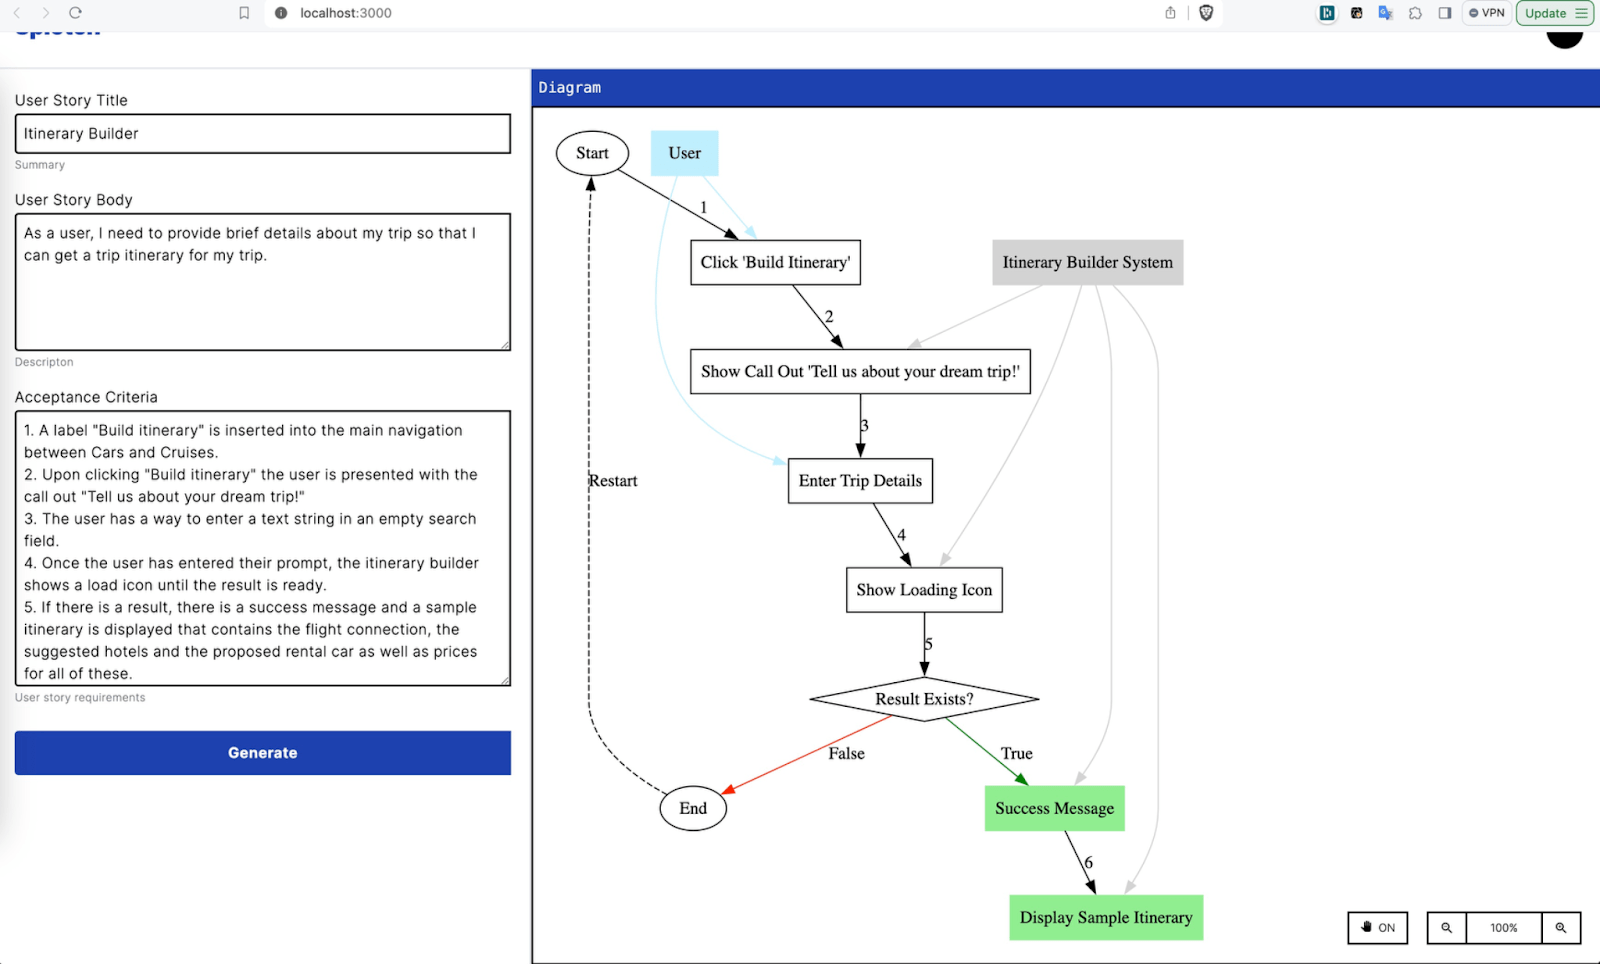
Solution: yFiles offers a powerful, flexible layout engine
Splotch spent most of the summer of 2024 sifting through graphing engines - until they found yFiles. The hard graphing problems were elegantly organized into libraries that made it easy to add features. Because yFiles serves sophisticated enterprise customers, it has developed tools to handle many edge cases that the open source graphing tools have not covered. It was the perfect tool to turn unpredictable LLM output into useful diagrams. With yFiles, the last piece fell into place.
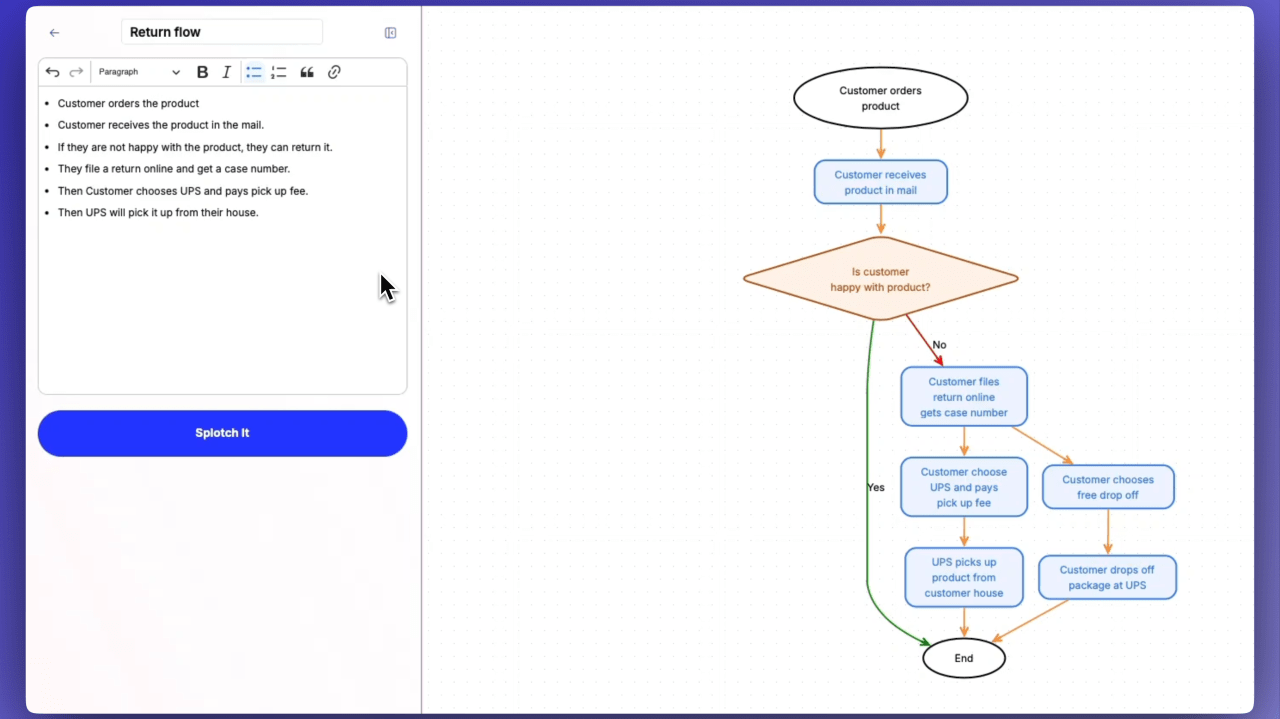
By integrating yFiles into their system, Splotch was able to:
- Generate dynamic layouts that adapt to LLM-generated structures while preserving readability.
- Maintain bidirectional links between text descriptions and their corresponding diagram components.
- Enable iterative editing where both AI-suggested updates and manual modifications coexist seamlessly.
- Improve usability by offering an intuitive interface where users can refine AI-generated diagrams without technical expertise.
Result: Unlocking new use cases for live AI diagrams
With yFiles, Splotch successfully launched its AI-powered diagramming tool, leading to rapid adoption across multiple industries. Early users found innovative applications, including:
- CRM & Automation Integrations: Visualizing data flows between HubSpot, Salesforce, Segment, Zapier, and PostHog.
- Enterprise Onboarding: Account managers creating onboarding plans for new customers.
- Technical sales: Convert AI call notes and transcripts into diagrams that show prospects how the vendor will address their pain points.
In the CRM space, marketing teams use Splotch to visualize data flows across various systems, ensuring clarity and accuracy in how leads and customer interactions move through their platforms.
HR and operations teams leverage Splotch to create interactive process maps for new employees, ensuring a easy and well - structured onboarding experience across departments.
Financial analysts and legal teams use Splotch to visualize compliance processes and document flows, providing a clear and accurate view of how critical financial and legal data moves across systems.
Looking ahead: The future of AI-driven diagramming
In response to user feedback, Splotch has introduced a free web-based version, allowing anyone to generate live AI-powered diagrams without signing up. The company continues to refine its AI and graphing capabilities, aiming to make diagrams the primary language for understanding company processes—just like GitHub revolutionized code collaboration.
About Splotch
Splotch simplifies complex workflows by leveraging AI to generate flowcharts from written processes. This enables users to convert text-based workflows into visual diagrams,improving clarity and communication. The AI-powered tool helps streamline the creation and editing of flowcharts, making it easier for businesses to manage and understand their processes.