In this blog post, we go into detail on how we used the yFiles GraphWidget in Jupyter Notebooks to showcase the Little Alchemy 2 underlying graph structure. In addition we give possible routes to further explore with the GraphWidget.
We explain our approach, illustrating how we harnessed the power of Python within Jupyter Notebooks to utilize the yFiles Graphs for Jupyter. Through our exploration, we showcase the versatility of the yFiles GraphWidget in Python, seamlessly integrating it into our workflow for data visualization.
What is Little Alchemy 2
Little Alchemy 2 is a puzzle game that involves combining different elements to create new items. By mixing two elements, new combinations are created, resulting in over 600 different elements.
All of this can be represented by a graph, where each element is represented as a node and the combinations between elements are represented as edges connecting these nodes.
Crafting intricate graphs in Jupyter Notebooks using the yFiles GraphWidget
yFiles Graphs for Jupyter is a free diagram visualization extension for JupyterLab and Jupyter Notebook. It can import structured data from popular Python graph packages like NetworkX, igraph, PyGraphviz, Neo4j, or any structured list of nodes and edges.
The yFiles Graphs for Jupyter plugin is based on our well-known graph library yFiles. You can apply the full range of automatic layout algorithms - organic, hierarchical, tree-like, orthogonal, circular, radial, and more - to your graph structure. A suitable clear visualization helps you to gain a better understanding of your data.
The embedded extension provided interactive features like automatic layouts. item neighborhood and data views, and search capabilities, as well as an API to integrate the high-performance algorithms and specify data-driven mappings for item color or geometry. As an illustration of the capabilities of this robust widget, we used the Little Alchemy 2 data in Python to demonstrate how easy and smooth it is to go from datasets to mesmerizing graphs, using Python in a Jupyter Notebook with our GraphWidget.
How we proceeded
We found the Little Alchemy 2 graph problem on Hacker News and decided to use the Jupyter GraphWidget for the visualization. We used Google Colab, but any of the following environments will work for this, in combination with the yFiles Jupyter graphs widget to create and display complex and stunning graphs.
The visualization of the graph structure underlying Little Alchemy 2 was created by transforming the game data into nodes and edges. Also, we customized the graph properties to create a Bill of materials (BOM) graph, showcasing the hierarchic logic.
How we created the diagram
- We analyzed the original data set from little-alchemy-2 on NPM. It has the following structure:
- Each entry consists of a name ('n'), pairs of elements that create this entry ('p'), and a list of elements that can result from this entry ('c'). Additionally, the items may contain conditions or the 'prime' attribute marking important elements

- By retrieving this dataset in JSON format from UNPKG, we got the data into Jupyter
- Then we parsed the dataset through each element while using its properties:
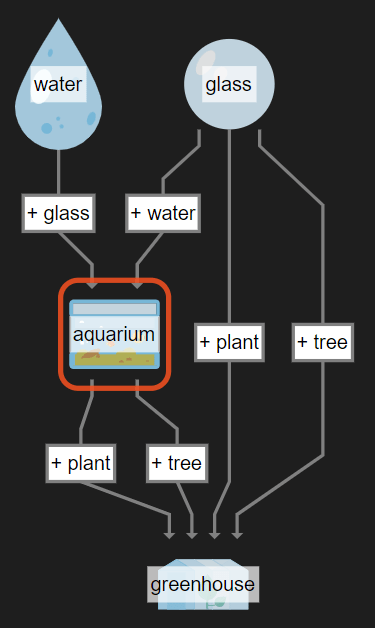
This is the resulting graph without any graph customization:
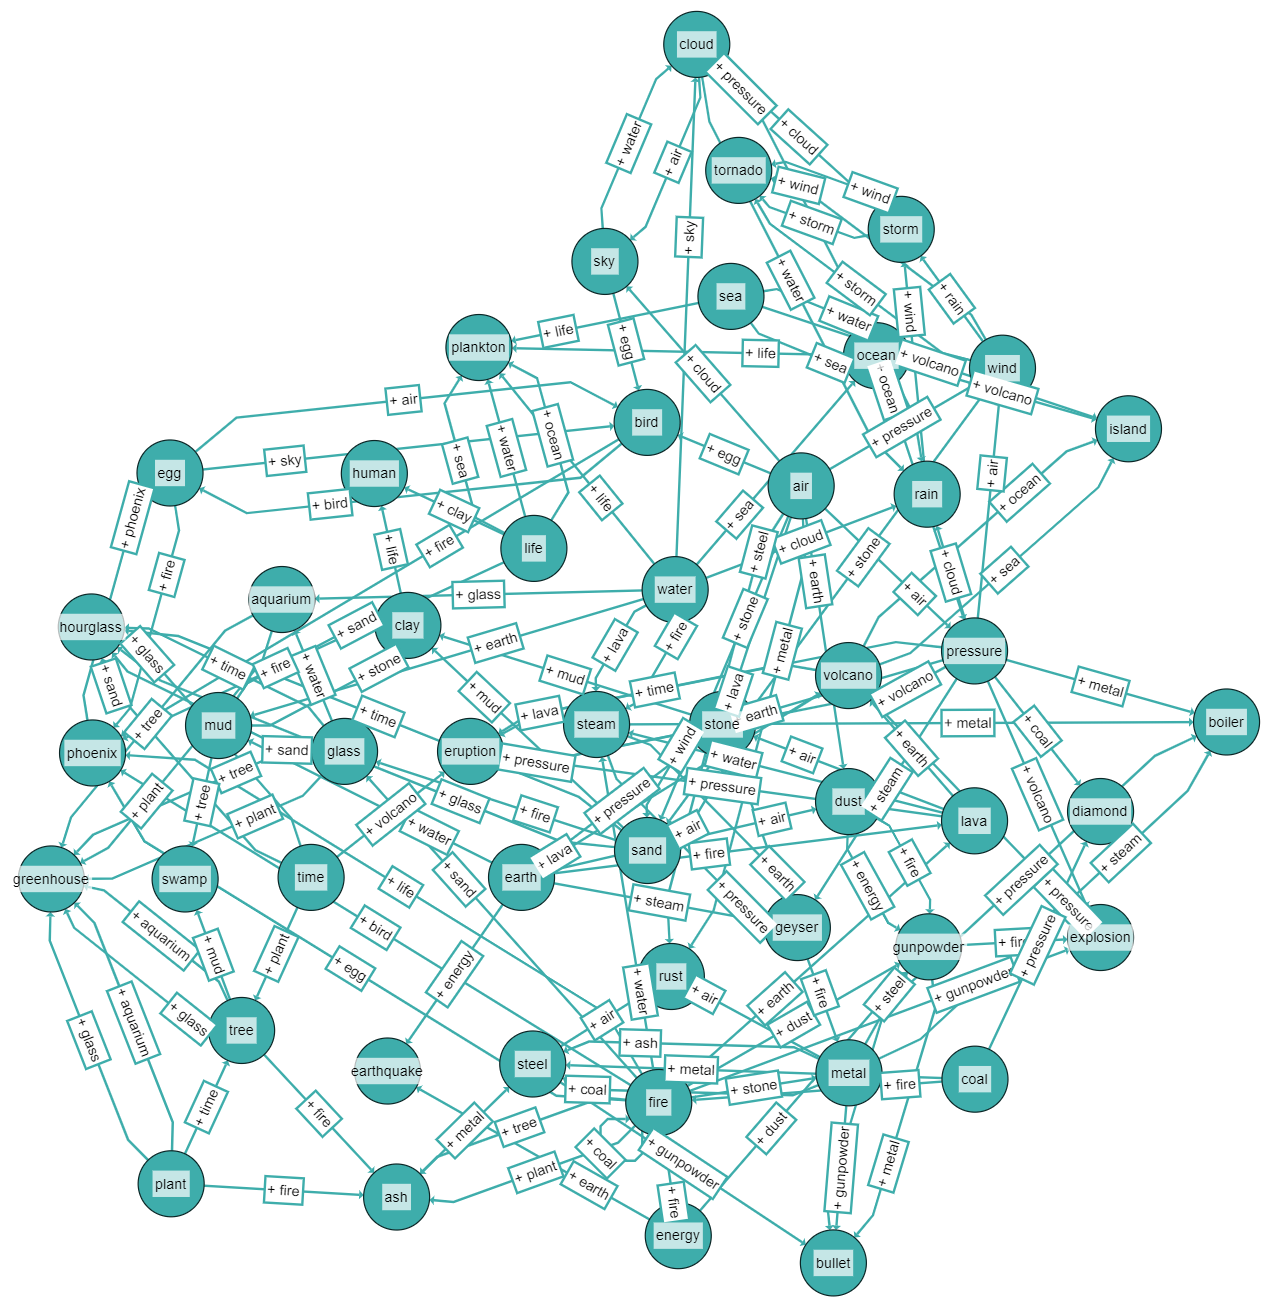
The result is pretty obscure, but with only a few adjustments we can create a refined graphic representation.
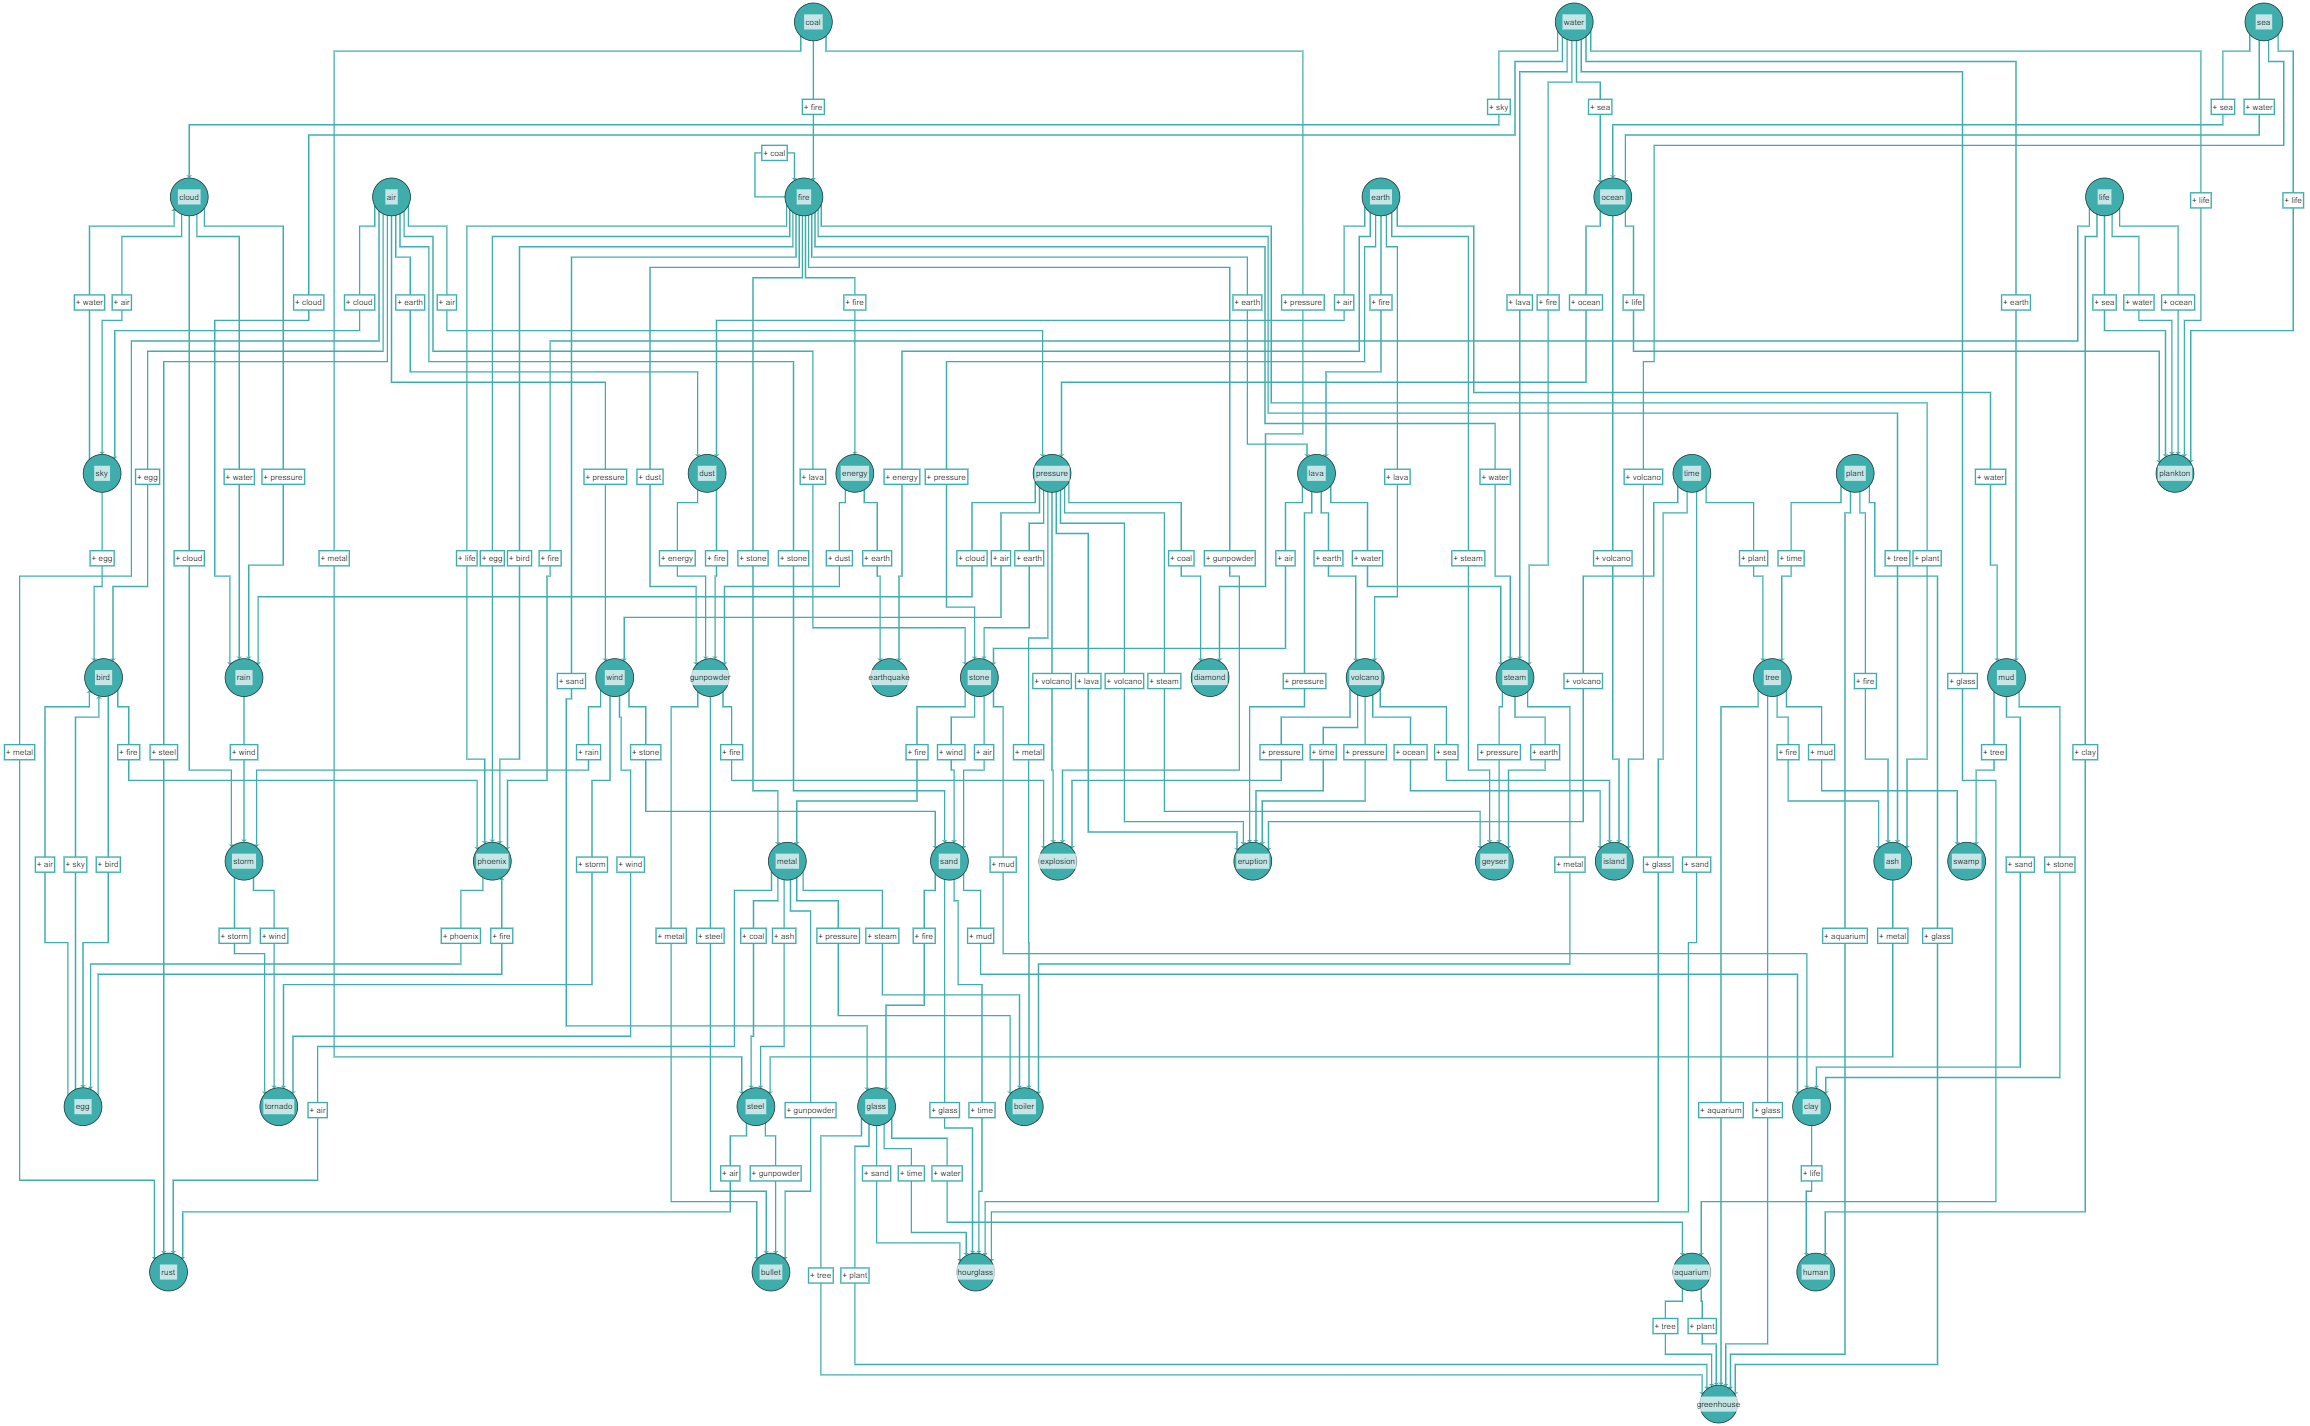
Since the graph has an underlying hierarchic logic, we use the hierarchic layout.
From here, we incorporated images from the game to enhance the visual appearance of the graph, merely by changing the widgets node styles mapping. These images are fetched directly from littlealchemy2.com through the id of the element.

This is what our initial graph looks like after some easy modifications:
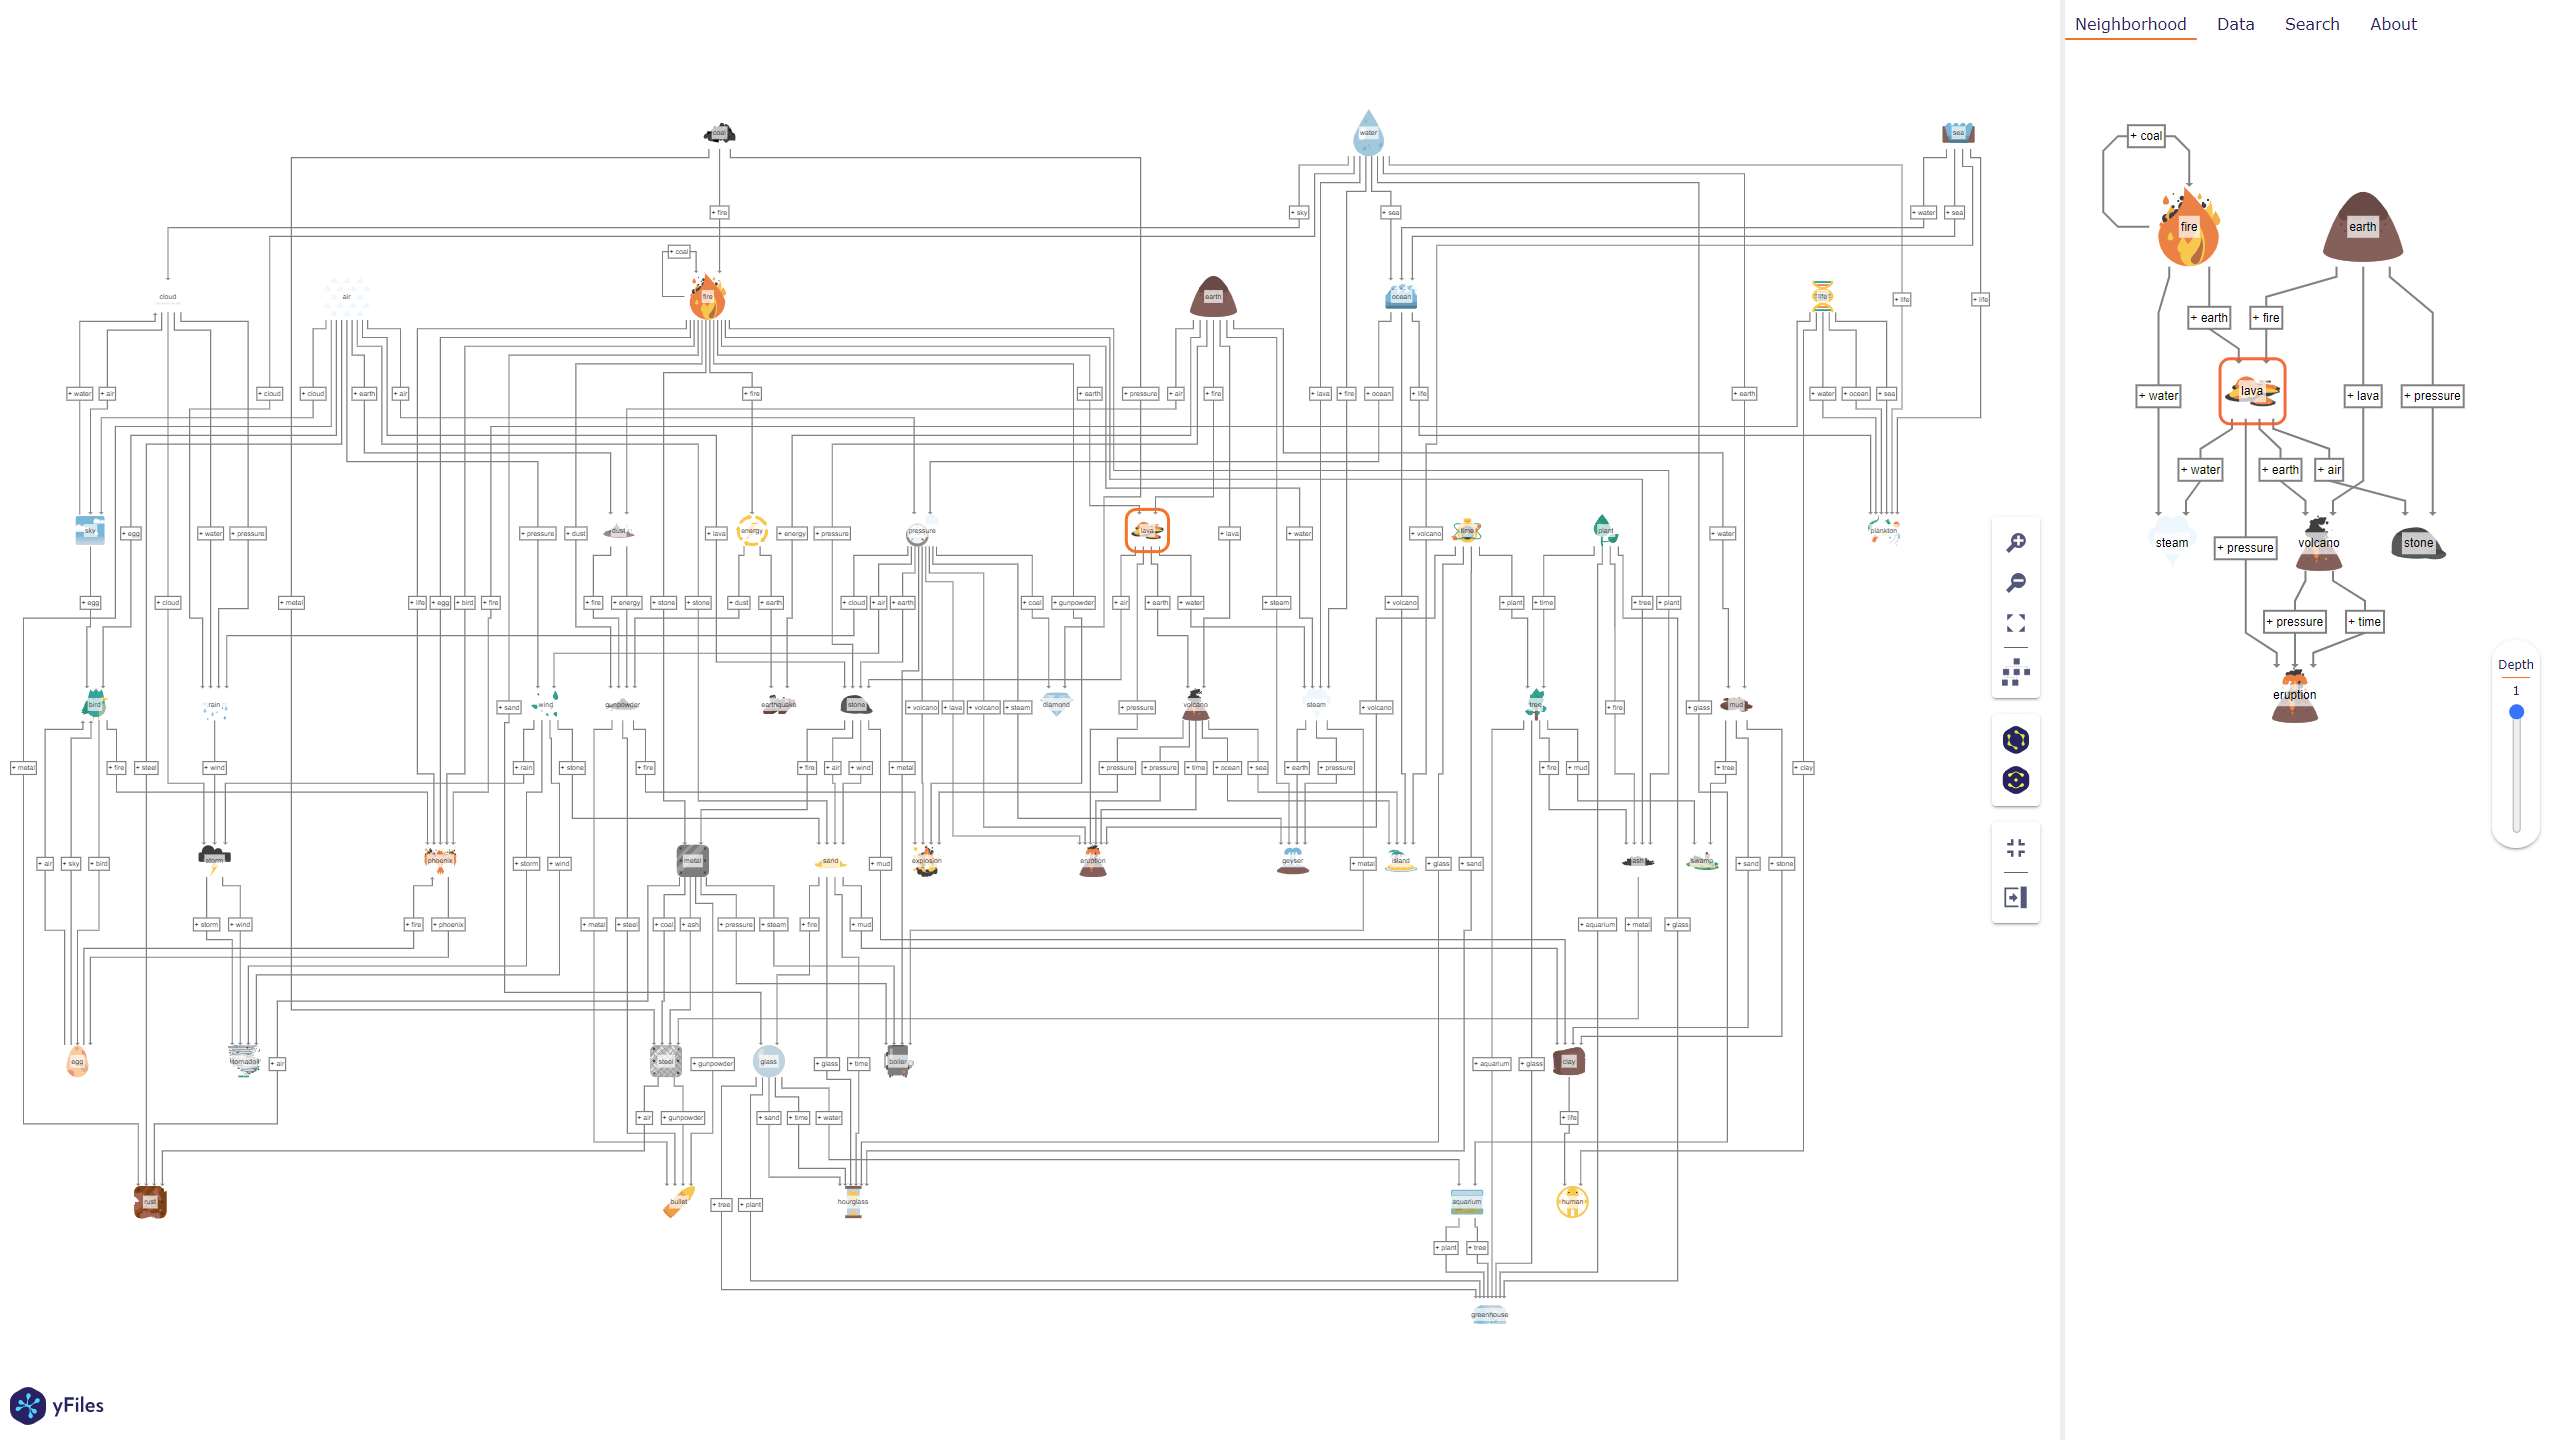
If you want to display a bigger dataset with more elements (or less), you can easily change the num_elements constant, the default currently is at 50.
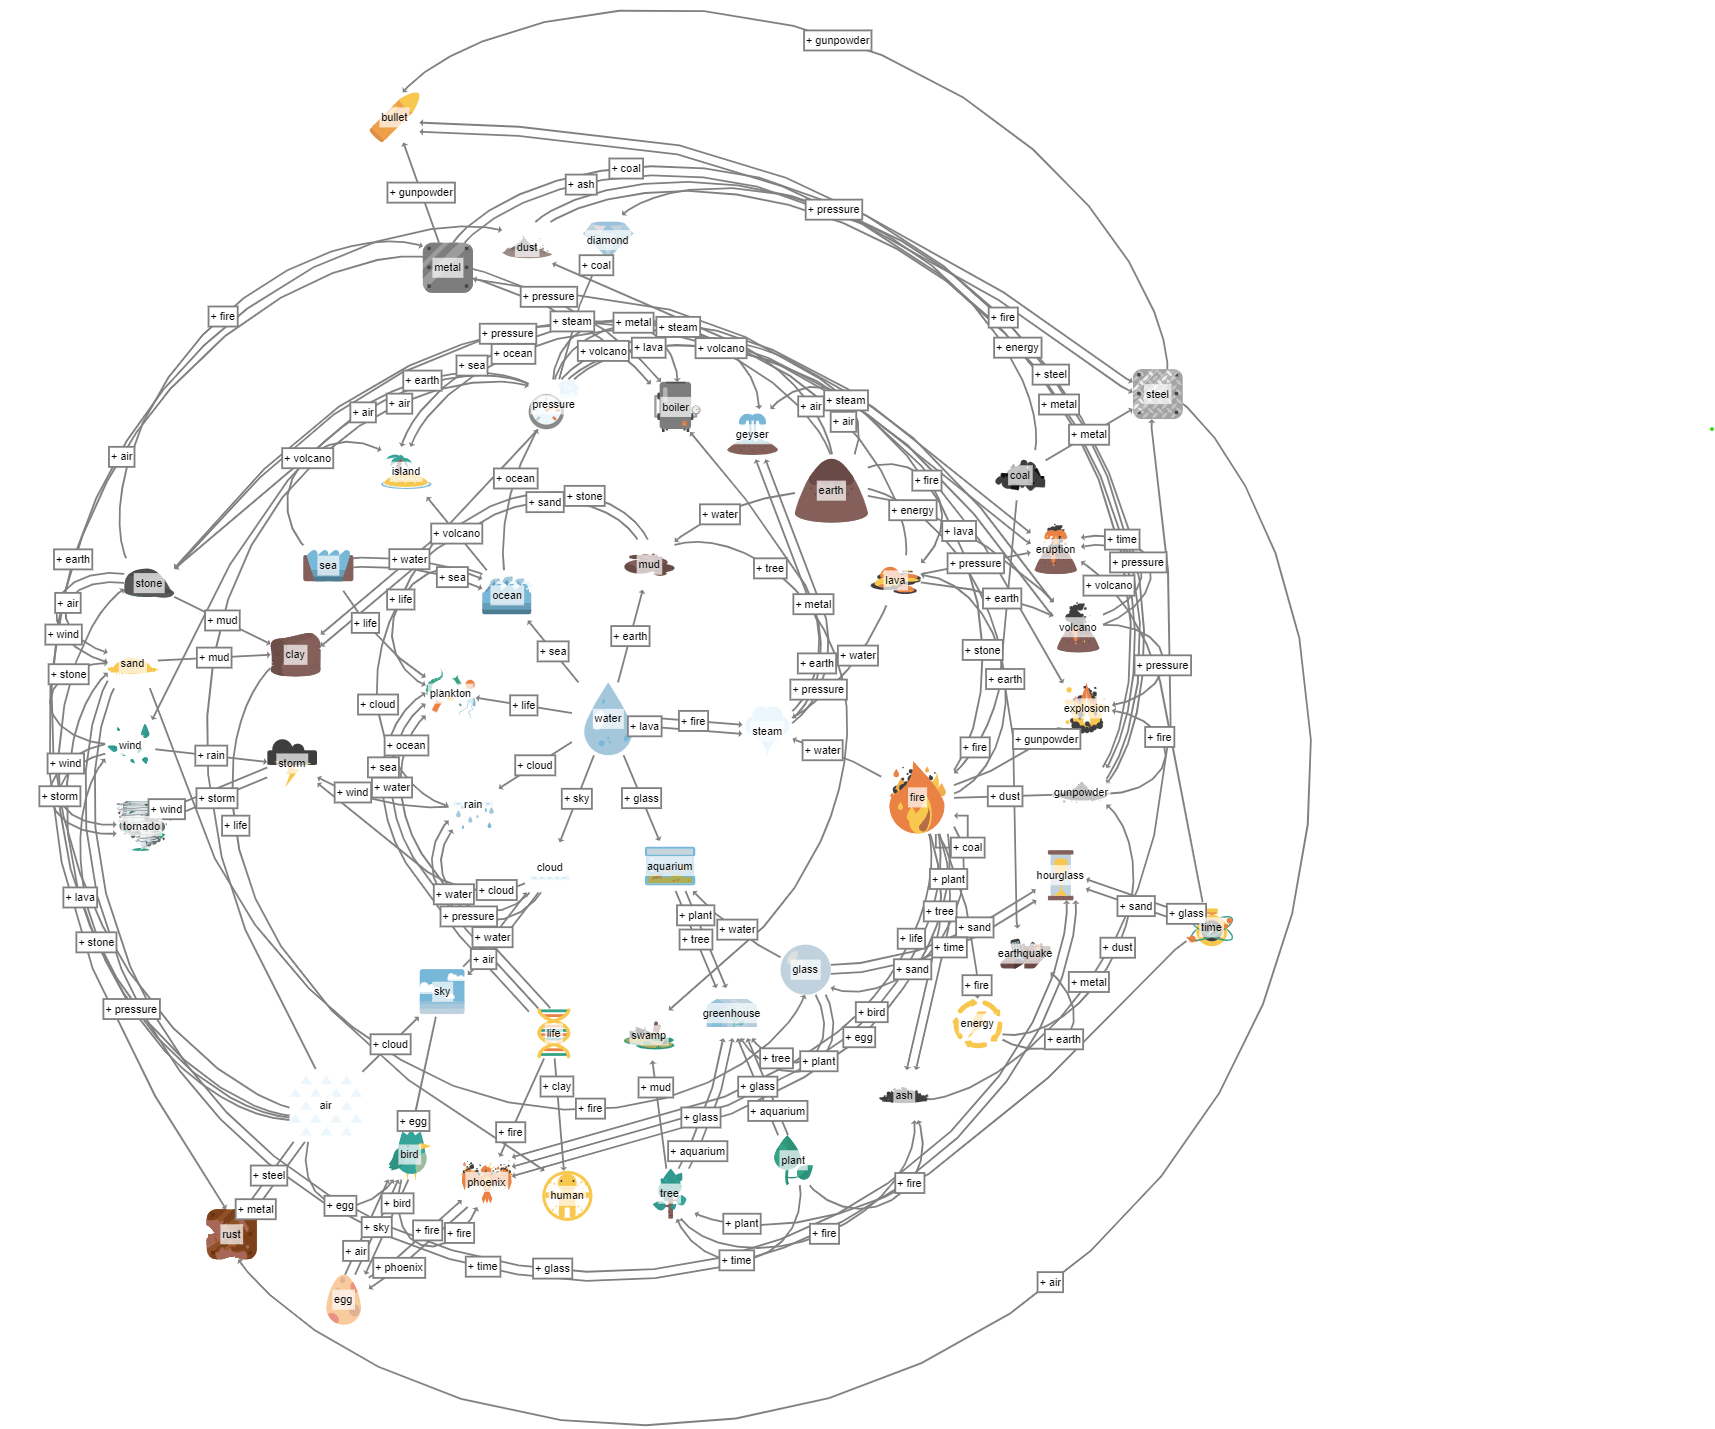
Of course adding new elements will make the graph increase in complexity. Given that 700 elements and almost five times as many combinations would make the graph too dense for a Jupyter cell, we only used a subset of the whole game graph. However, it is still interesting to see parts of the graph and how the different elements are connected.
If you want to explore only single items
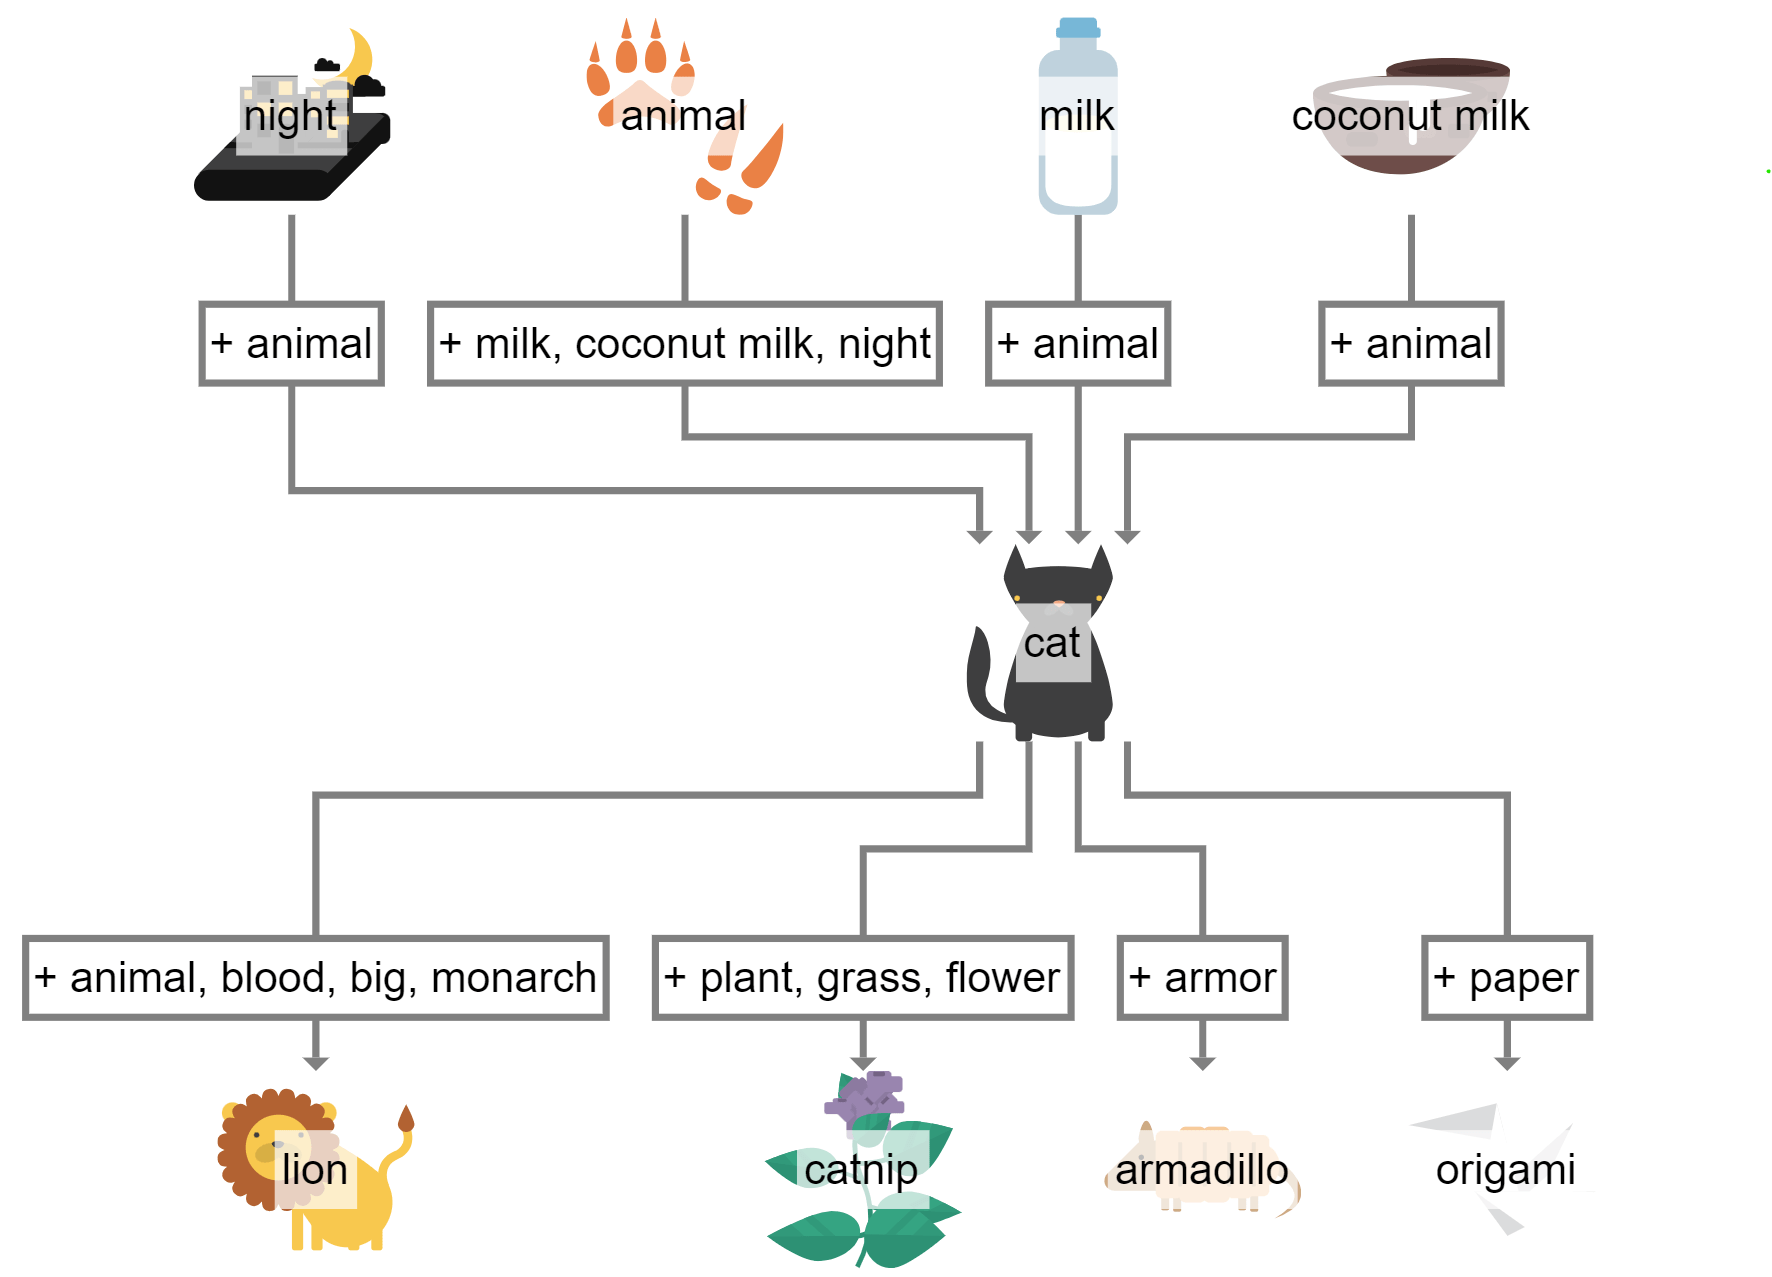
You can use the Neighborhood Tab in the sidebar to explore single elements. However, to focus on just one element you're interested in, you can change the constant element_name to only see the defined element with its children and parent nodes.

- Focus on a single element, where only the direct children and parents are displayed
- The smaller graph is more readable
Other ways to go with this widget
- You can try out the Neighborhood-View directly showing you the parents and children of each element. So it's easy to see how to create a specific element. The Neighborhood-View also allows you to interactively navigate through the items. For example, by clicking on one of the parents, it becomes apparent how that parent is created, and so on.
- Different layouts can help highlight different aspects. For example, the radial layout reveals important items in the center of the graph.
- The Search features allows you to easily find and select certain elements which may be examined closer with the neighborhood view.
Export to yEdLive
If you want to further change the resulting graph, the Jupyter widget supports an export to the free online diagram editor yEdLive. yEdLive lets you edit and explore the graph in more detail and provides many different ways to export beautiful images from the diagram.
Conclusion
Experience effortless creation of mesmerizing graphs without the need for a lot of coding. With the yFiles GraphWidget for Jupyter Notebooks in Python, you can seamlessly create, edit and utilize intricately complex and beautiful graphs.
With the powerful layout algorithms from the yFiles SDK that the GraphWidget for Jupyter Notebooks offers. You can effortlessly apply a comprehensive range of layout options to your graph structure. This diverse selection ensures that your data is presented in a clear and suitable visualization, aiding in a deeper understanding of your dataset.
Moreover, seamlessly export your graphs from Jupyter Notebooks into the yEd live editor, where you can further refine them and easily export them in SVG format or other desired formats for your specific use case.
Revolutionize your approach to graph creation by leveraging the user-friendly and powerful yFiles GraphWidget for Jupyter Notebooks. Whether you're a data scientist, researcher, or developer, yFiles empowers you to create compelling visuals for your projects, presentations or publications.


