Data Explorer for Neo4jVisualize and explore your graph database

The graphing extension that makes your data more usable
The Data Explorer for Neo4j is a free-of charge browser tool that provides easy access and interactive exploration of your Neo4j database. Based on the yFiles SDK, it provides automatic layouts and graph analysis algorithms to gain more insights into the data. Automatic coloring and sizing of the nodes can highlight different properties over the entire visible graph.
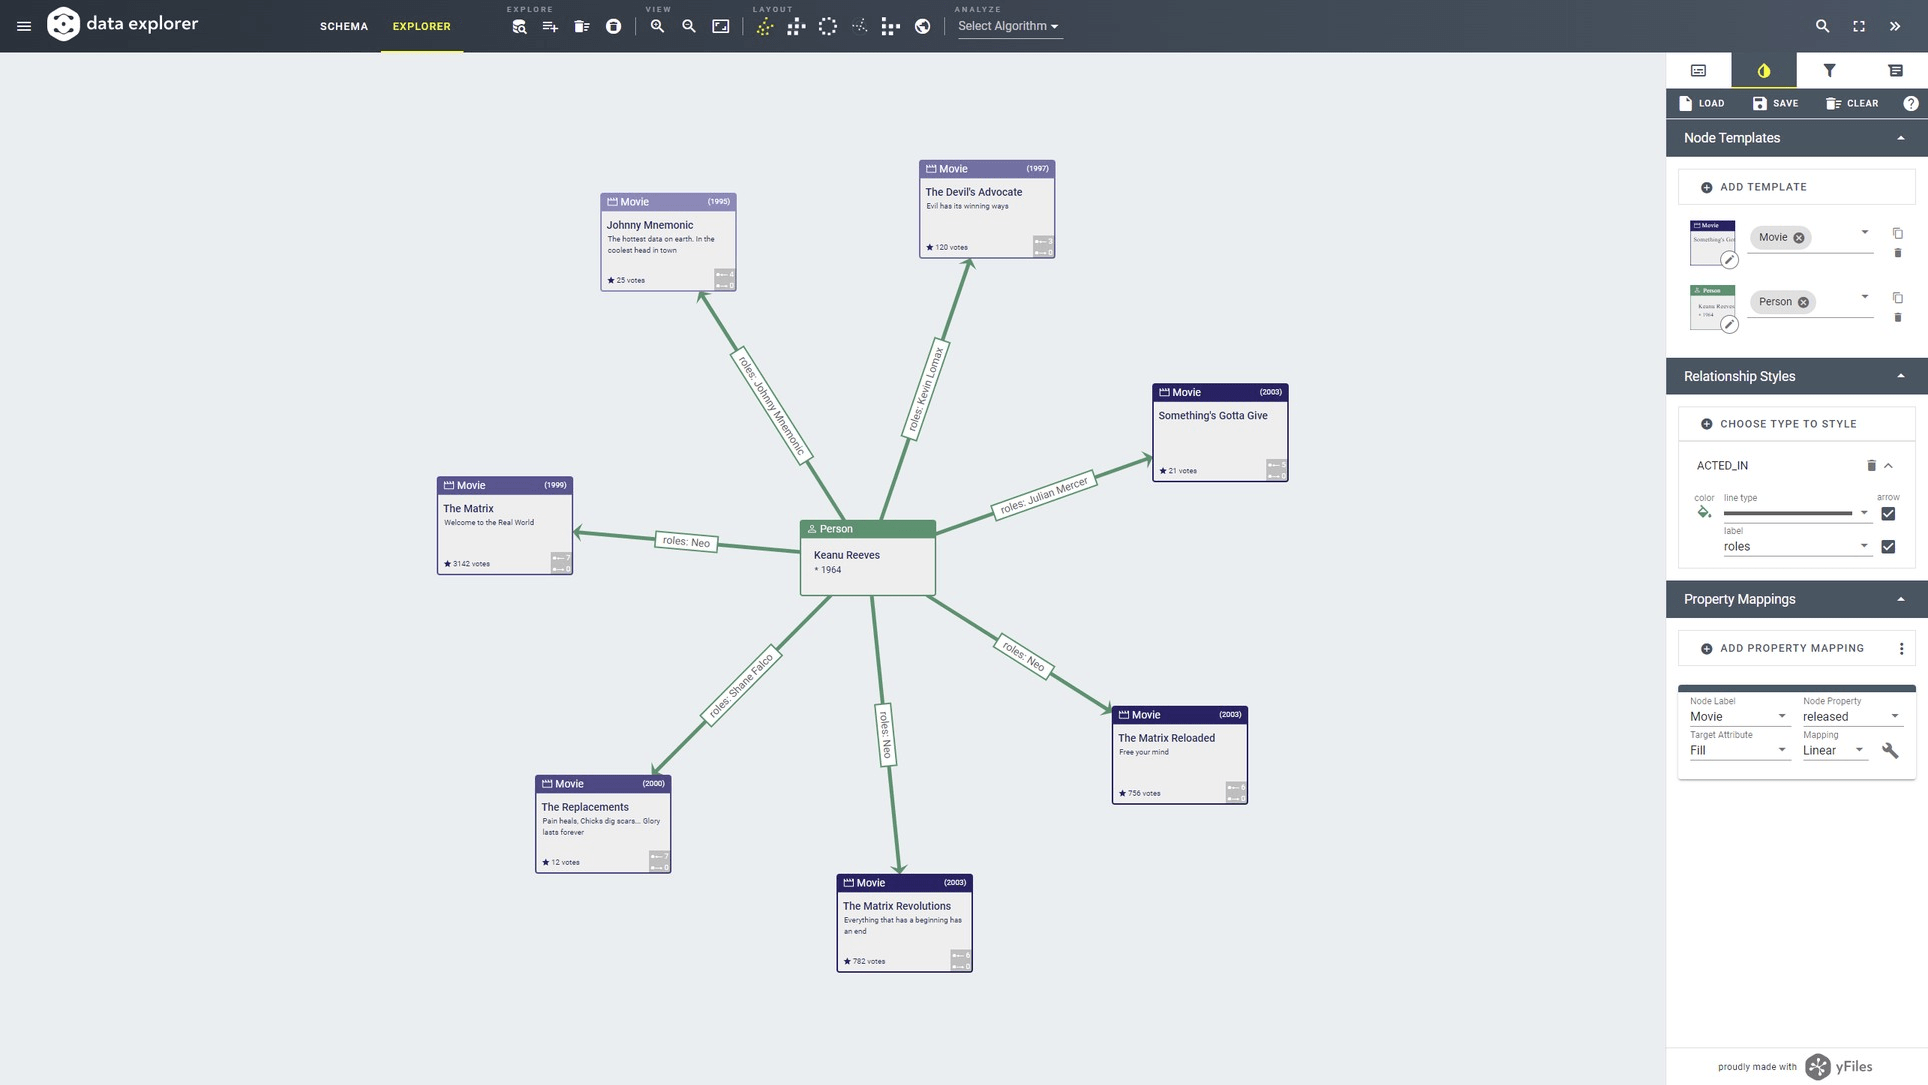
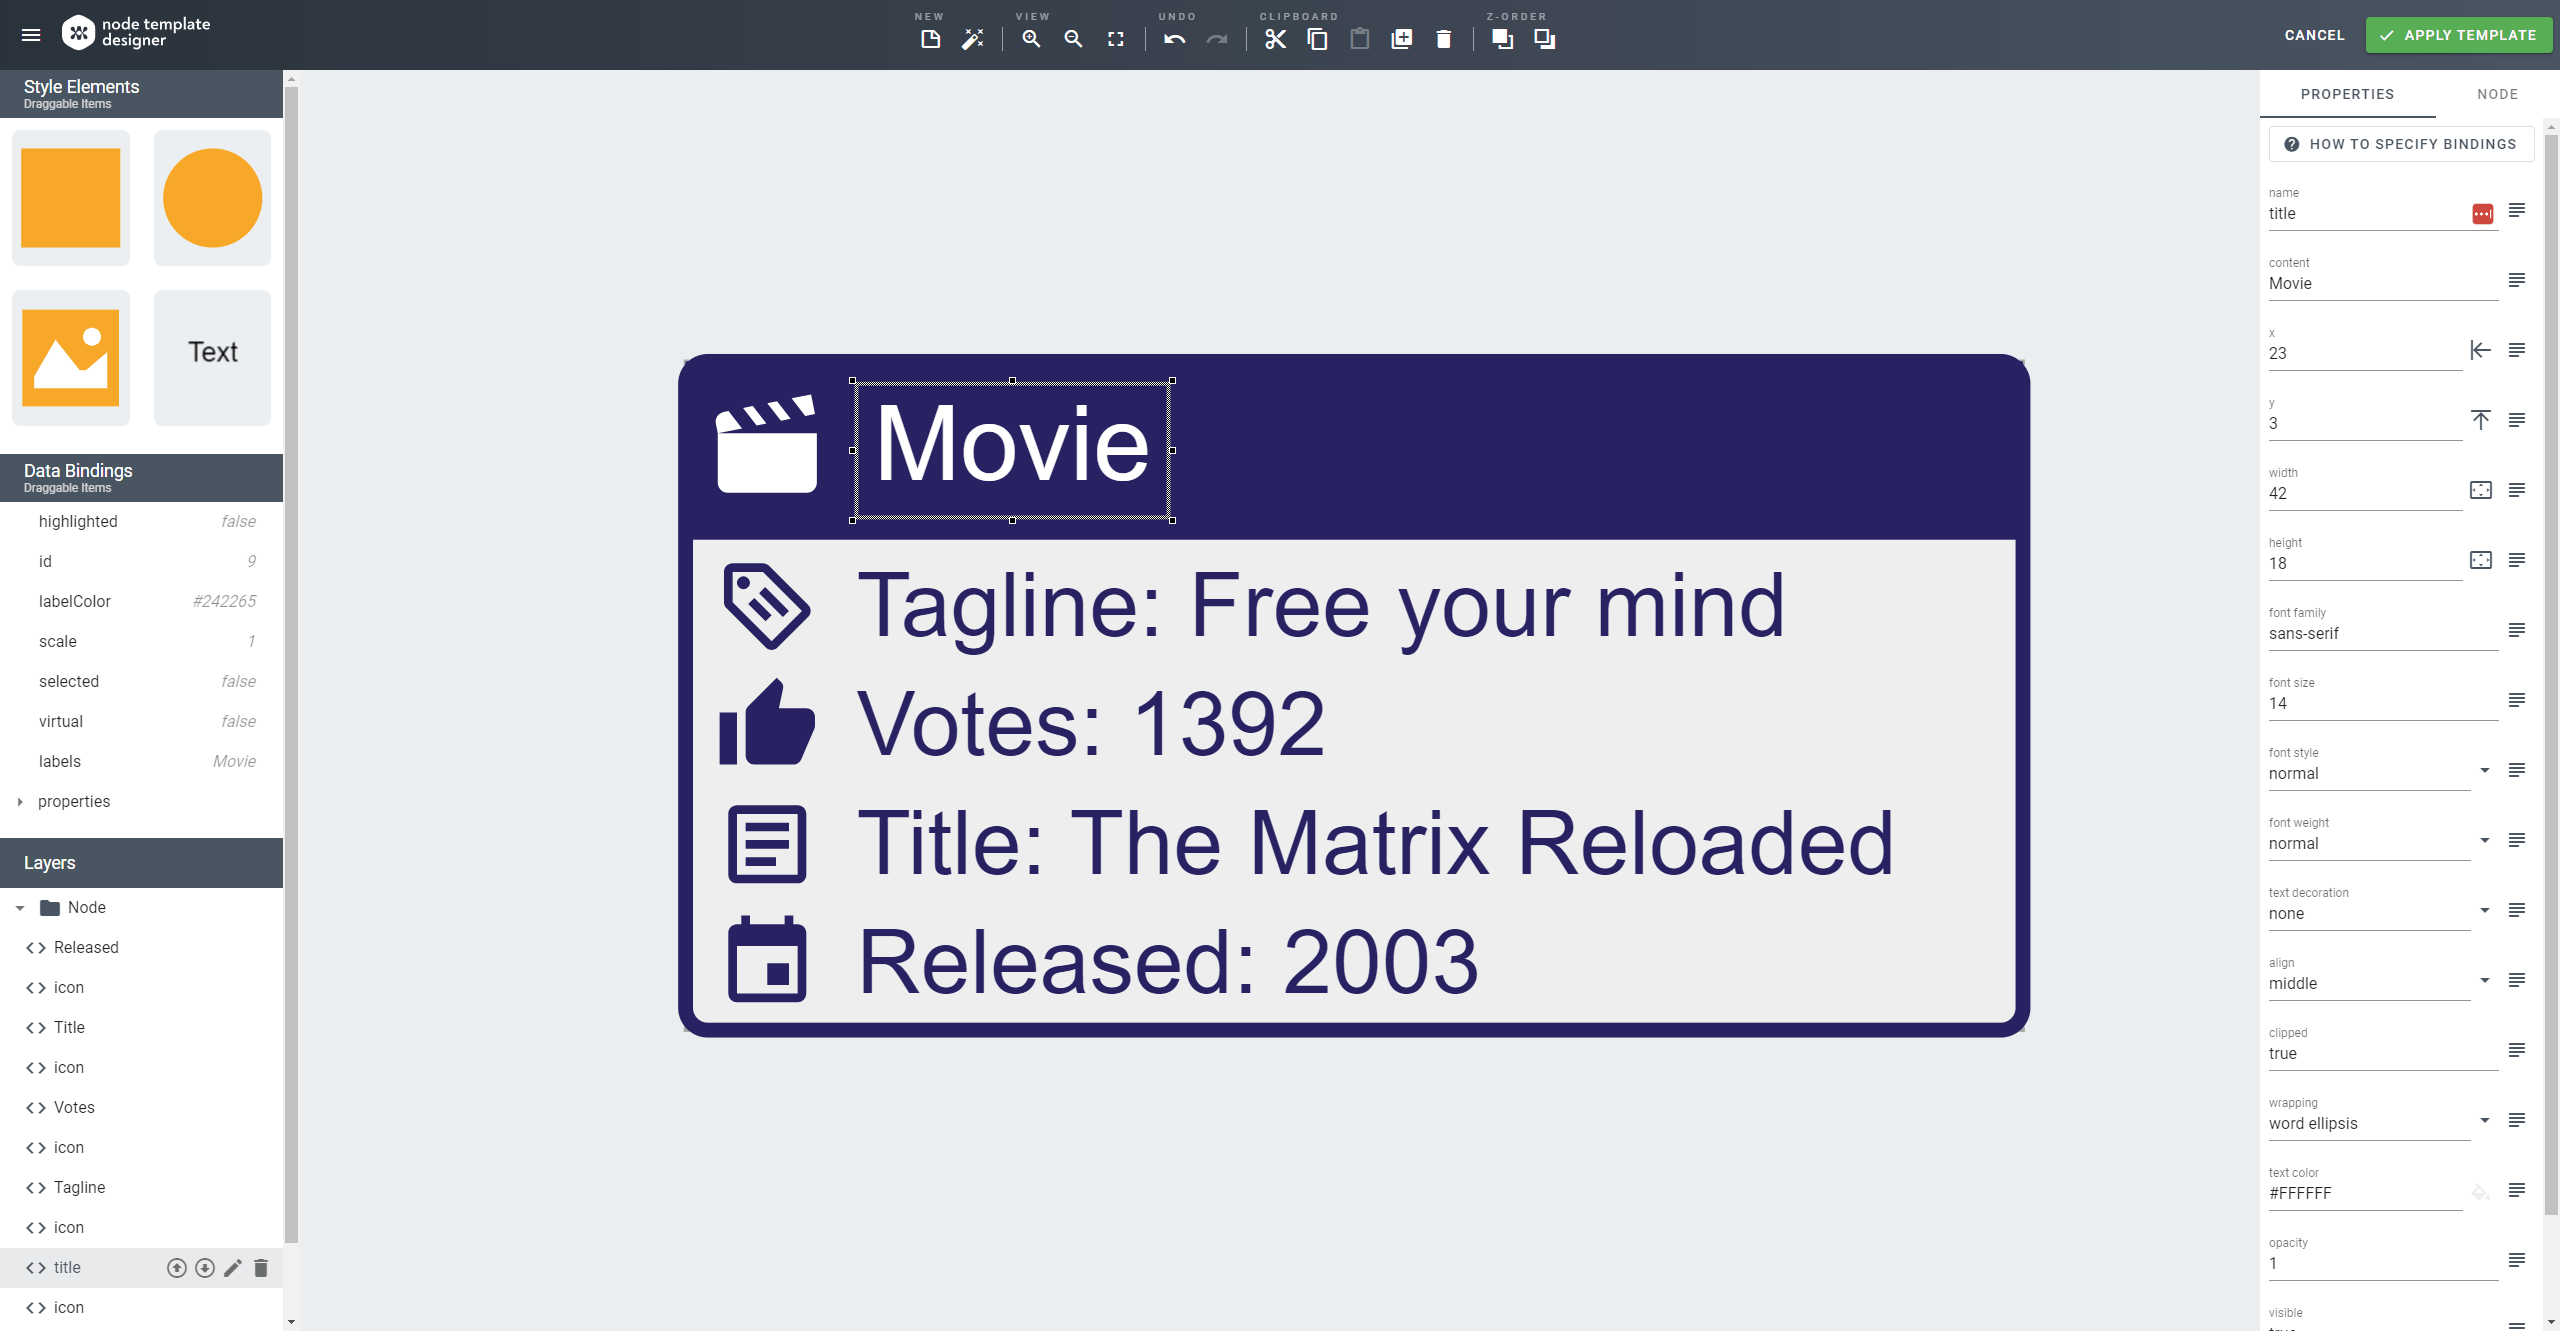
The built-in template designer lets you design specific visualizations for nodes with different labels.
Utilize AI support to automatically generate appealing visualizations or effortlessly explore the database by entering free text queries.
Looking for an visualization with Python in Jupyter Notebooks? Our thin, open-source wrapper Python widget yFiles Jupyter Graphs for Neo4j provides an easy way to visualize your database in Jupyter Notebooks.
The Data Explorer for Neo4j is a free database visualization and exploration tool based on the yFiles SDK. It lets you navigate your Neo4j database without the need to write Cypher queries unless you want to write them.
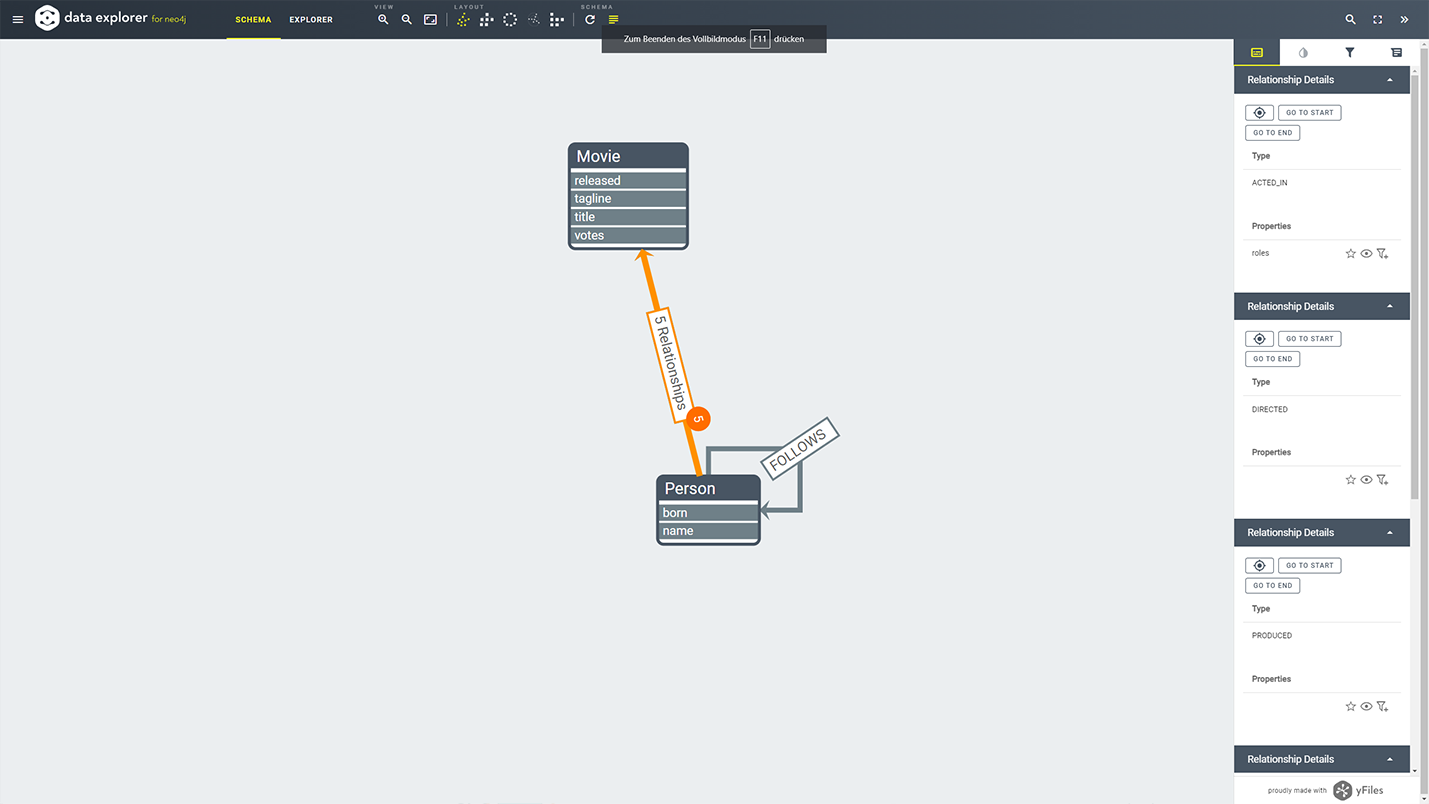
For a better understanding of your data, you can inspect the database schema and select or deselect elements of the database by label. Only the specified elements will be part of the database exploration which allows you to set a focus on certain aspects of your data.
The built-in template designer lets you design specific visualizations for nodes with different labels. Create visualizations manually without writing any code. You can also add mappings for properties that are visualized in the color or size of the nodes.
Optionally, you can use the integrated ChatGPT-based AI Assistant to generate node visualizations based on their label properties or to generate Cypher queries from free text queries.
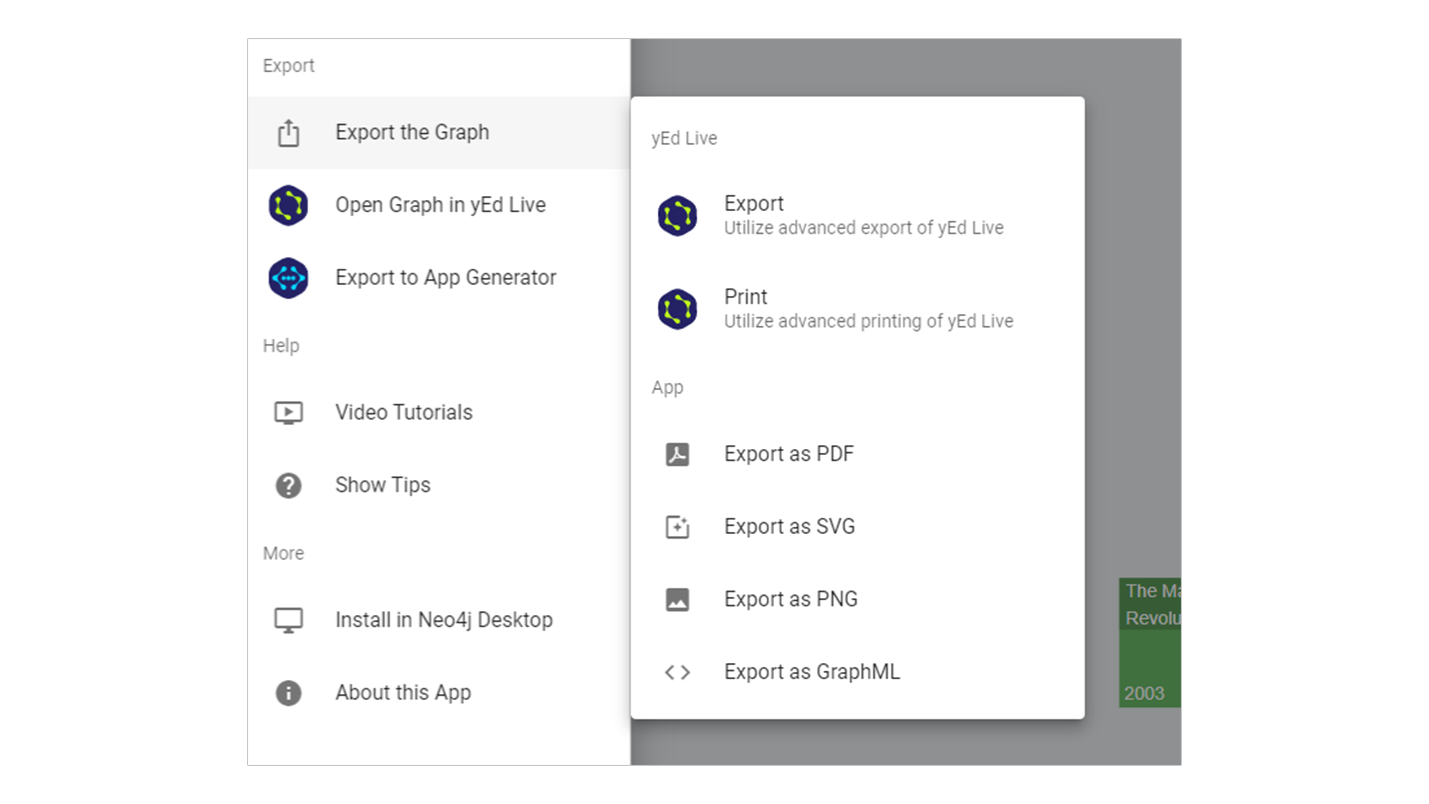
The Data Explorer allows you to export the explored graph to different formats and to open it in yEd Live or the App Generator.
Looking for an visualization with Python in Jupyter Notebooks? Our thin, open-source wrapper Python widget yFiles Jupyter Graphs for Neo4j provides an easy way to visualize your database in Jupyter Notebooks.
What to expect on this page
Why use the Data Explorer?
Easy access and interactive exploration
Connect to a remote or local Neo4j database or load a sample database such as the movies database. Inspect the database schema or start exploring the data right away.
Load specific or random data as a starting point and explore the nodes' incident relationships or neighbor nodes using the context menu.
Automatic layouts and graph analysis
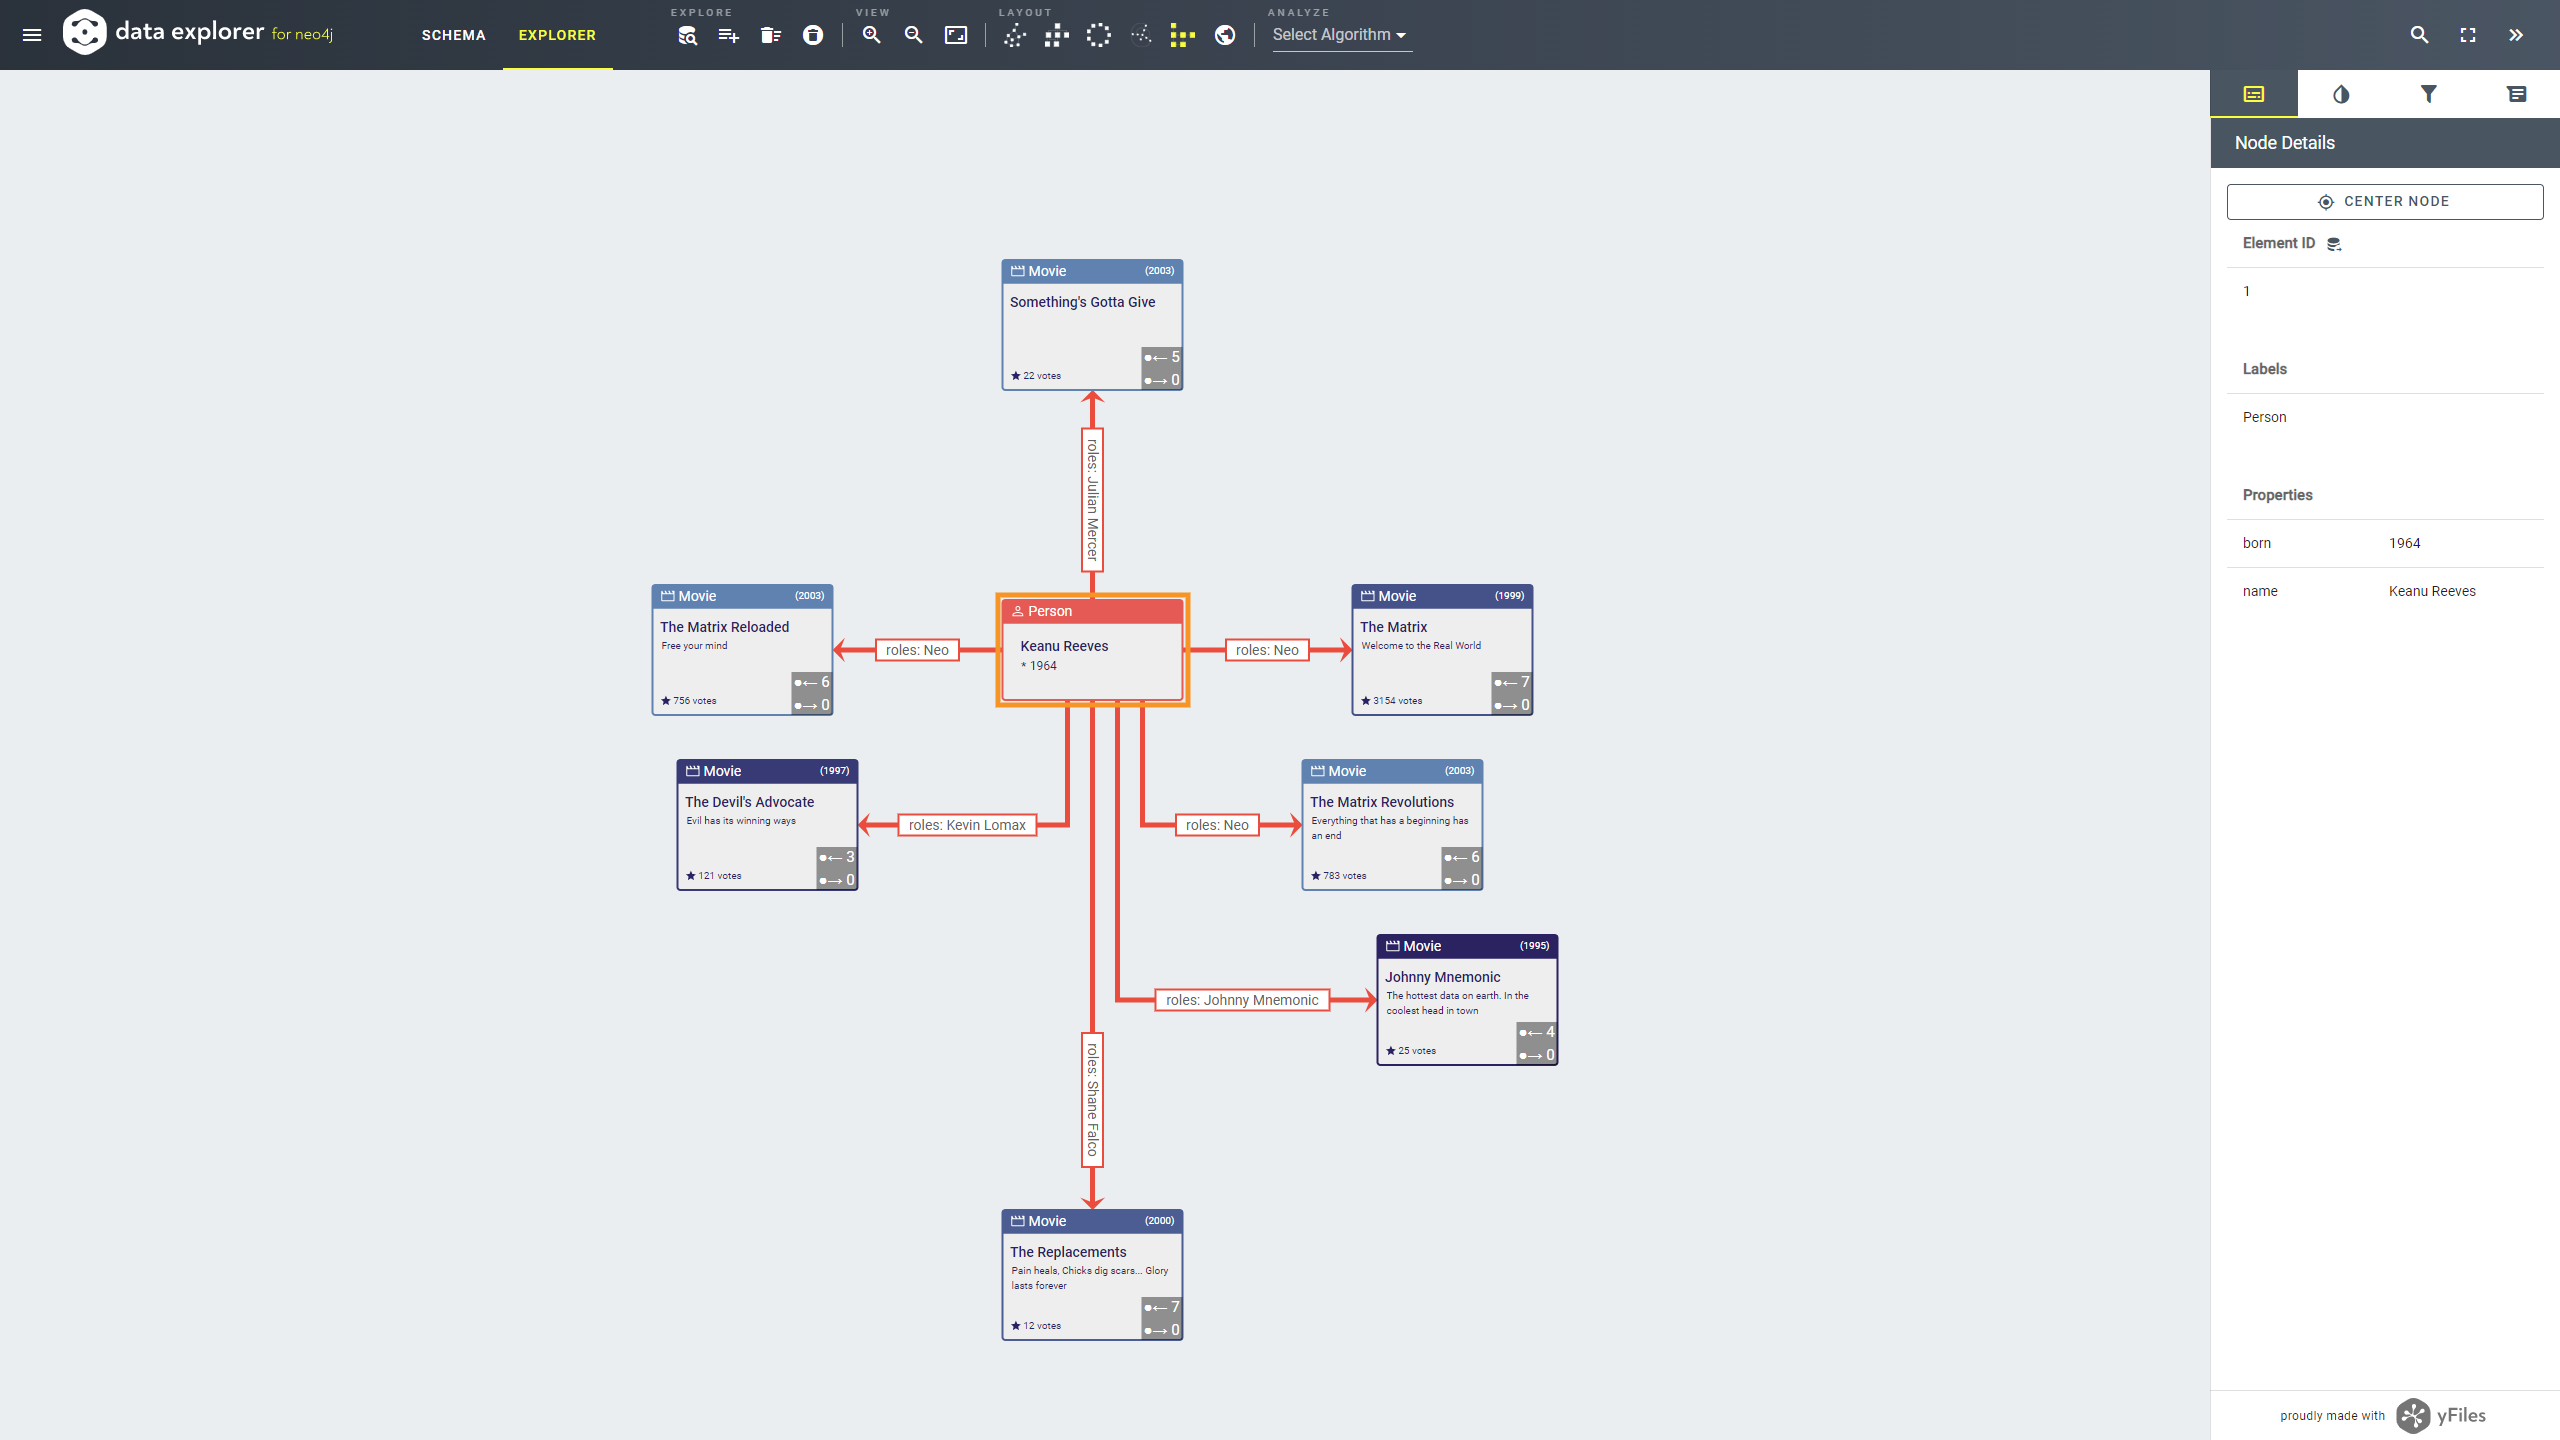
Use predefined layout algorithms from the yFiles SDK to arrange the graph. Then, the data is clearer and highlights aspects like hierarchies.
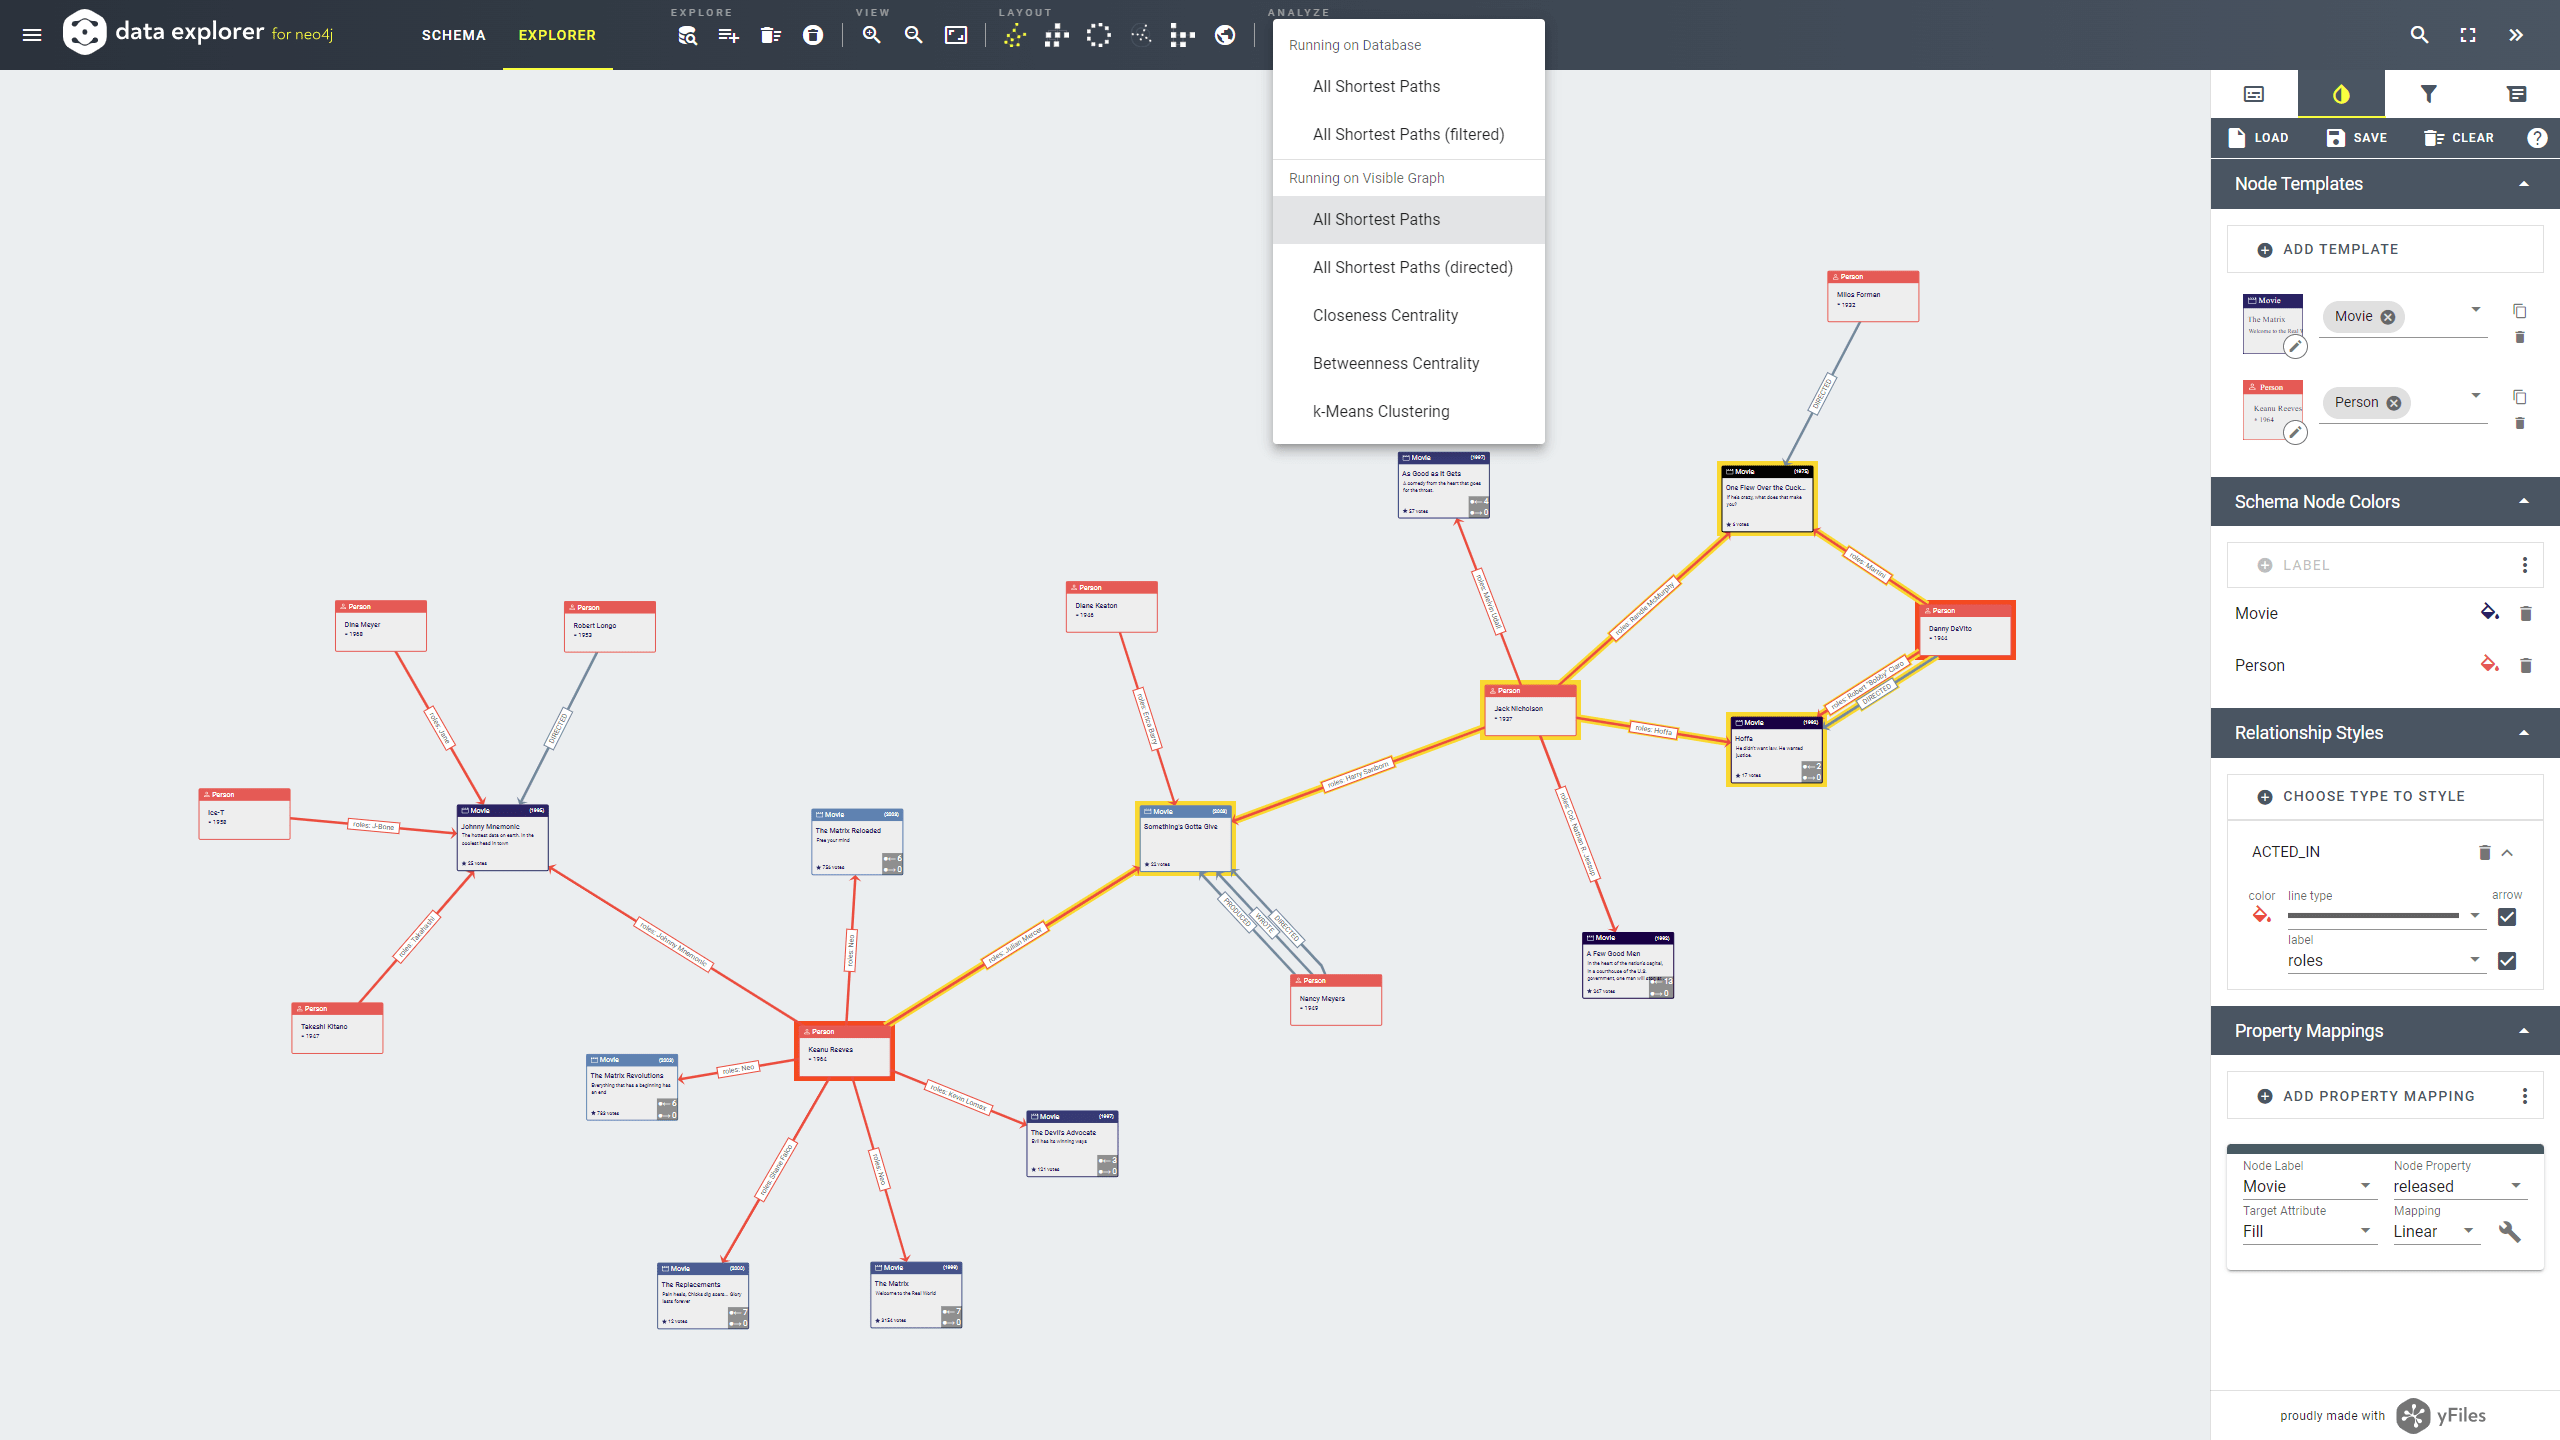
Sophisticated graph analysis algorithms help to reveal new aspects in the data, like finding the shortest distance between two nodes or calculating clusters and centralities.
Flexible visualization with easy templating
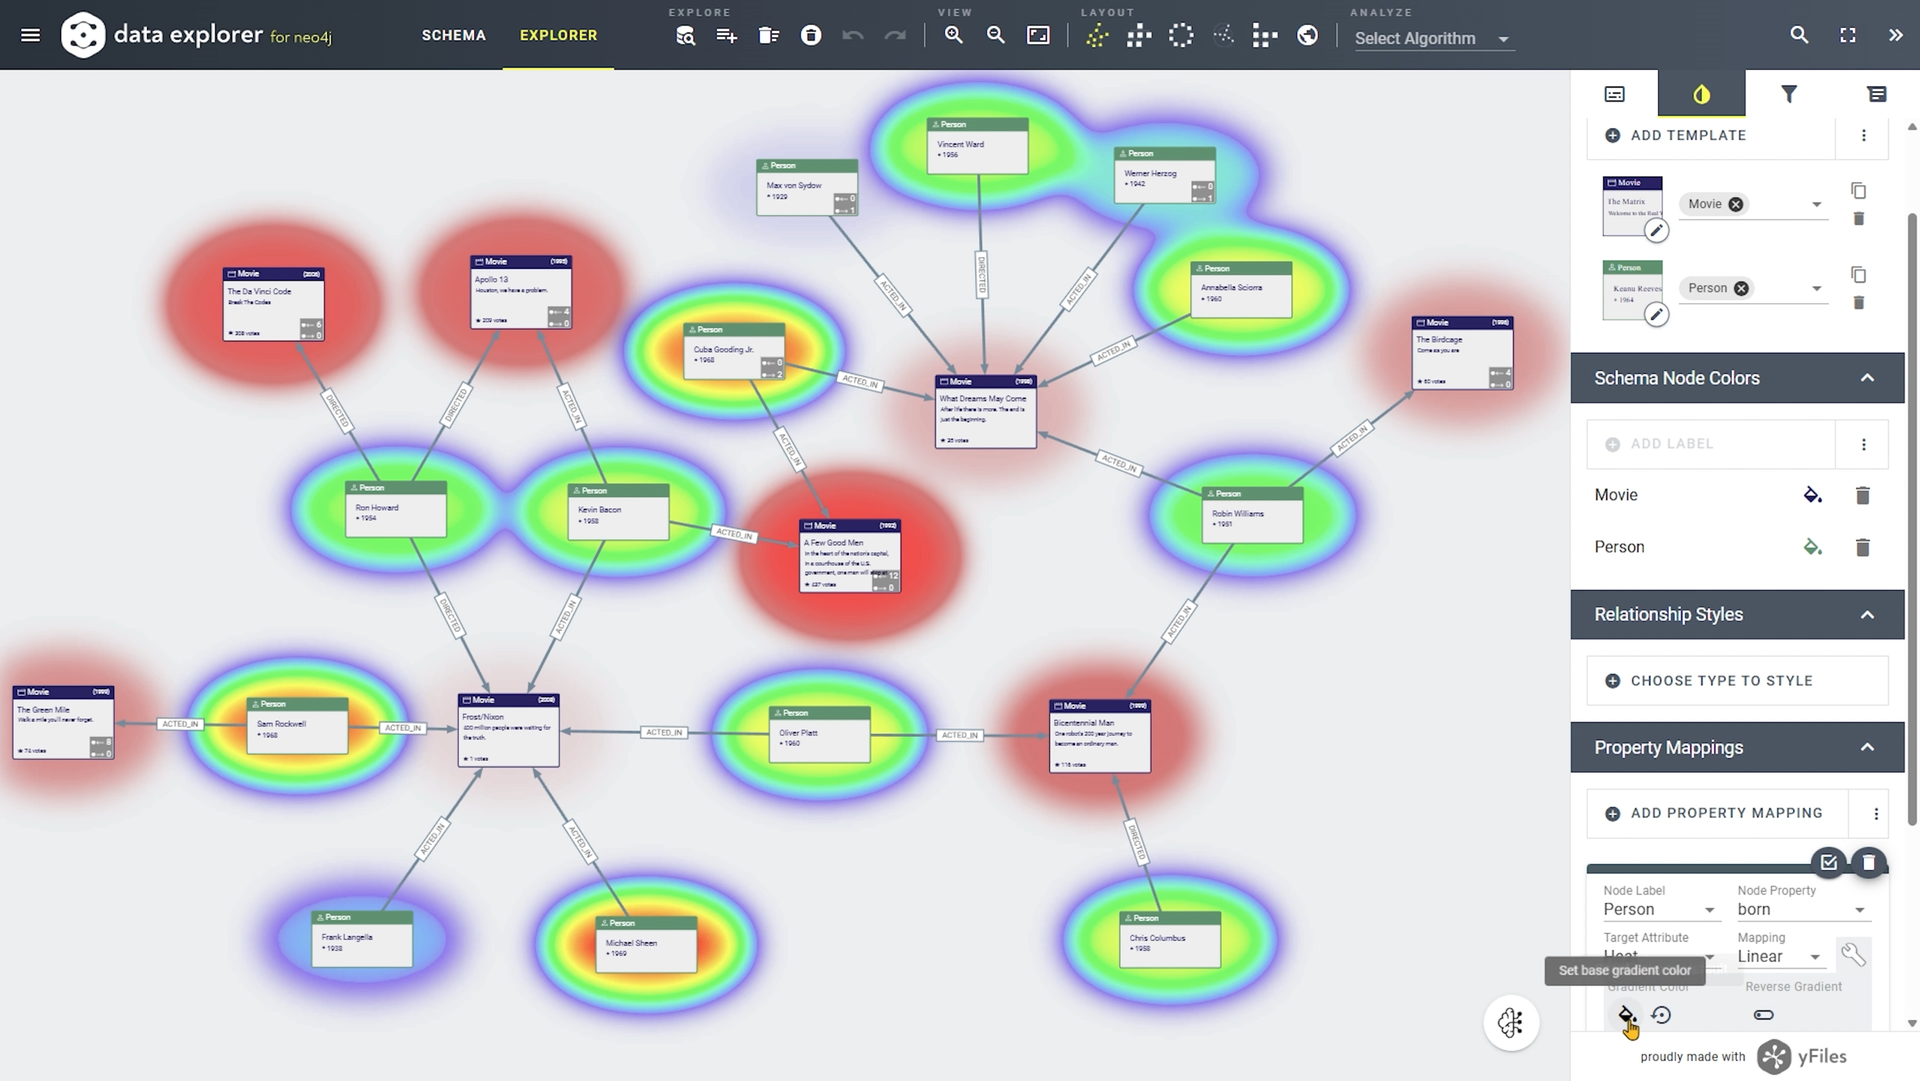
Bind the size or color of a node to a property to elevate the different values on the nodes.
The built-in template designer supports easy creation of styles that are assigned to nodes with different labels. The style is built from predefined shapes and text elements. Bindings to the data of a node allow for highlighting specific aspects and text from the data.
AI Assistant
The AI Assistant is designed to handle your free text queries for loading, selecting, or highlighting nodes and relations.
Take advantage of the Template Wizard to automatically generate visually appealing node templates, showcasing their significant properties.
Features
Automatic layout
Schema view
Graph analysis algorithms
Explore data with heatmaps
Focus on specific aspects

Customizable visualizations
Free text queries

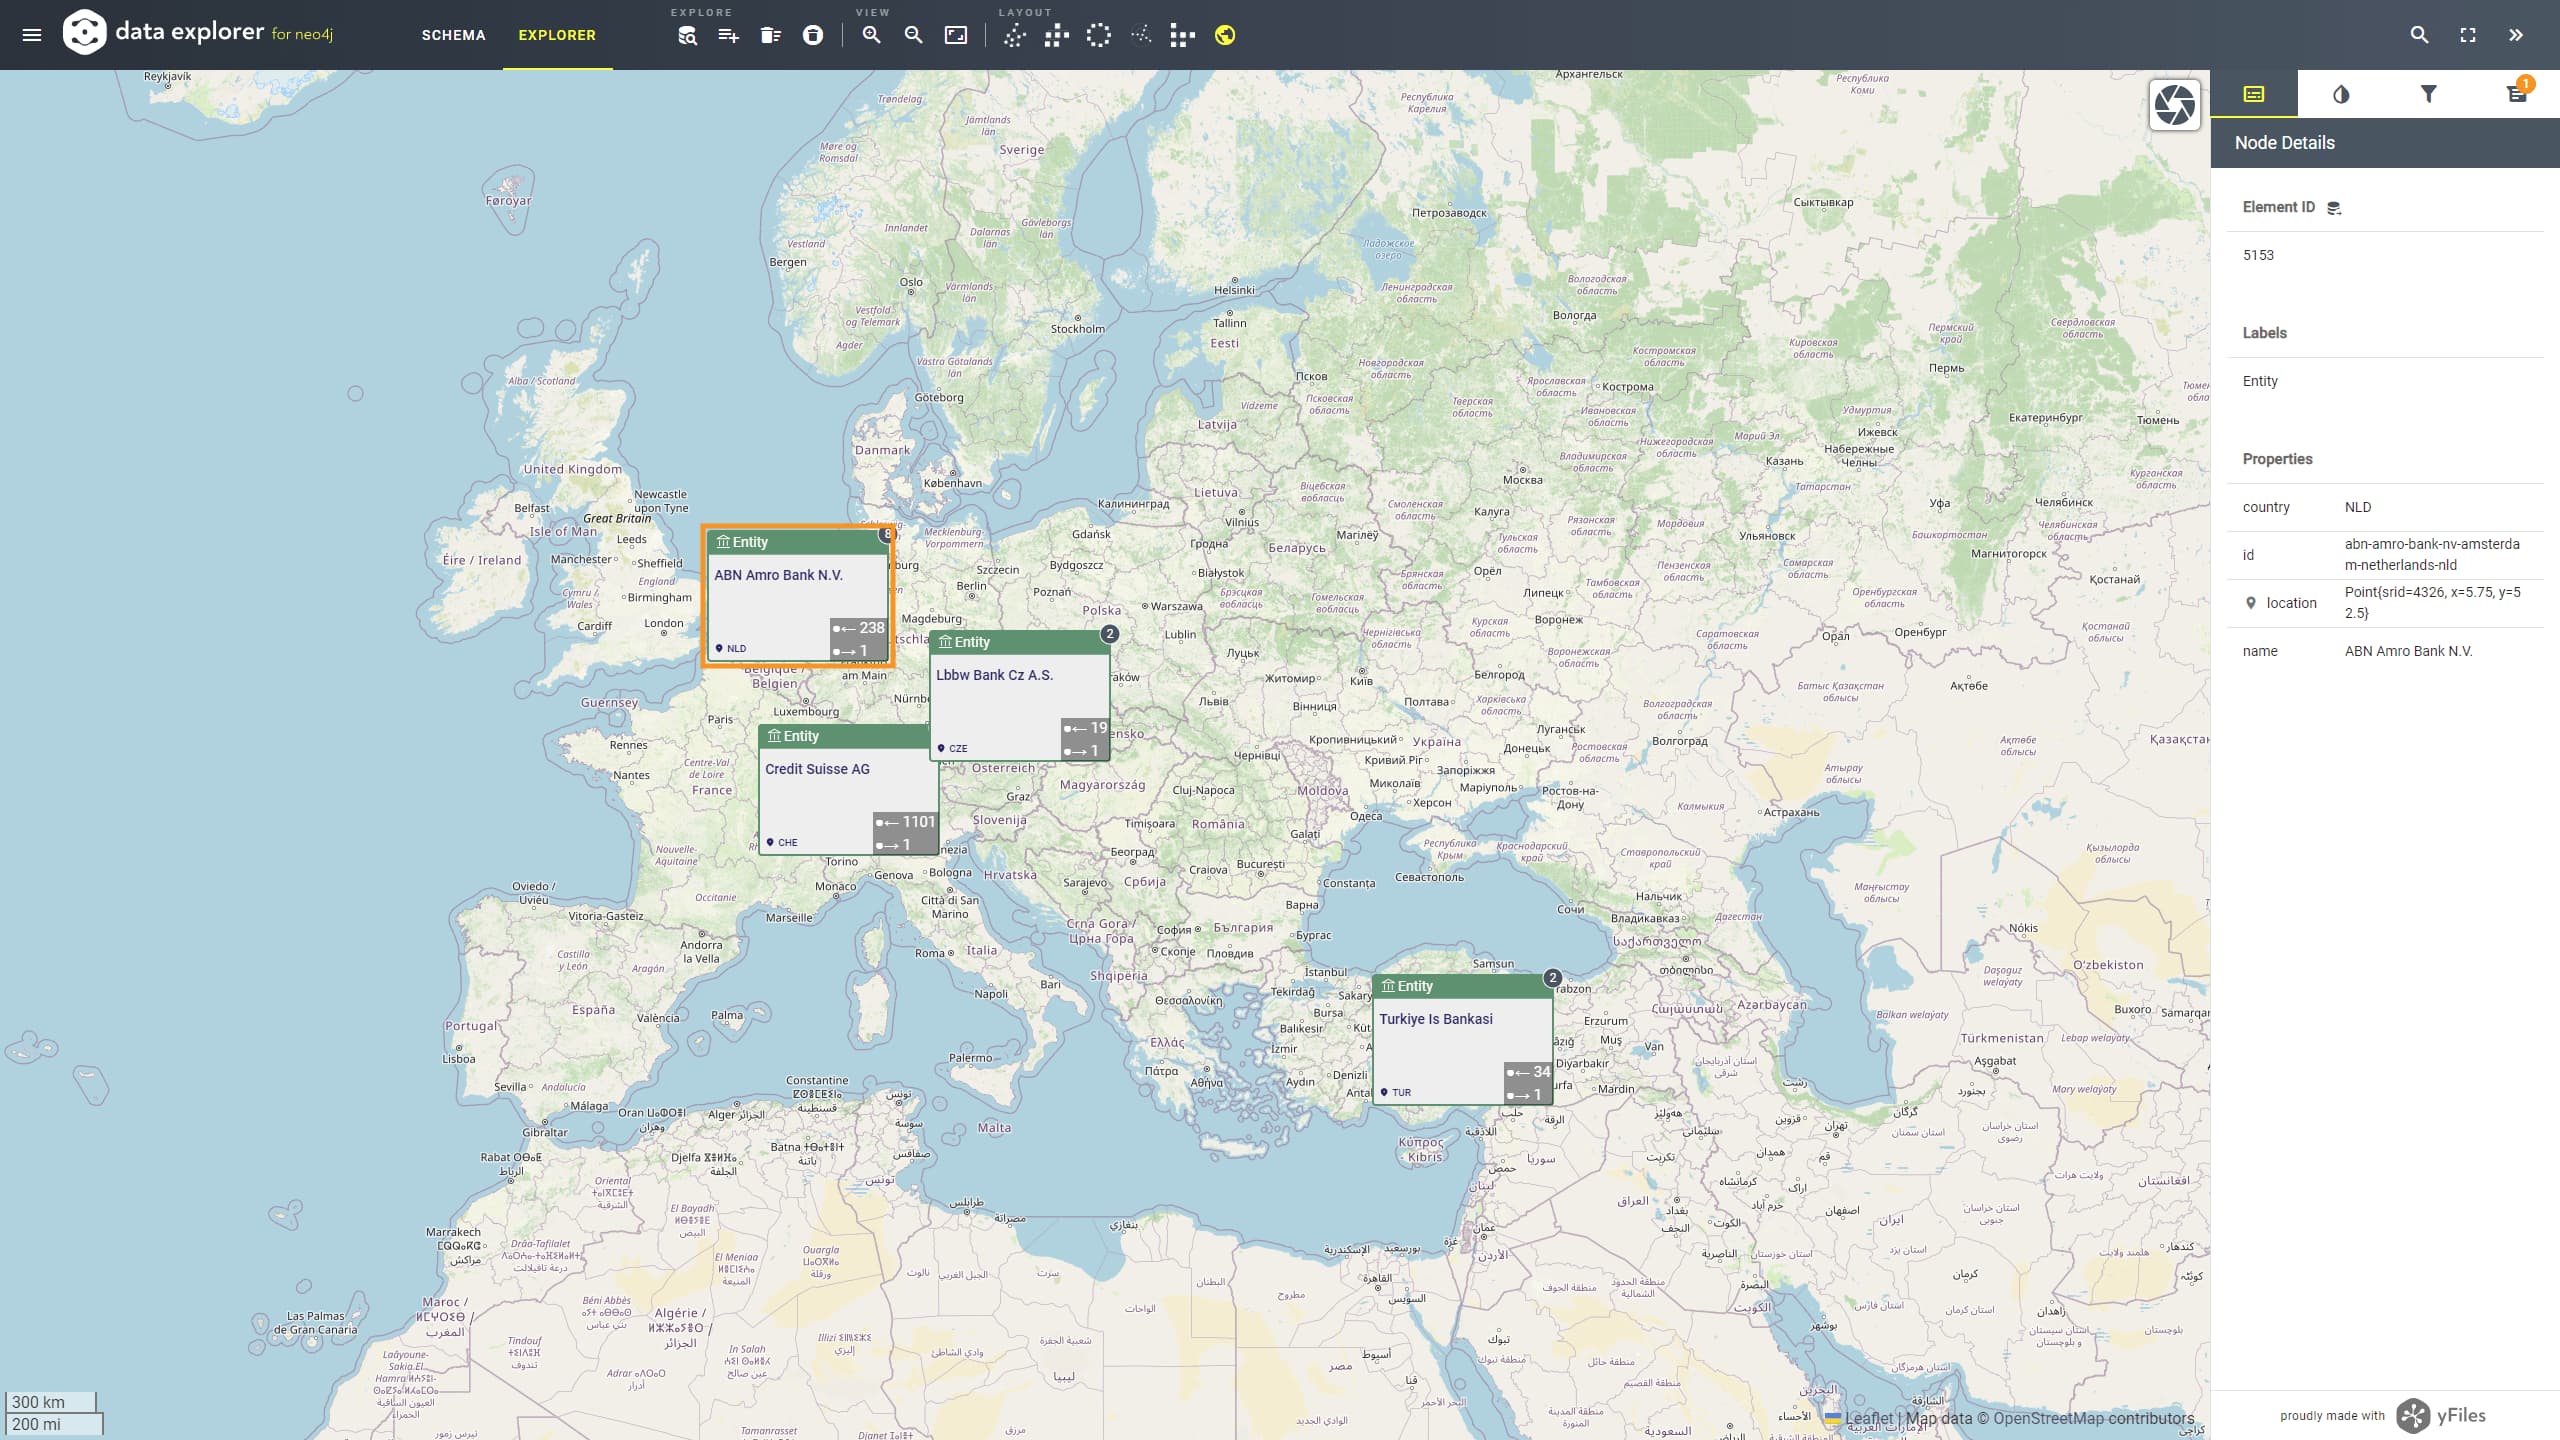
Geolocation mapping
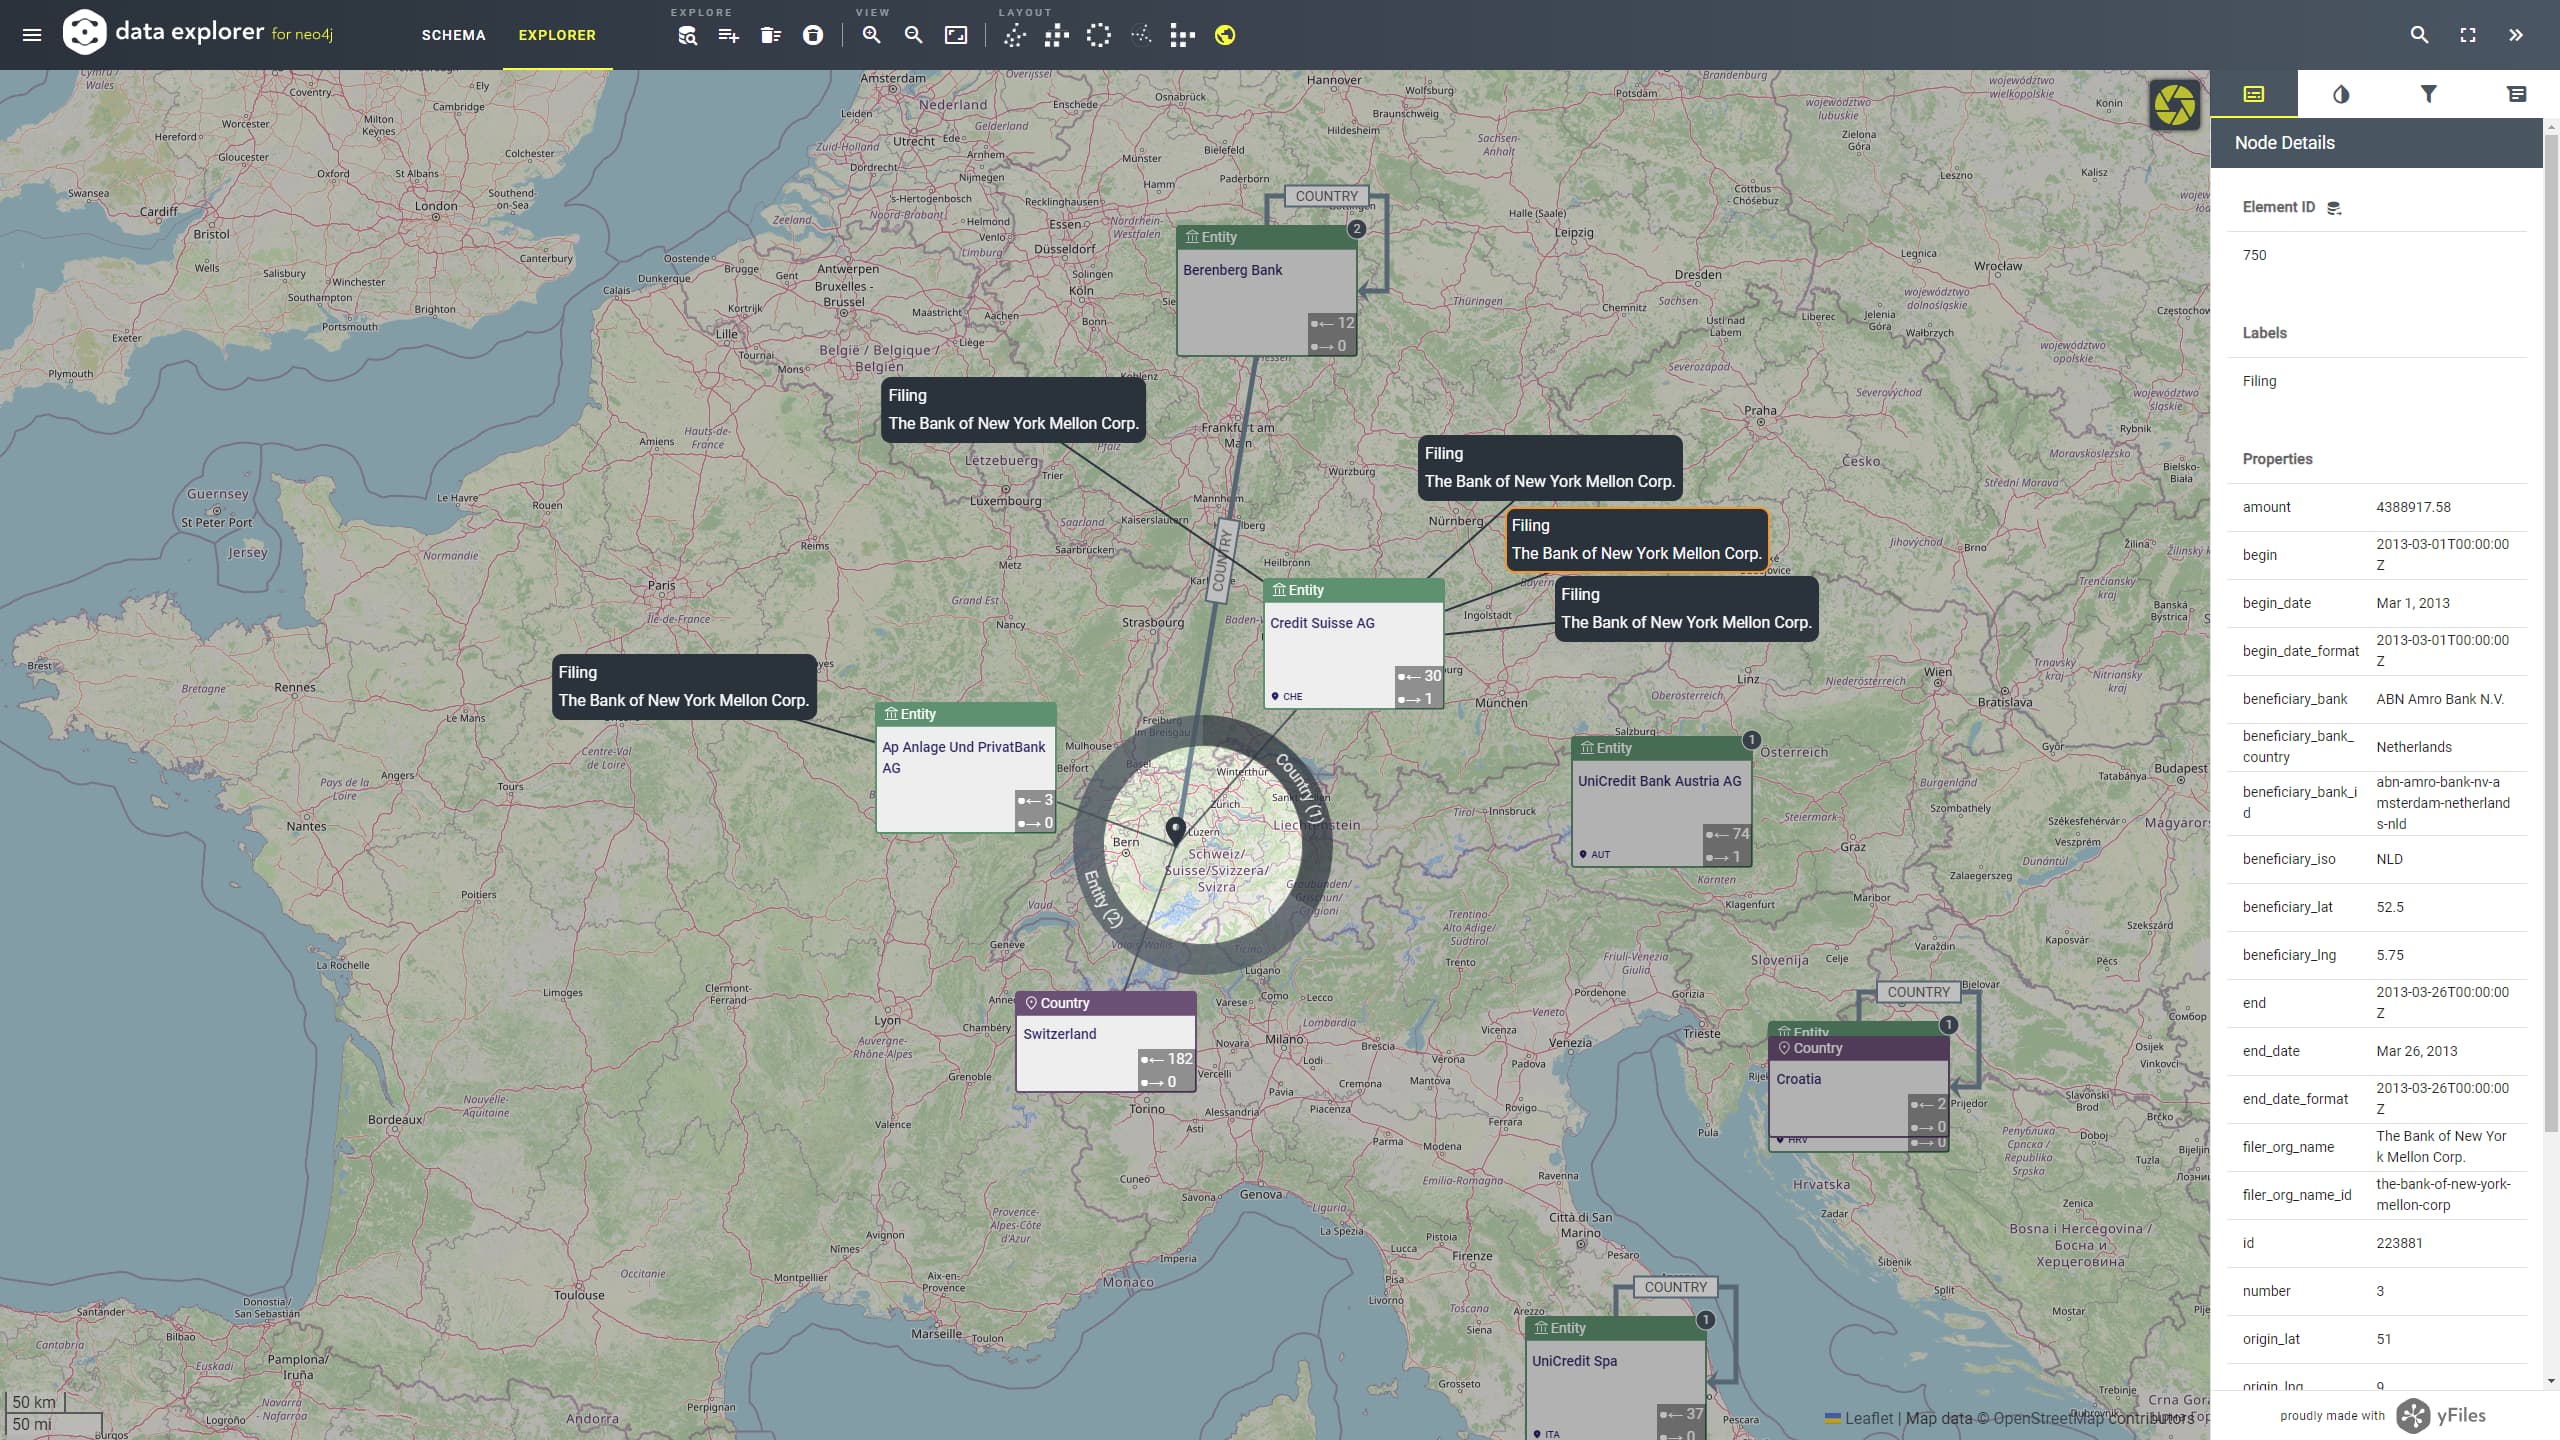
Wonder Lens
Multiple ways of data exploration
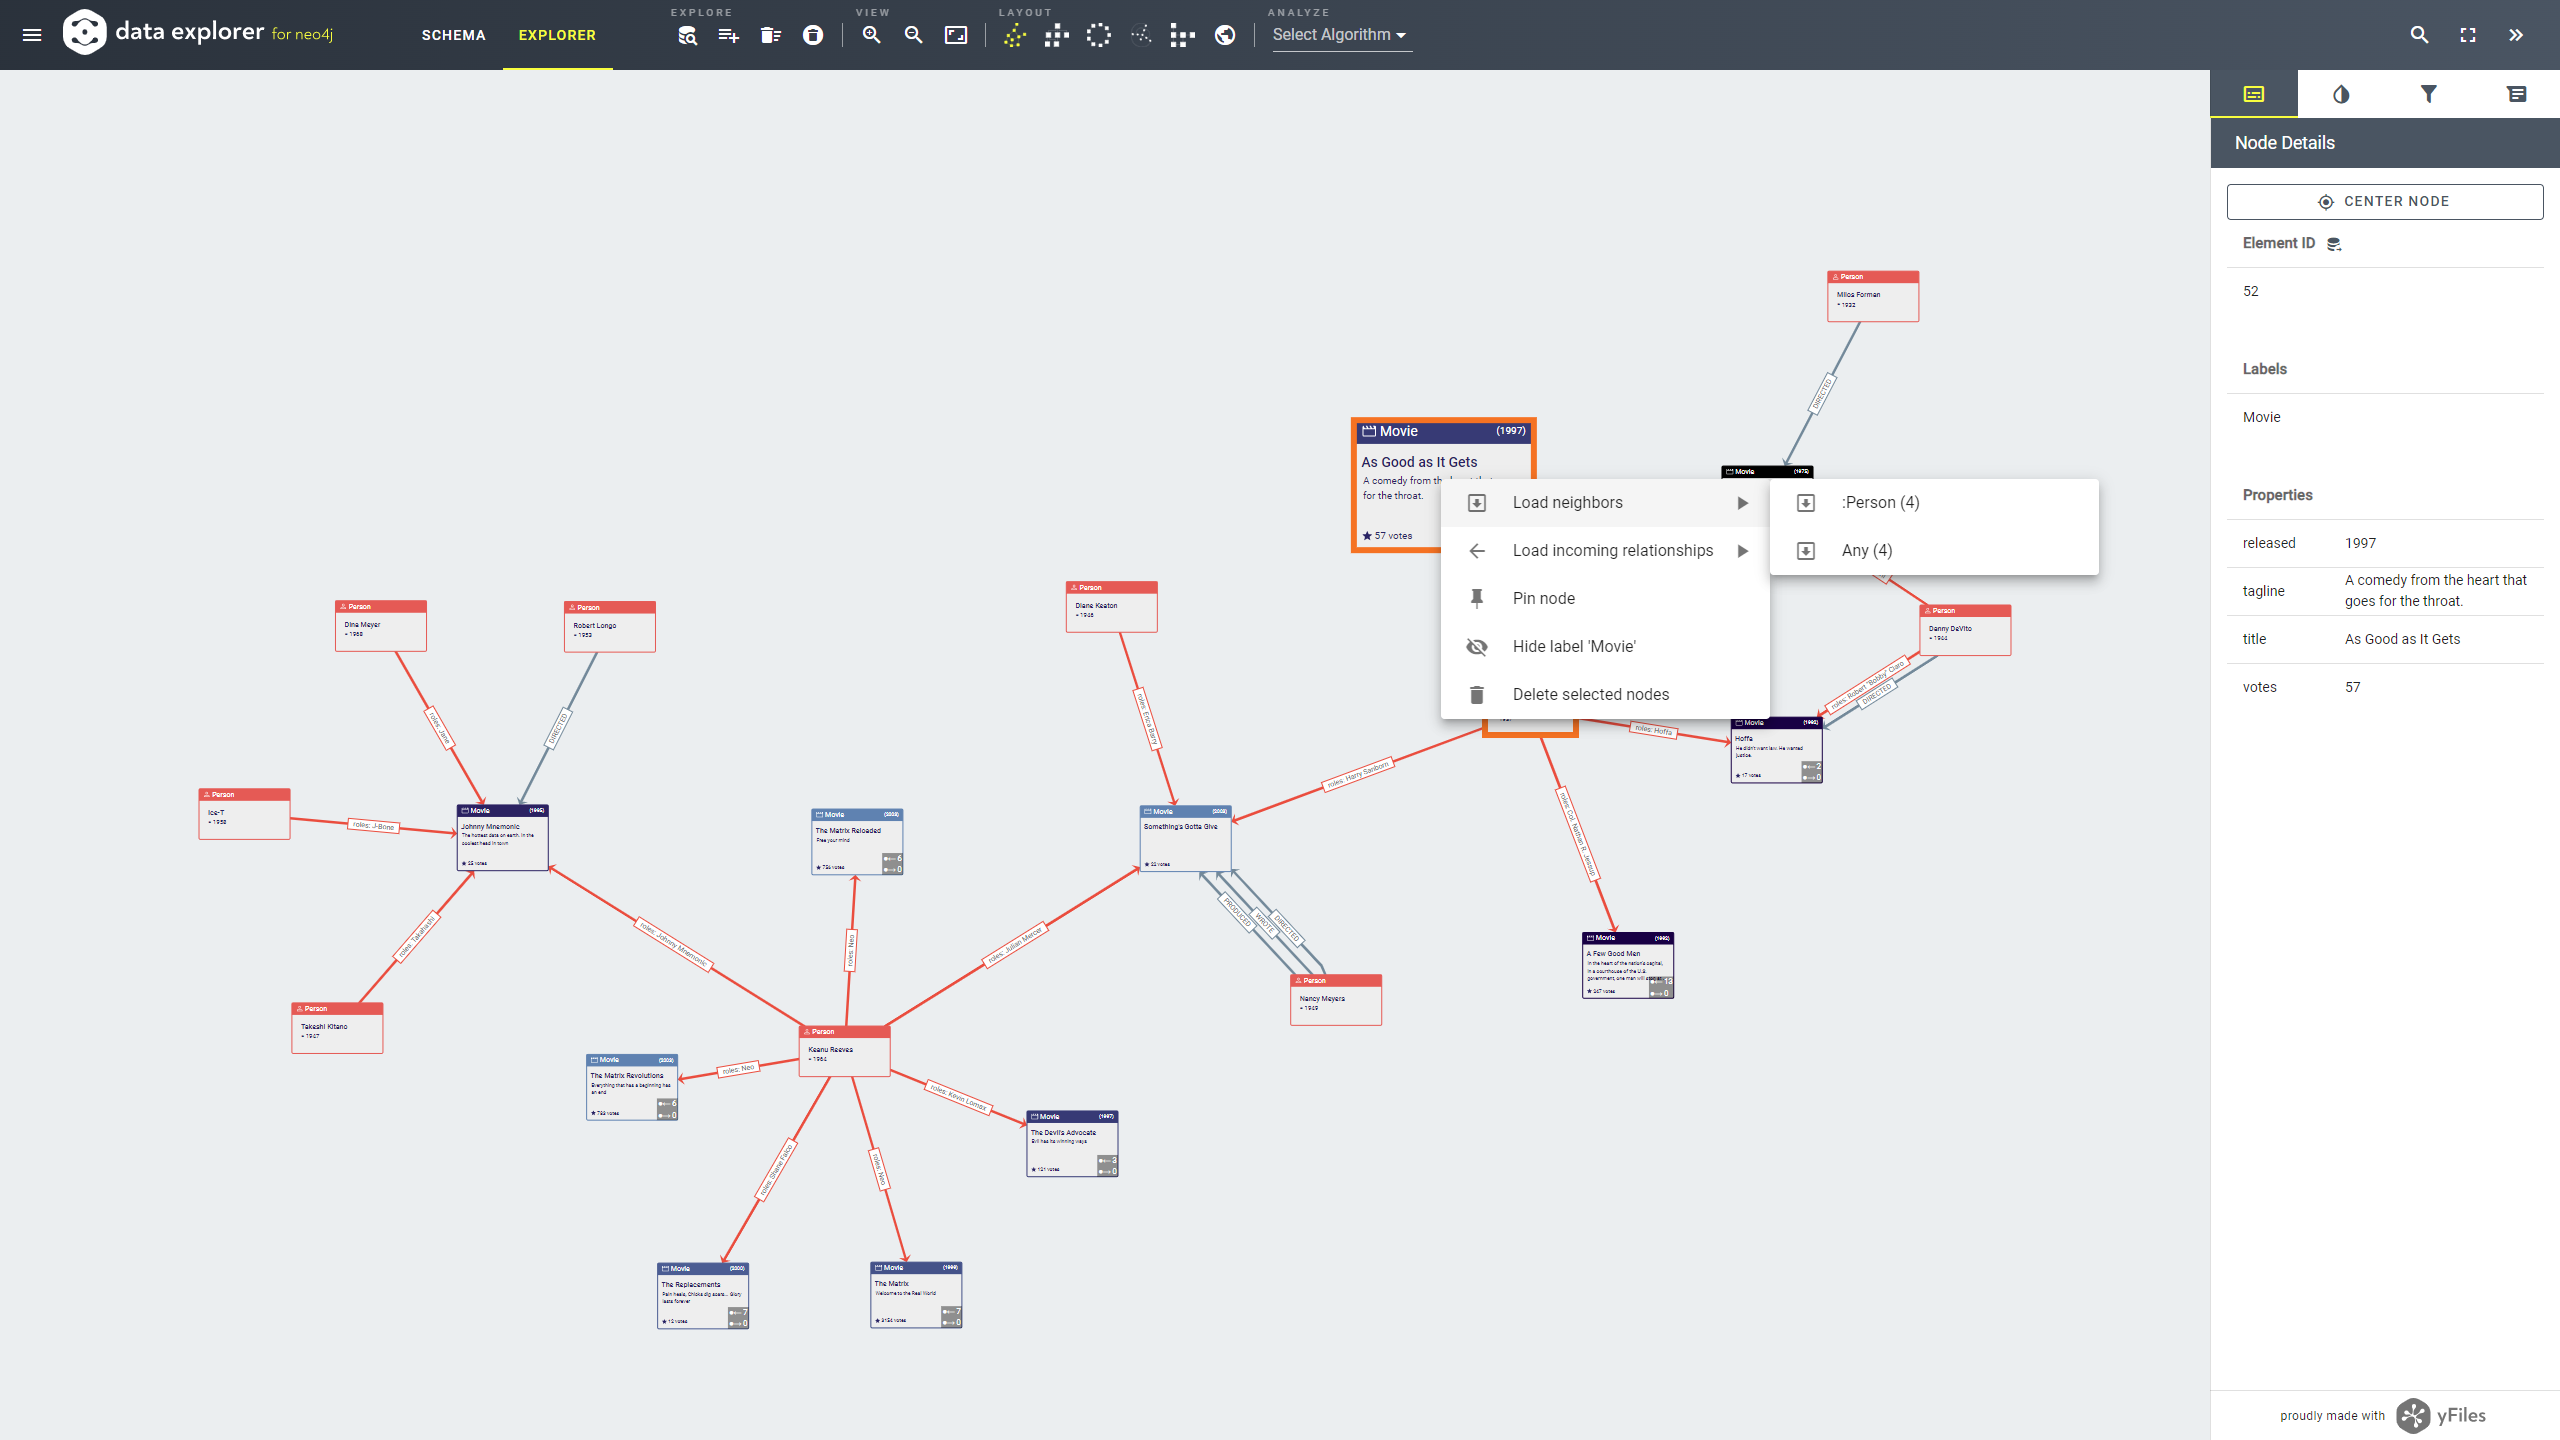
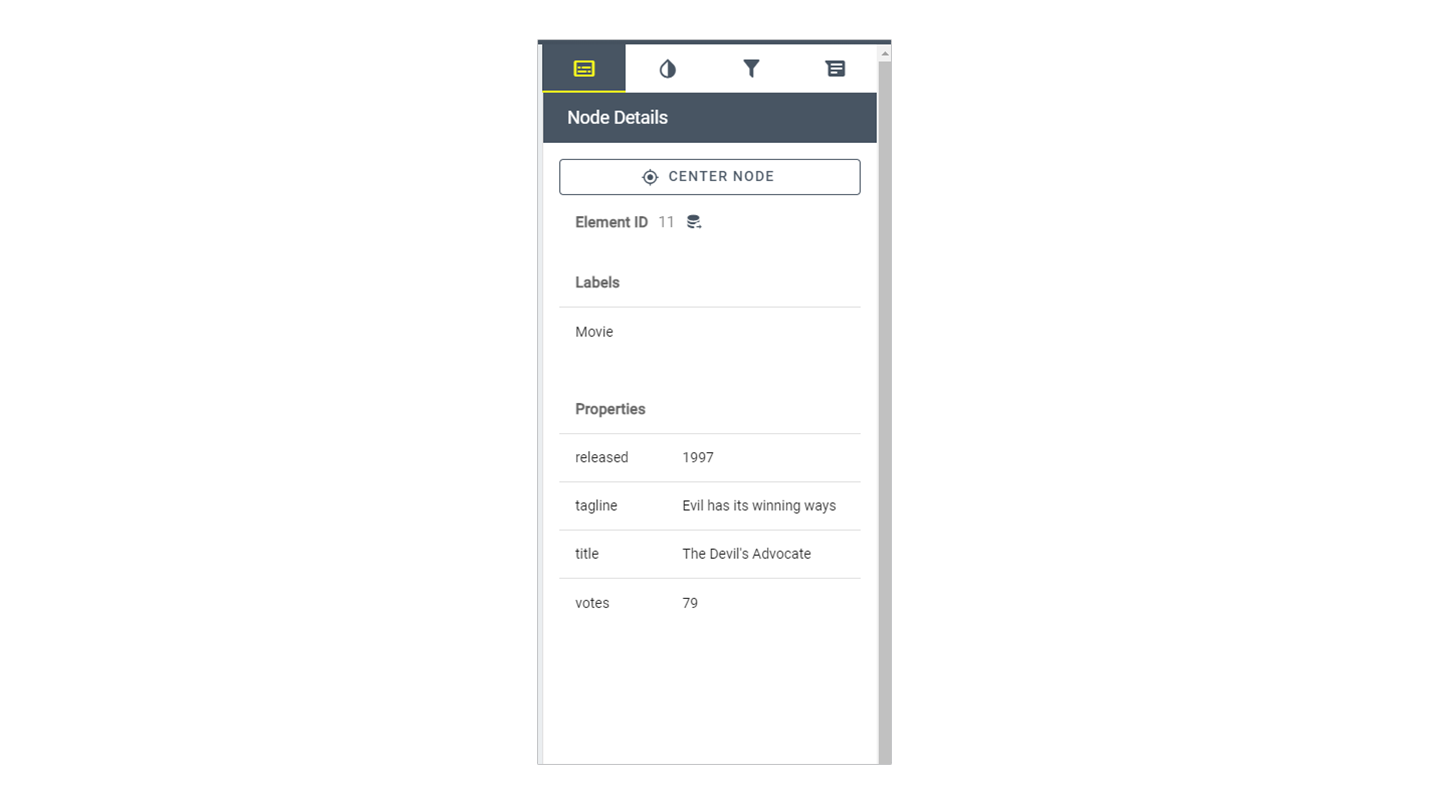
Node and relationship details
Share your graph with others
Free license
Explore your Neo4j graph database -
at no cost
Using the Data Explorer for Neo4j to explore or visualize your databases is completely free of charge.
Technical information
Requirements
The Data Explorer for Neo4j runs in all current browsers.
Besides the provided sample databases, you have the option to connect to your own (public or internal) database that supports the bolt-protocol.It is recommended to use credentials for a read-only database user, as the database will not be modified.
The Data Explorer runs completely in your browser and directly connects from it to the database, ensuring that your database credentials and content remain private and are never sent to, nor piped through, nor even touched by our or any third party servers. You can even disconnect from the internet, once the app has loaded.
If you choose to use the optional AI Assistant, you will be asked to accept OpenAI's privacy policy. This feature requires the transmission of your request and the database schema to yWorks and OpenAI servers for processing. In this case, we also store and anonymize your request on our servers to enhance the AI feature, in compliance with data protection regulations. For more information, please refer to our Privacy Policy.
More information
Have more questions?
Find helpful information here:
Getting started
Start the Data Explorer for Neo4j directly in your browser. No installation needed!
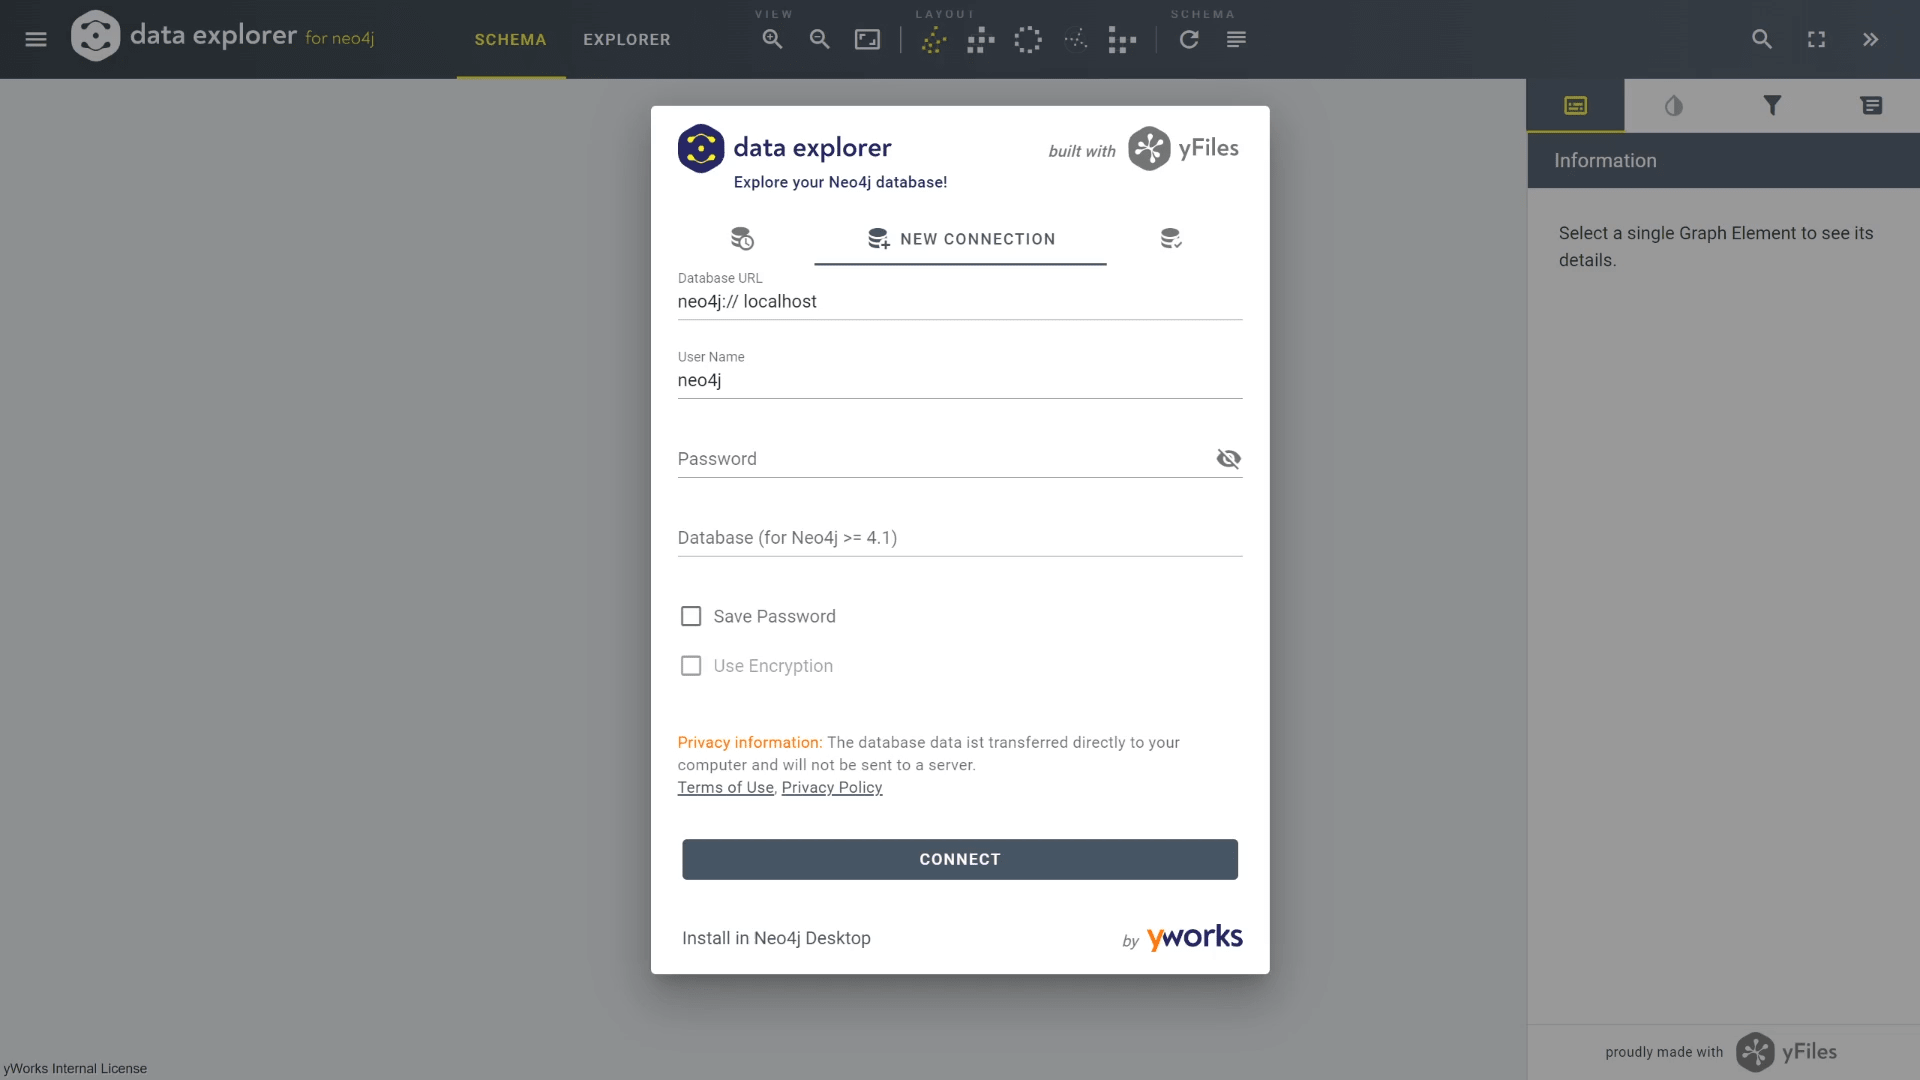
Insert your Neo4j database credentials or use one of the sample databases and hit the connect-button.
Inspect the database schema or interactively explore the data.
you might want to explore
Why, how, what? —Just ask the diagramming experts!

Our team is happy to advise you – no strings attached. Let's talk about your project and find the perfect solution for your needs!
E-mail: hello@yworks.com
Your message has been sent.
Your request could not be sent. Please reload the page and try again.
If the problem persists, please report the error to webmaster@yworks.com.
Learn more in our privacy policy.
