Analyzing Network Data
Graph analysis algorithms help investigating the network structure and identifying prominent characteristics of the data
Graph theory studies relationships between objects. Besides the visual aspects, e.g., the positions of the graph elements, there exist also various aspects that define the characteristics of a graph. For example, one might want to know which elements in a graph are connected, whether a circle exists in a sequence of elements, or — quite common — which is the shortest path between a start and an end element.
Common Problems in Graph Analysis
Different algorithms approach multiple common problems in graph analysis like pathfinding, circle detection, or connectivity within a graph.
yFiles is a commercial programming library that offers several ready-to-use graph analysis algorithms. It also provides all the means for visualizing the graph structure and extended interaction support.
Paths
A common use case in graph analysis is finding a path between two nodes. A path is defined as a sequence of edges which joins a sequence of distinct nodes. If the edges along the path are associated with costs or weights, it might be of interest to find the shortest (or cheapest) path between two nodes.
The image above depicts the result of a shortest path algorithm in a uniform, undirected graph (left), with weights assigned to the edges (middle), or in a directed graph (right).
Connectivity
Connectivity determines which parts of a graph are reachable from other parts by following the edges respecting or ignoring their direction.
Note the two different components in the example above, emphasized by different colors.
Reachability analysis solves a similar problem by finding the nodes that are reachable from a given node.
The example above shows a directed graph. Only the colored nodes are reachable from the green node.
Centrality
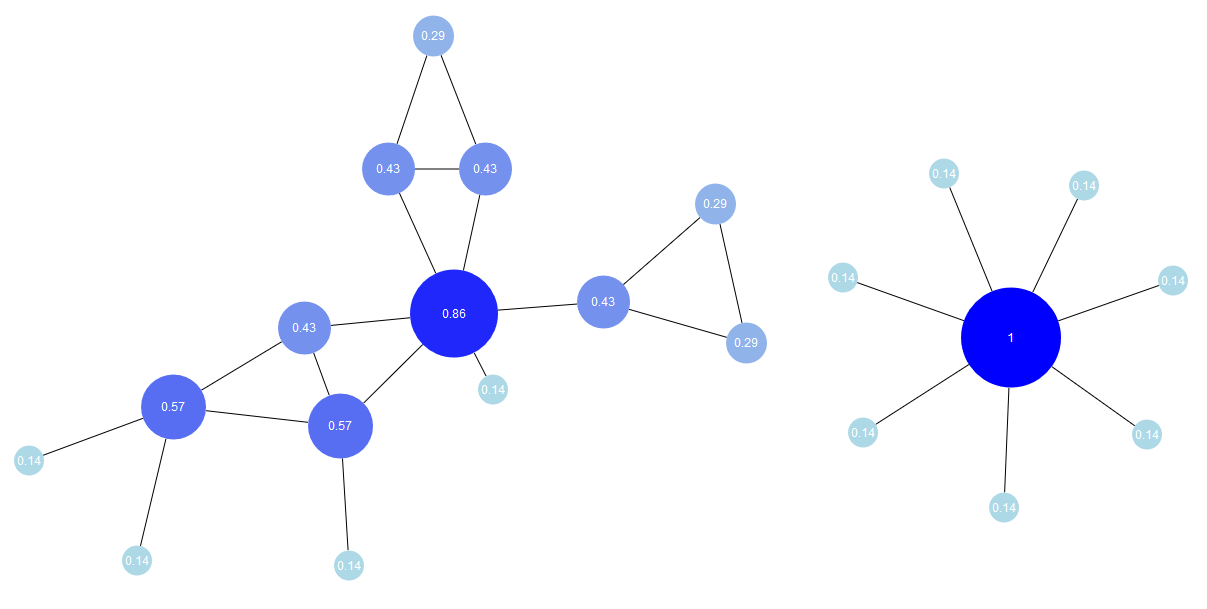
So-called centrality measures reveal the importance of single nodes or edges within the graph structure. The centrality value of a graph element denotes its importance, i.e., the higher the value, the more important the element.
There are different ways to measure centrality. Degree centrality, for example, takes the degree of a node into consideration, i.e., the number of its incoming and outgoing edges, determine its centrality value.
The so-called graph centrality provides another approach. It uses the reciprocal of the maximum of all the shortest path distances from one node to all other nodes in the graph which yields a completely different result.
Cycles
Detecting circular structures or rings in a graph is also of importance in various applications, for example fraud detection. In graph theory, a cycle is defined as a set of consecutive nodes of a graph in which the first and the last nodes of this set coincide.
The image above shows cycle detection in an undirected graph (left) and a directed graph (right).
Example and Source Code
yFiles comes with a Graph Analysis Sample Application. It allows the user to experiment with different algorithms. Users can explore sample graphs or create their own and use the supported analysis algorithms to highlight paths, components, or spanning trees. Switching between directed and undirected edges or interactively assigning different or uniform weights enable the user to explore the flexibility of the supported algorithms.
The source code of the Graph Analysis Sample Application is part of all yFiles packages and available on the yWorks GitHub repository:
yFiles Graph Analysis Algorithms in Your Own Application
Test the yFiles graph analysis algorithms with a fully functional trial package of yFiles. The graph analysis algorithms work on the standard yFiles graph model and can be used in any yFiles-based project with a few lines of code.


