Clustering Graphs and Networks
Choosing a suitable clustering algorithm for your data
Detecting graph elements with “similar” properties is of great importance, especially in large networks, where it is crucial to identify specific patterns or structures quickly. The process of grouping together elements/entities that appear based on some similarity measure to be closer to each other (than from the remaining elements) is called cluster analysis.
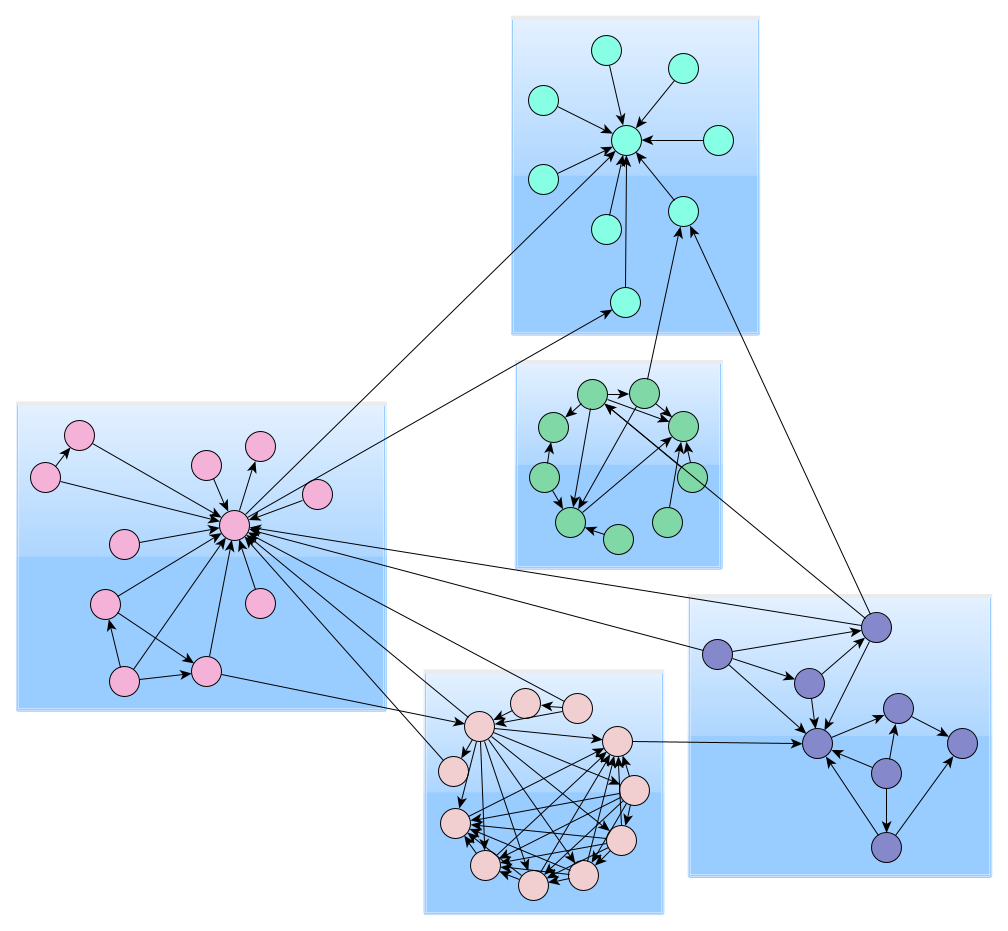
The similarity measure is usually calculated based on topological criteria, e.g., the graph structure, or on the location of the nodes, or other characteristics, e.g., specific properties of the graph elements. Nodes that based on this similarity value are considered to be similar are grouped into the so-called clusters. In other words, each cluster contains elements that share common properties and characteristics. The collection of all the clusters composes a clustering.
Cluster analysis has many applications fields, such as data analysis, bioinformatics, biology, big data, business, medicine. However, each of these applications may consider differently the "clustering notion," which is reflected by the fact that there exist many clustering algorithms or clustering models.
How to Automatically Cluster Elements in Graphs
Even though the implementation of a clustering algorithm does not require a highly experienced developer, it is often the case that only one algorithm is not sufficient for the data analysis, or the appropriate clustering algorithm is not known beforehand. In such cases, the user seeks complete tools and solutions that offer different clustering algorithms that can apply to their graphs. Many users also have more expectations from these tools. For example, they would also like to obtain a specific arrangement of the graph elements that also mirrors this clustering information. As additional functionality, a user may also require to render the clusters with a different style or even interact with the resulting diagram and manually modify the clustering.
All the above can create limitations to users that utilize general tools providing specific clustering algorithms. yFiles is a commercial programming library that offers several ready-to-use clustering algorithms. It also allows the user to develop additional clustering algorithms and easily integrate them into any application built with the library. Except for the clustering algorithms, it also provides all the means for visualizing the graph structure and extended interaction support.
Clustering Based on Topology
yFiles offers two clustering algorithms based on graph topology that can be customizable by the user.
Edge Betweenness Clustering
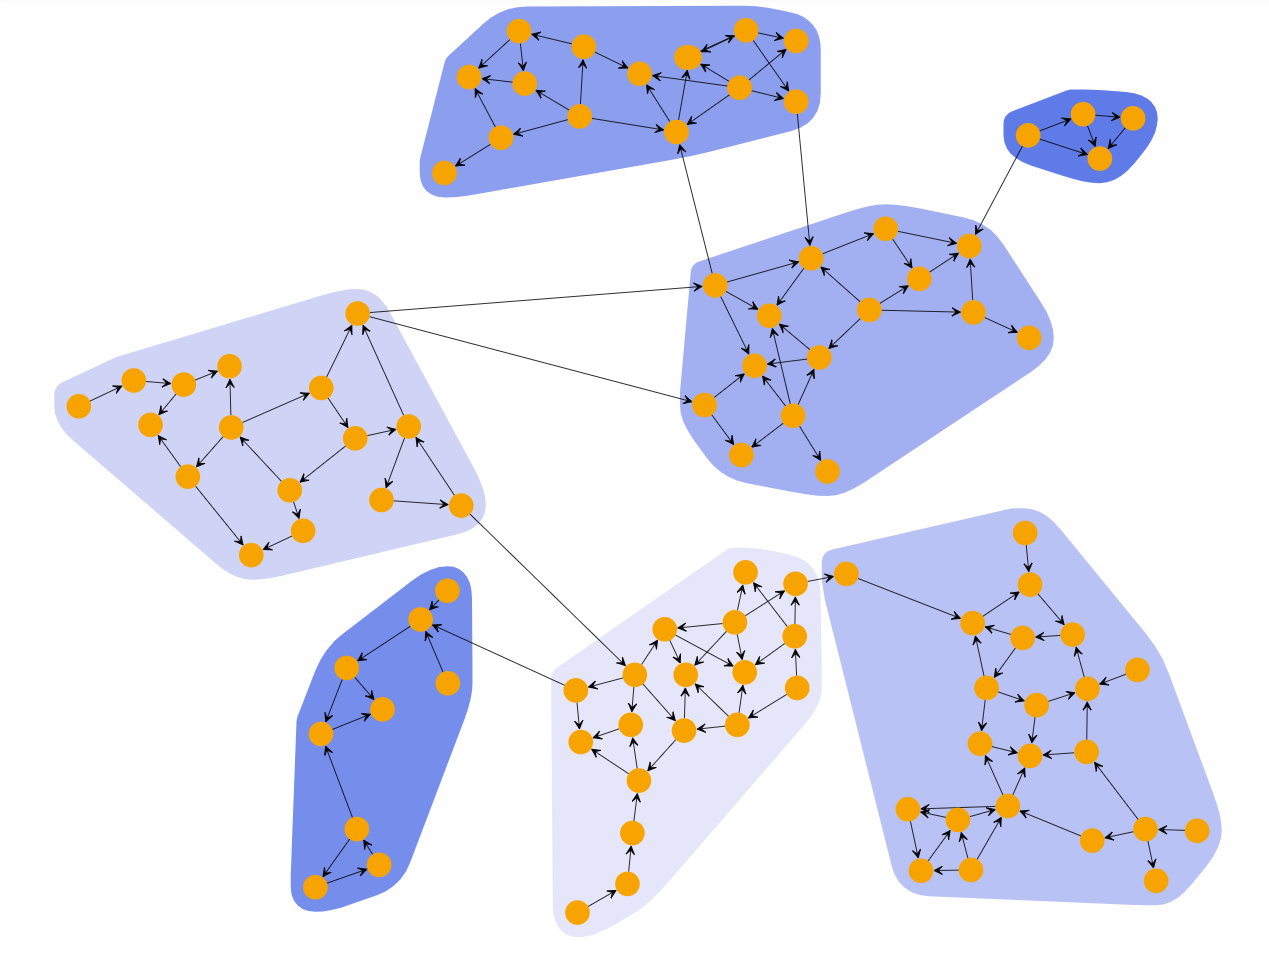
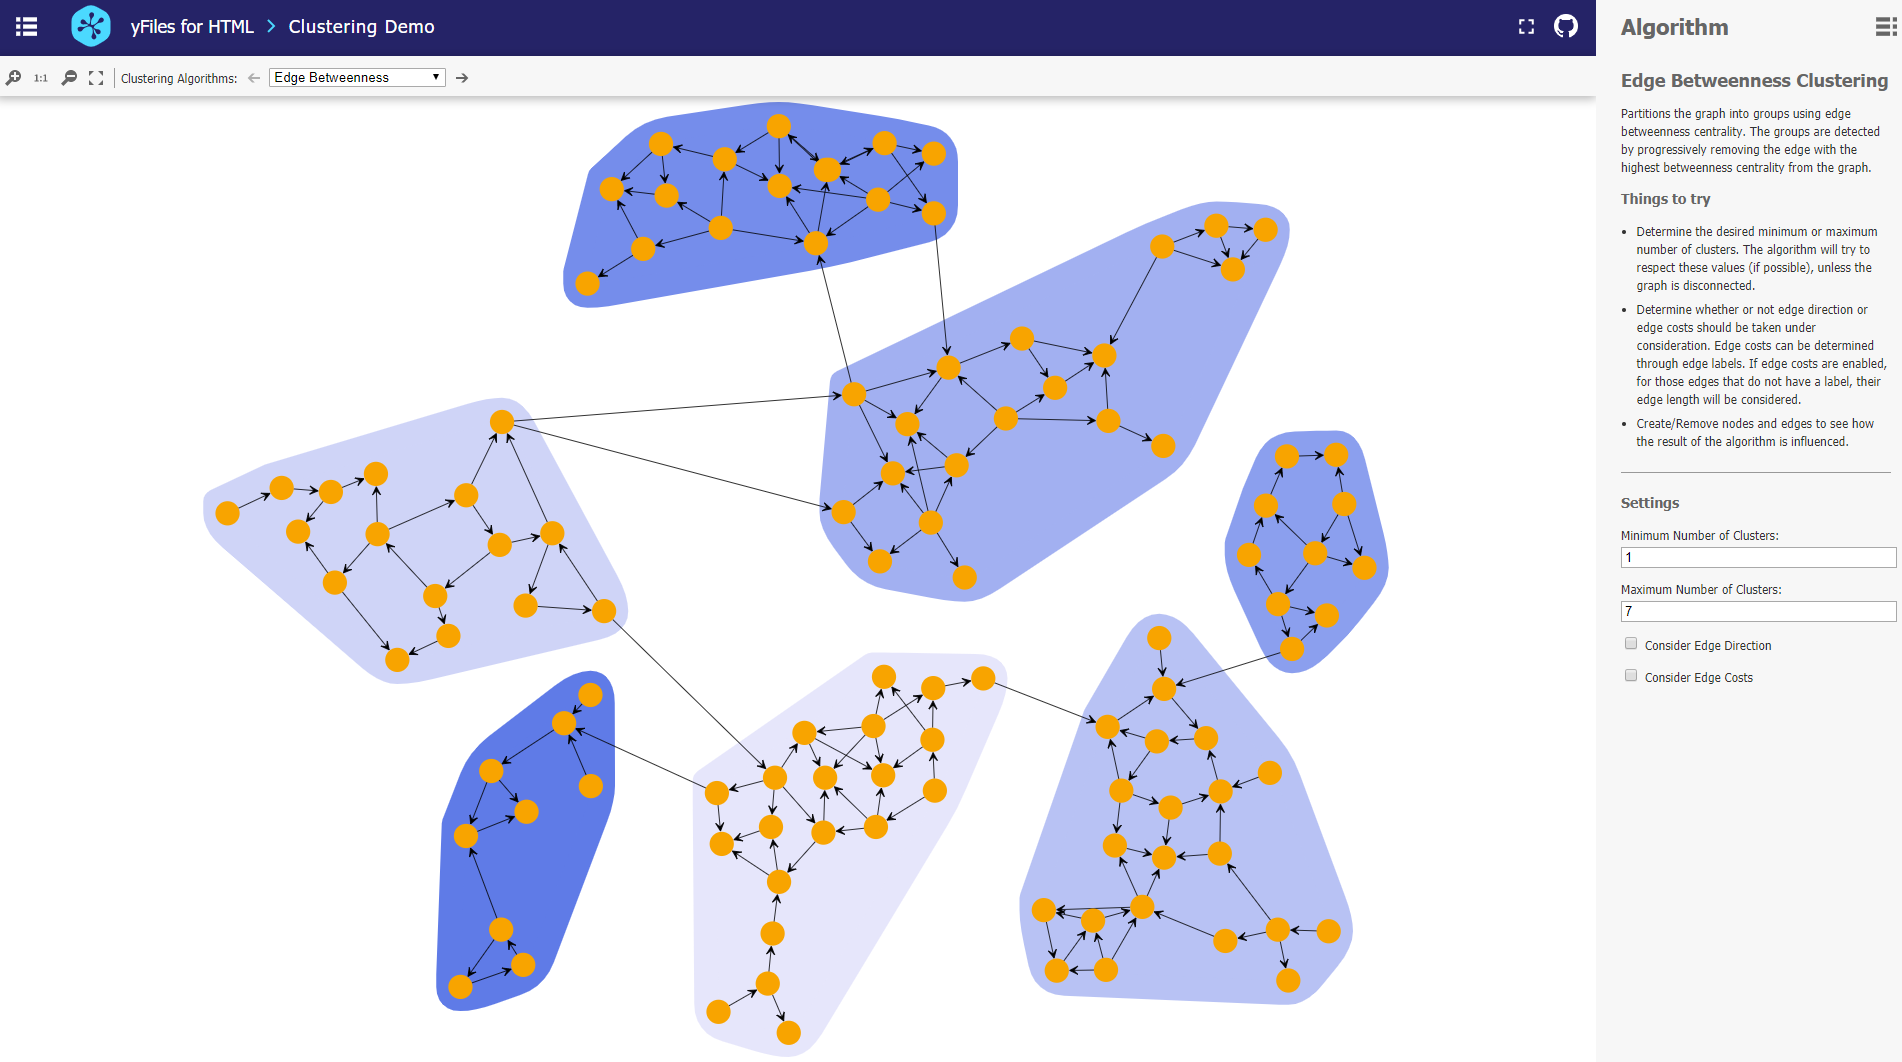
Edge Betweenness clustering detects clusters in a graph network by progressively removing the edge with the highest betweenness centrality from the graph. Betweenness centrality measures how often a node/edge lies on the shortest path between each pair of nodes in the diagram. The method stops when there are no more edges to remove or if the algorithm has reached the requested maximum number of clusters. The resulting clustering is one that achieved the best quality during the process.
Biconnected Components Clustering
Biconnected components clustering detects clusters by analyzing the biconnected components of the graph. A biconnected component is a connected component with the property that the removal of any node keeps the component connected. Nodes of the same biconnected component form a cluster. If a node belongs to multiple biconnected components, the algorithm only assigns it to one of these clusters.
Clustering Based on Location
yFiles also offers two clustering algorithms that determine the clusters based on the current positions of the nodes.
k-Means Clustering
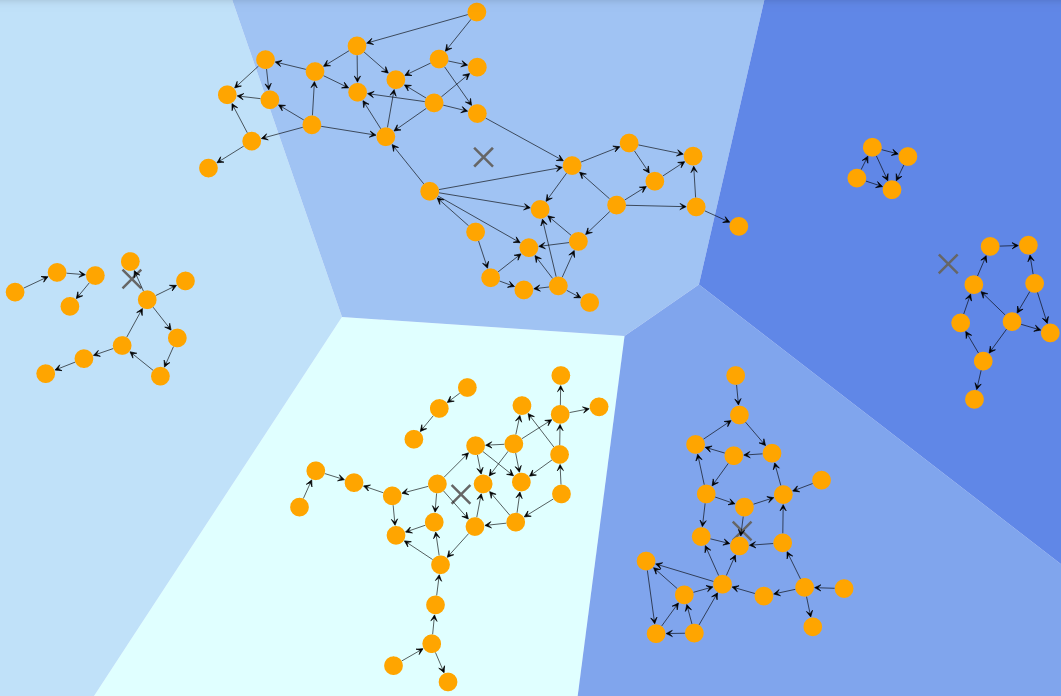
k-Means clustering algorithm partitions the graph into k clusters based on the location of the nodes such that their distance from the cluster’s mean (centroid) is minimum. The distance is defined using various metrics as euclidean distance, euclidean-squared distance, manhattan distance, or Chebyshev distance.
Users can also implement a Voronoi diagram to visualize the result of this algorithm. A Voronoi diagram is a partitioning of the plane that contains n points (called sites or generators) into convex polygon regions such that each such region contains exactly one of these points, and each point of the polygon is closer to the generator point that from any other point.
Hierarchic Clustering
Hierarchic clustering partitions the graph into a hierarchy of clusters. There exist two different strategies for hierarchical clustering, namely the agglomerative and the divisive. The agglomerative strategy applies a bottom-up approach according to which, in the beginning, each node defines a separate cluster. At each step, the algorithm merges pairs of clusters while moving up the hierarchy. The algorithm continues until all nodes belong to the same cluster. On the contrary, based on the divisive strategy, in the beginning, all nodes are grouped into one cluster. At each step, the algorithm splits the largest cluster while moving down to the hierarchy.
In both approaches, the dissimilarity between clusters is determined based on the given linkage criterion and an appropriate distance metric as euclidean distance, euclidean-squared distance, manhattan distance, or Chebyshev distance. The result is a dendrogram which can be cut based on a given cut-off value.
Example and Source Code
The clustering algorithms are part of yFiles on all platforms. yFiles for HTML comes with a Graph Clustering Sample Application. This application allows the user to experiment with different clustering algorithms and explore their configuration. Users can explore sample graphs or create their own.
The source code of the Graph Clustering Sample Application is available on the yWorks GitHub repository and part of the yFiles for HTML package.
yFiles Clustering Algorithms in Your Own Application
Test the yFiles clustering algorithms with a fully-functional trial package of yFiles. The clustering algorithms work on the standard yFiles graph model and can be used in any yFiles-based project. Calculating a clustering is done like running other yFiles graph analysis algorithms and requires only a few lines of code.
