Collapsing Groups in Diagrams
Interactively collapsing and expanding groups makes diagrams more accessible but incremental layouting is essential
When visualizing a large set of data, it is a common problem to keep the data readable and easy to comprehend. Bigger diagrams often suffer from higher complexity, which generally makes them hard to grasp. When dealing with big data sets, most of the time, only a small part of the diagram is of interest.
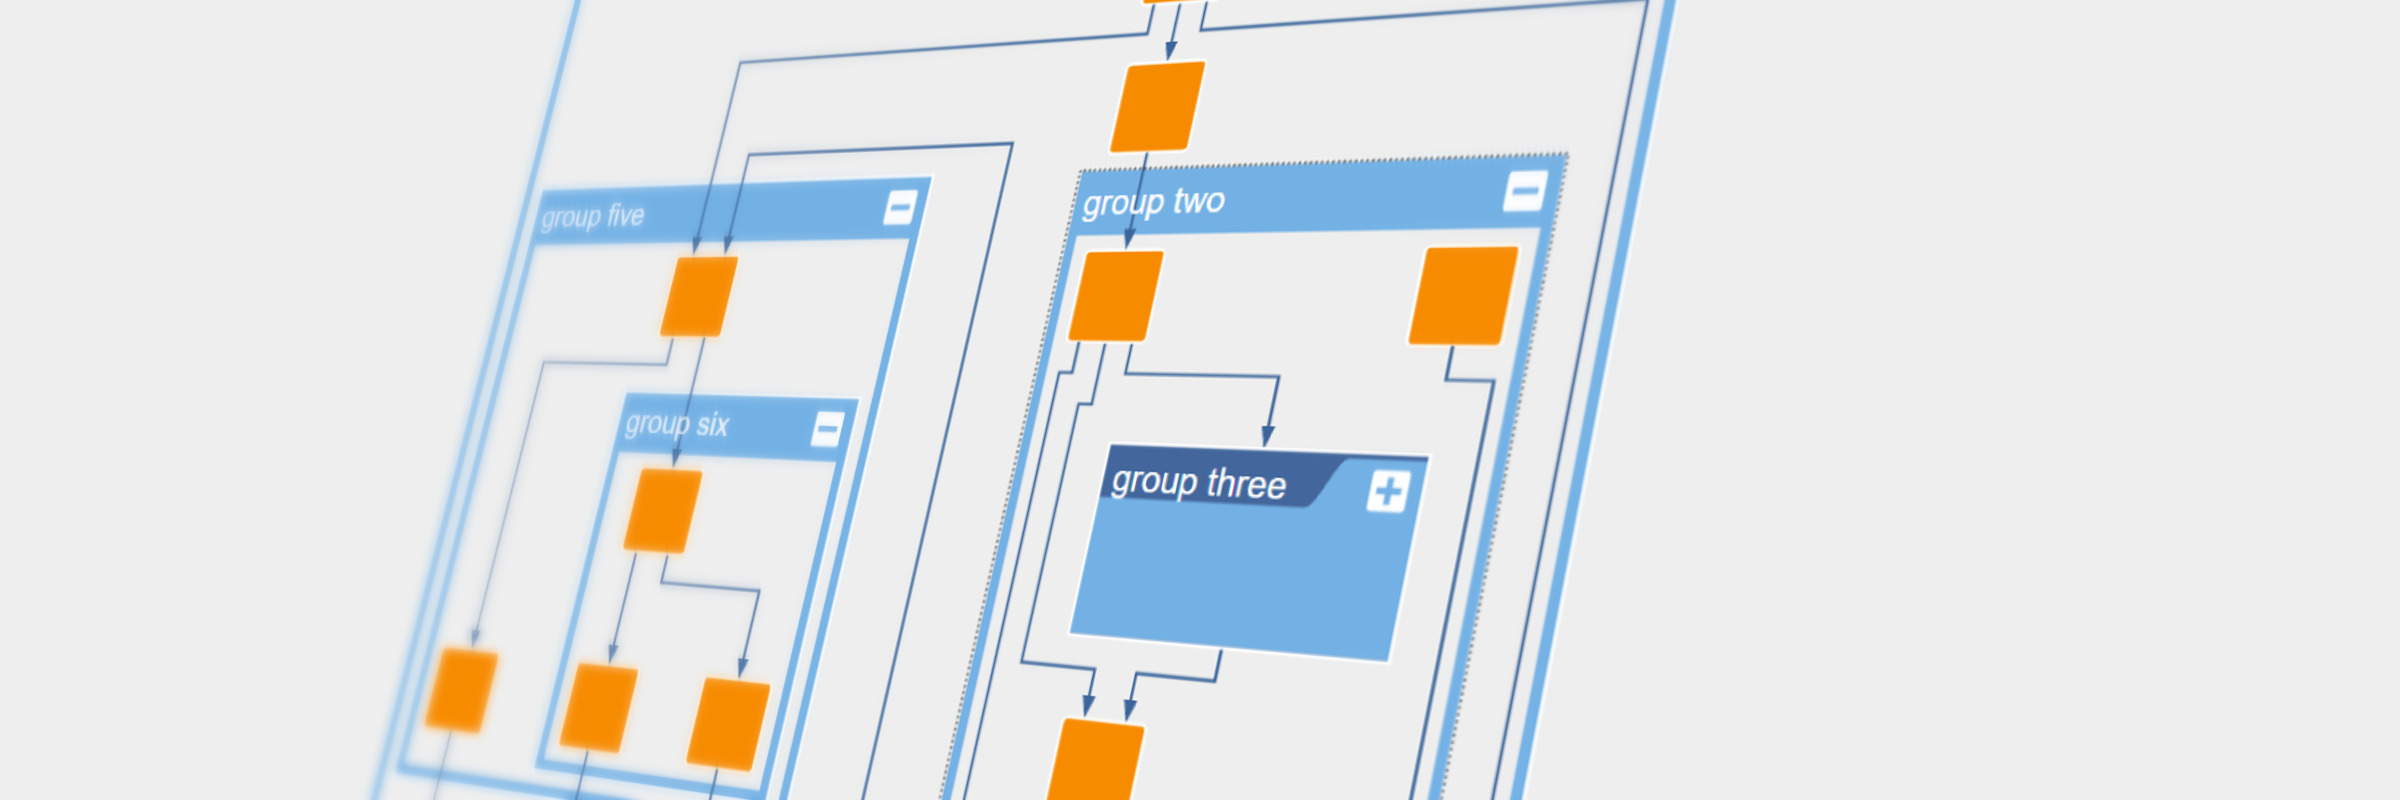
One widely used technique is to hide parts of the data and show them only on demand. This so-called drill-down approach reduces the diagram to the relevant elements and removes unnecessary visual clutter.
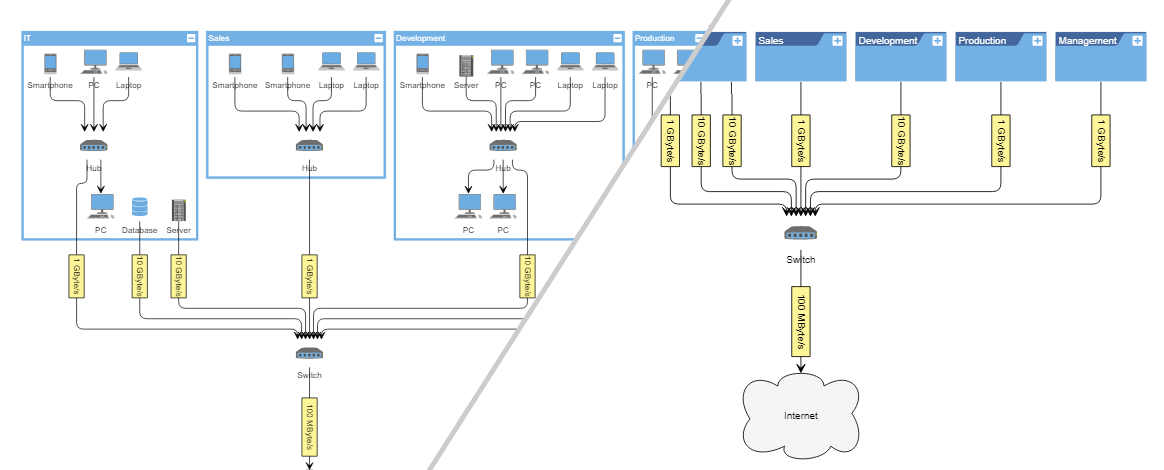
For grouped data, it is obvious to represent groups as single entities and expand them (i.e., show their contents) while exploring the graph. This powerful technique can be applied to navigate massive data sets. Starting from specific entities, the user can explore the data step-by-step by expanding the groups — or reduce complexity by closing them.
Challenges of the Drill-down Approach
The drill-down approach helps the viewer concentrate only on a specific group structure of a diagram. However, some guidelines have to be followed to avoid disturbing the user’s mental map when group elements expand or collapse. More precisely, these operations should only affect the particular area of the diagram to which the expanded or collapsed groups belong. The remaining diagram should be modified as little as possible. In the expand case, the layout algorithm that determines the positions of the graph elements should ensure that it only provides the required space. In the collapse case, it should eliminate the free space caused by a collapse operation without altering the positions of the remaining elements.
However, designing algorithms for the drill-down approach is not trivial. Complete diagram solutions can help with that. yFiles is a commercial diagramming library that provides all the necessary tools to develop applications that can create, visualize, and automatically arrange the elements of a diagram. It has built-in support for grouping and merging of elements, and it fully supports collapsing and expanding of graph elements. In particular, for grouped graph structures, it provides automatic layout algorithms for arranging the graph elements while it also allows the insertion of new elements into an existing diagram without re-arranging the remaining parts of the diagram.
Explore a Diagram Using the Drill-down Approach
The video below demonstrates how one of yFiles’s layout algorithm arranges the newly expanded groups to fit in an existing diagram. Note that the arrangement is stable after the subsequent opening and closing of the groups. Finally, the groups are expanded and collapsed in a way that the expand button stays under the cursor.
In yFiles, a layout algorithm that inserts new elements into an existing diagram without re-arranging its existing elements is called incremental.
Example and Source Code
yFiles comes with a Hierarchic Grouping Sample Application.
This example shows the interactive collapsing and expanding of groups of a graph.
A collapsed group hides its contents and will most likely be smaller. An expanded group shows its content.
Clicking on the +/- button of a group expands it or collapses it again.
The source code of the Hierarchic Grouping Sample Application is part of all yFiles packages and available on the yWorks GitHub repository:
Collapse and Expand Groups in Your Own Application
Test the yFiles diagramming library with a fully-functional trial package. To add interactive collapsing and expanding of groups to your application, start with the Hierarchic Grouping Sample Application that is part of the yFiles package. It’s not only a showcase application but also provides best-practice source code that you can re-use in your project.
-
Download the trial version of yFiles for your target platform at the yWorks Customer Center.
-
Navigate to the source directory of the Hierarchic Grouping Sample Application.
-
Copy the source code of the collapse and expand feature to your project.
-
Fine-tune it to your requirements, for example, by using different settings for the automatic layout.

