Compacting a Diagram
How to make sure that free space is used after removing, moving or resizing elements in a diagram without changing the big picture.
Compact diagrams are a very common requirement for applications that visualize diagrams and graphs. A compact diagram layout requires less space on screen or paper and makes it easier to grasp the data.
The layout of a diagram is either created manually by users, determined by input data or generated by an automatic layout algorithm (or a mixture of these options). Interactive applications often allow the user to further amend the diagram such that space becomes unused. Regardless of whether the diagram was manually arranged or by using an algorithm, the user most likely wants that the overall picture - the mental map - of the diagram is preserved while making it more compact.
Keeping the Diagram Compact
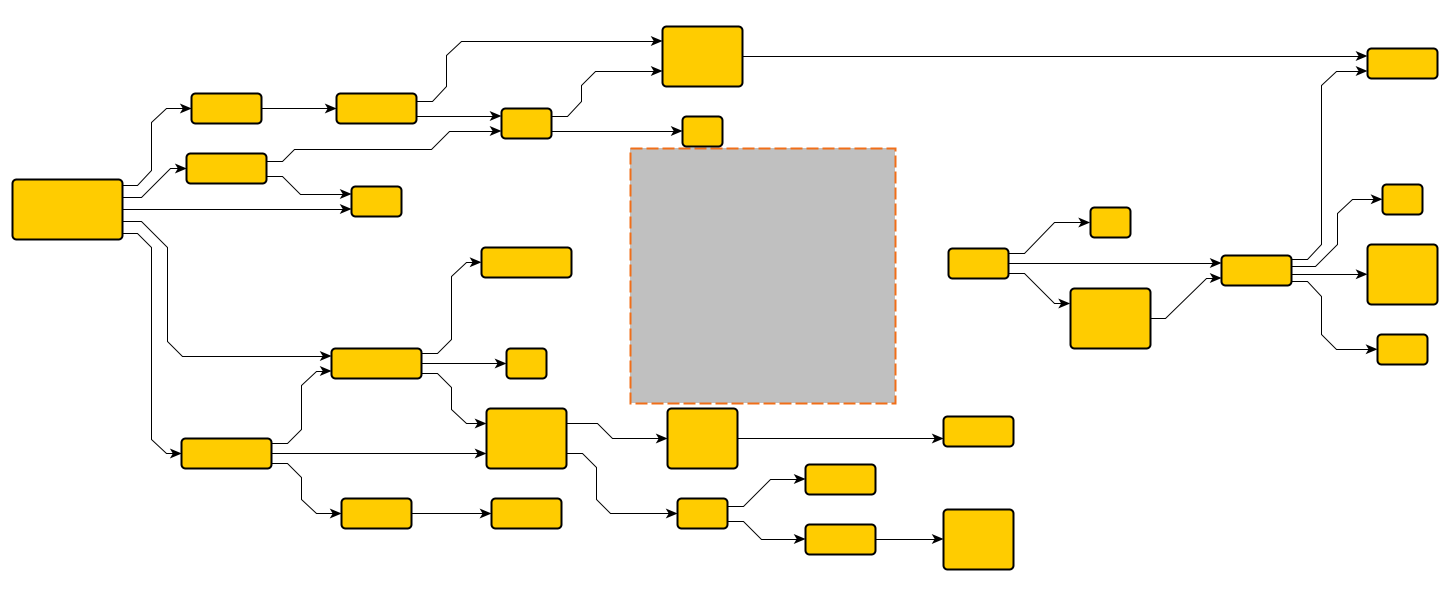
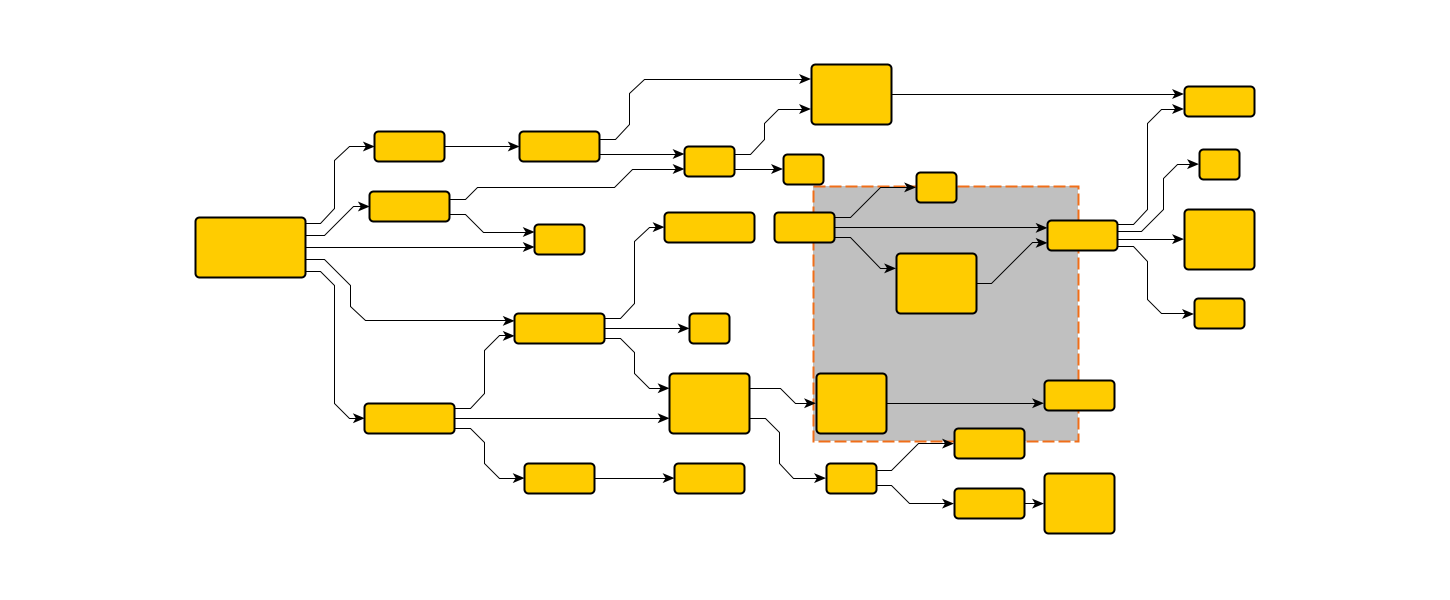
Interacting with a diagram, users may remove elements (e.g. nodes, labels), resize them to a smaller size or move them somewhere else. That results in unused space. A reasonable solution is to apply an automatic layout algorithm that re-arranges everything. In case a whole new view for the data is feasible, this is a good solution.
However, when the existing picture should remain stable while still using the empty space, it is desirable that the nearby elements are moved towards each other to fill up the empty space. The movement may be propagated to more distant items but should not destroy the overall look of the diagram. This is especially the case when users manually arranged the elements so that no automatic layout algorithm is able to reproduce that type of arrangement.
Filling-up Space Using yFiles
The yFiles diagramming library offers a sophisticated solution when it comes to making more effective use of free space in an existing diagram. It offers the Fill Area Layout algorithm which takes a certain area as input and tries to compact the layout around that region. A number of settings allow to configure the algorithm for different use cases: for example, certain graph elements can be fixed so that they may not be moved by the compaction. It is also possible to define sets of elements that must be kept together (so-called components). These features and its optimized performance make it a perfect fit for interactive application scenarios!
Examples and Source Code
The Fill Area Layout Demo shows how to fill-up space that becomes available after deleting elements from a diagram.
The source code of the example application is part of the yFiles for HTML package and available on the yWorks GitHub repository.
Compact Graph Layouts
Besides the generic solution for making a diagram more compact, yFiles offers layout algorithms that can be configured to produce compact drawings in the first place. For example, almost all algorithms come with a variety of distance and spacing settings that allow that items are moved closer to each other.
For organization charts, yFiles can generate beautiful and highly compact arrangements out of the box. Convince yourself and have a look at the Interactive Organization Chart Demo that demonstrates how an organization chart is created and arranged automatically.
Another noteworthy, powerful feature are the bus structures of the Hierarchical Layout. They are especially suitable if items with a very high number of connections exist. Check out the Hierarchic Bus Structures Demo that shows the feature in action.


