Data Binding for Diagramming Applications
Easily create rich diagram visualizations of your business data through template data binding
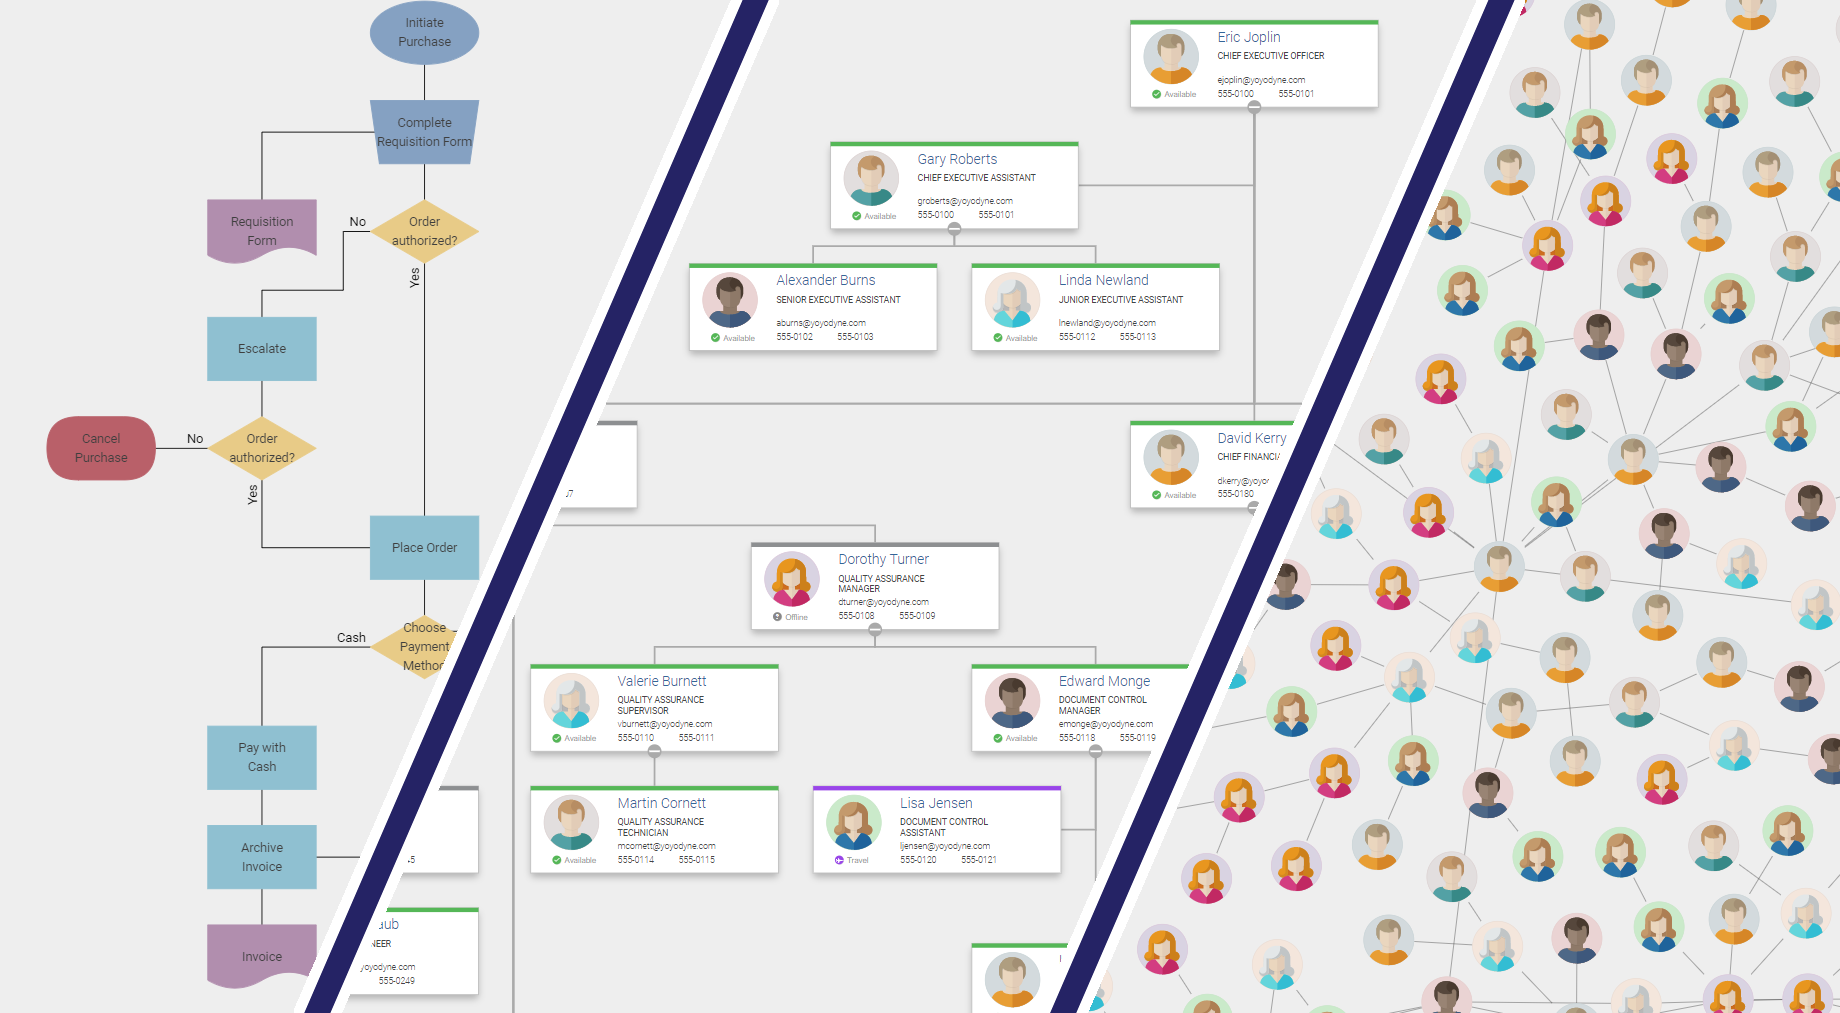
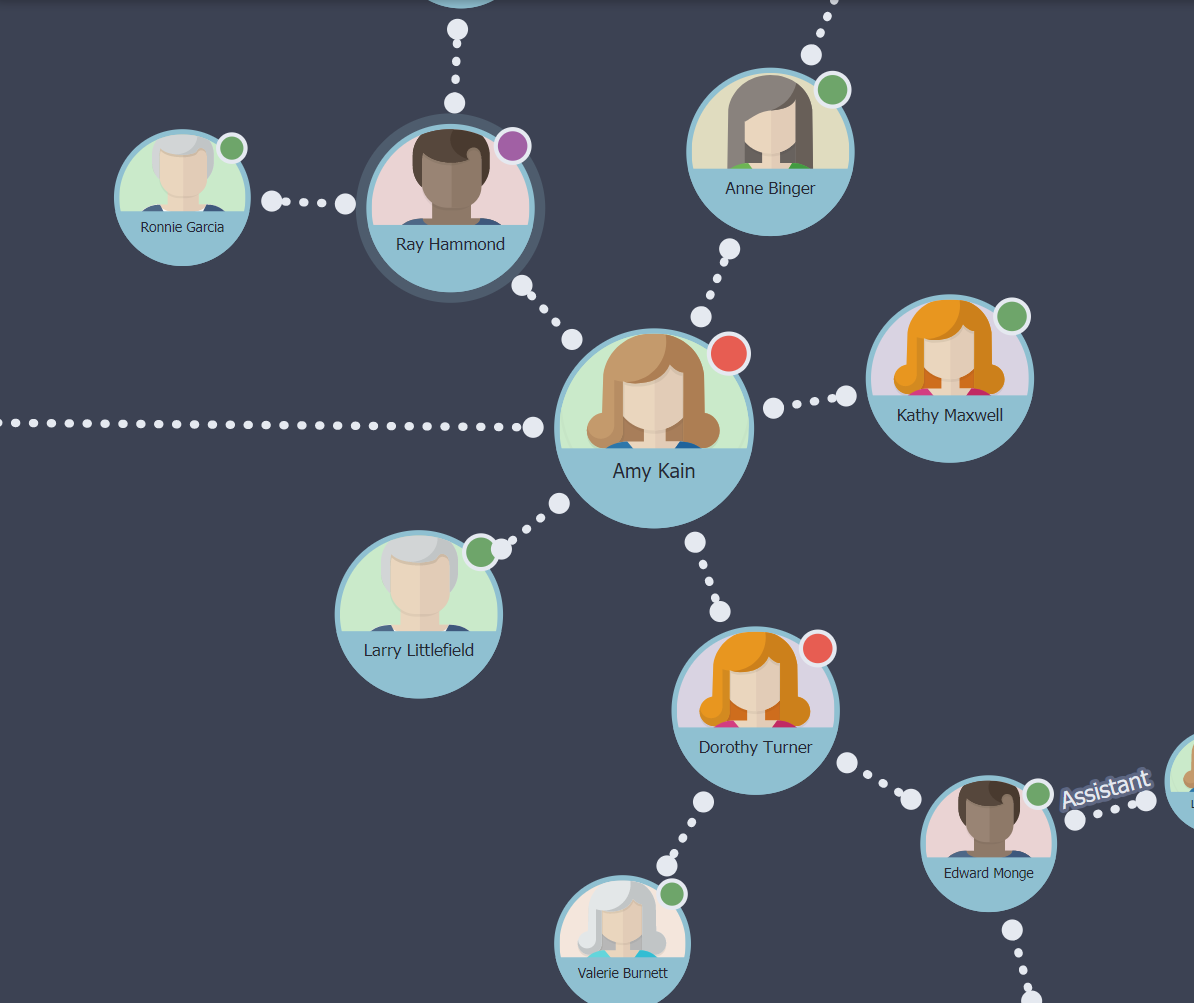
There are a lot of tools out there that visualize connected data as diagrams. Some even come with advanced features like automatic item arrangement and editing capabilities. Such tools make it possible to present connected data in a concise, human-readable form to carve out structures and characteristics that are not obvious by looking at data tables. Examples of diagram visualizations include flowcharts, organization charts, network structures, and many more.
Using Business Data in Visualizations
While sets of connected data necessarily consist of entities and connections that determine the structure of the corresponding diagram, the sets usually contain item-specific data in addition to relational information. This additional data can be used to enrich the diagram visualization with text or visual clues that enable the reader to get more information from the drawing, without any further interaction.
For example, in an organization chart, each entity usually possesses personal information, like name, position, email, and phone number, a profile picture, and maybe something like an availability status. In an interactive application, an additional information box can be displayed when a person is selected. However, this requires interaction from the user, and only one person can be viewed at a time.
A better solution is to display the information directly in the item visualization itself. This course of action has the advantage that all the detailed information can be grasped immediately, without losing the overview of the overall diagram structure.
Data Binding Adds Values to Diagrams
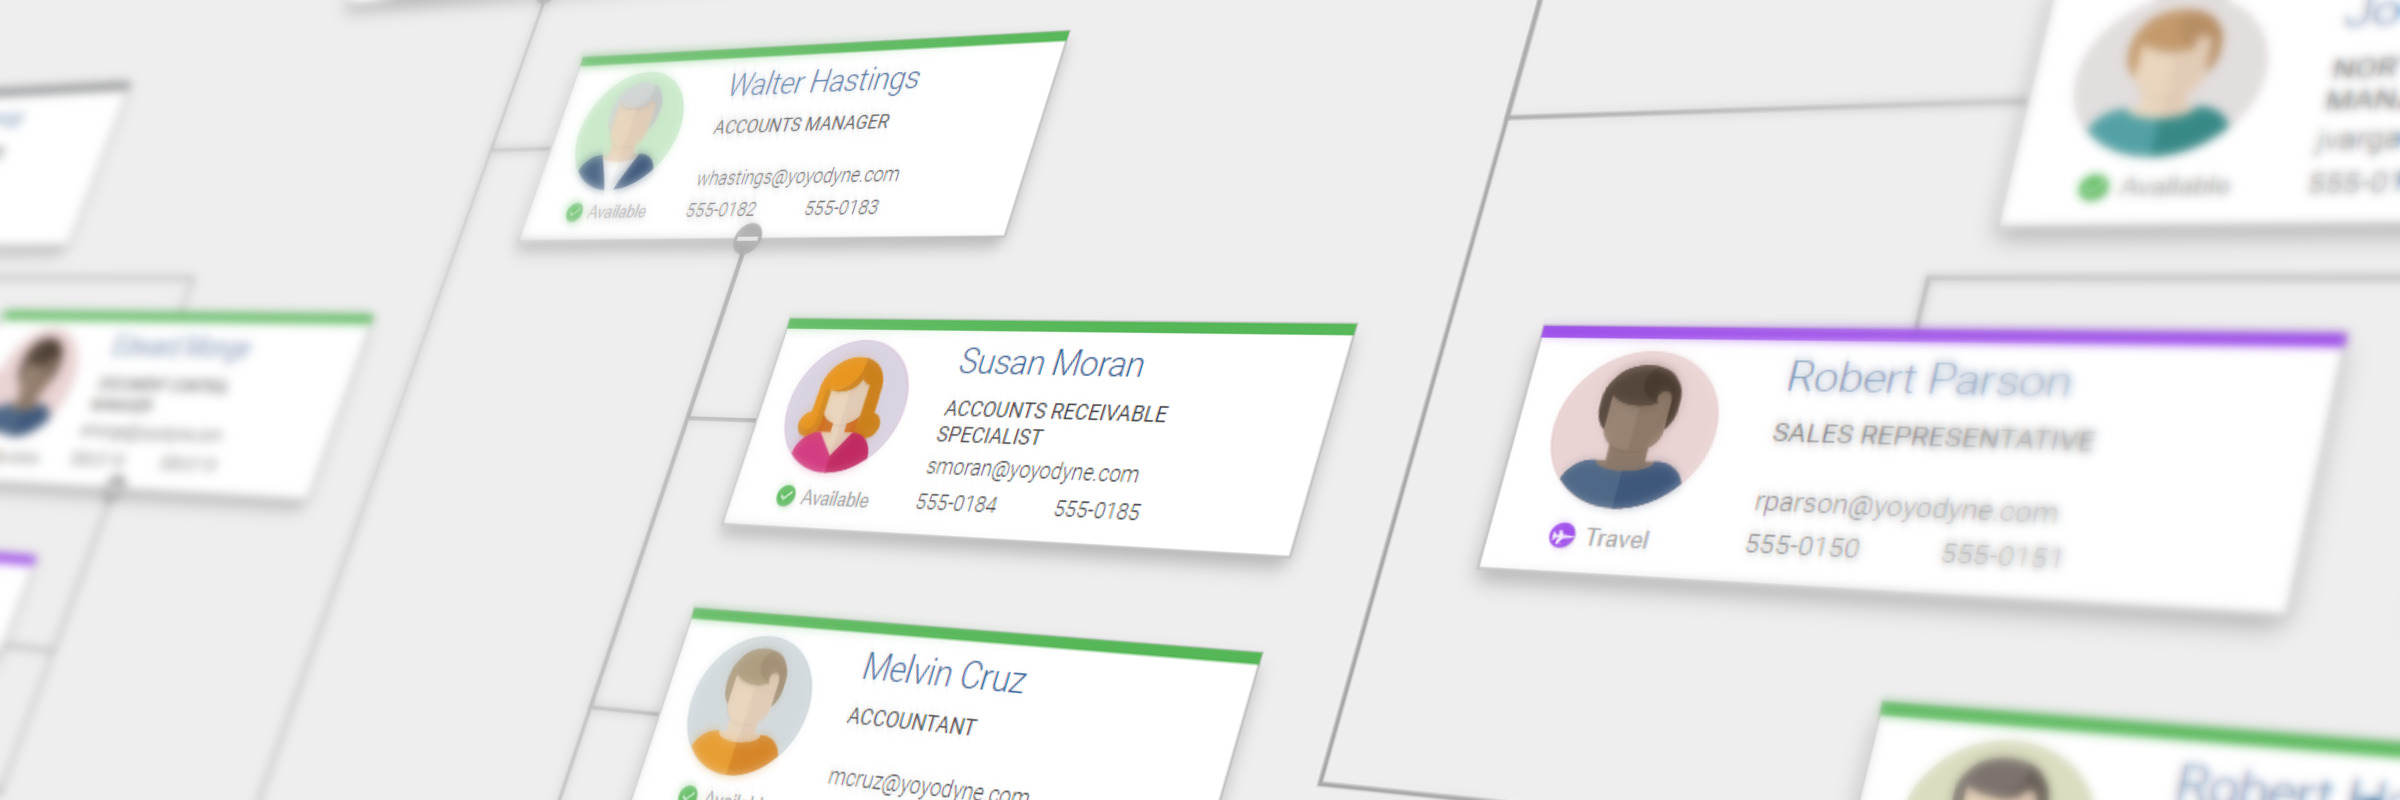
A templating mechanism that supports data binding enables the creator of a diagram to define templates for item visualization easily. Data Binding magically binds visual elements of the template to the underlying data item, all without writing any code. Usually, a template is defined in a markup language, like SVG, HTML, XAML, etc. Templating enables designers to create visualizations in their favorite WYSIWYG design tool, without the need to dive into the technical depths of coding.
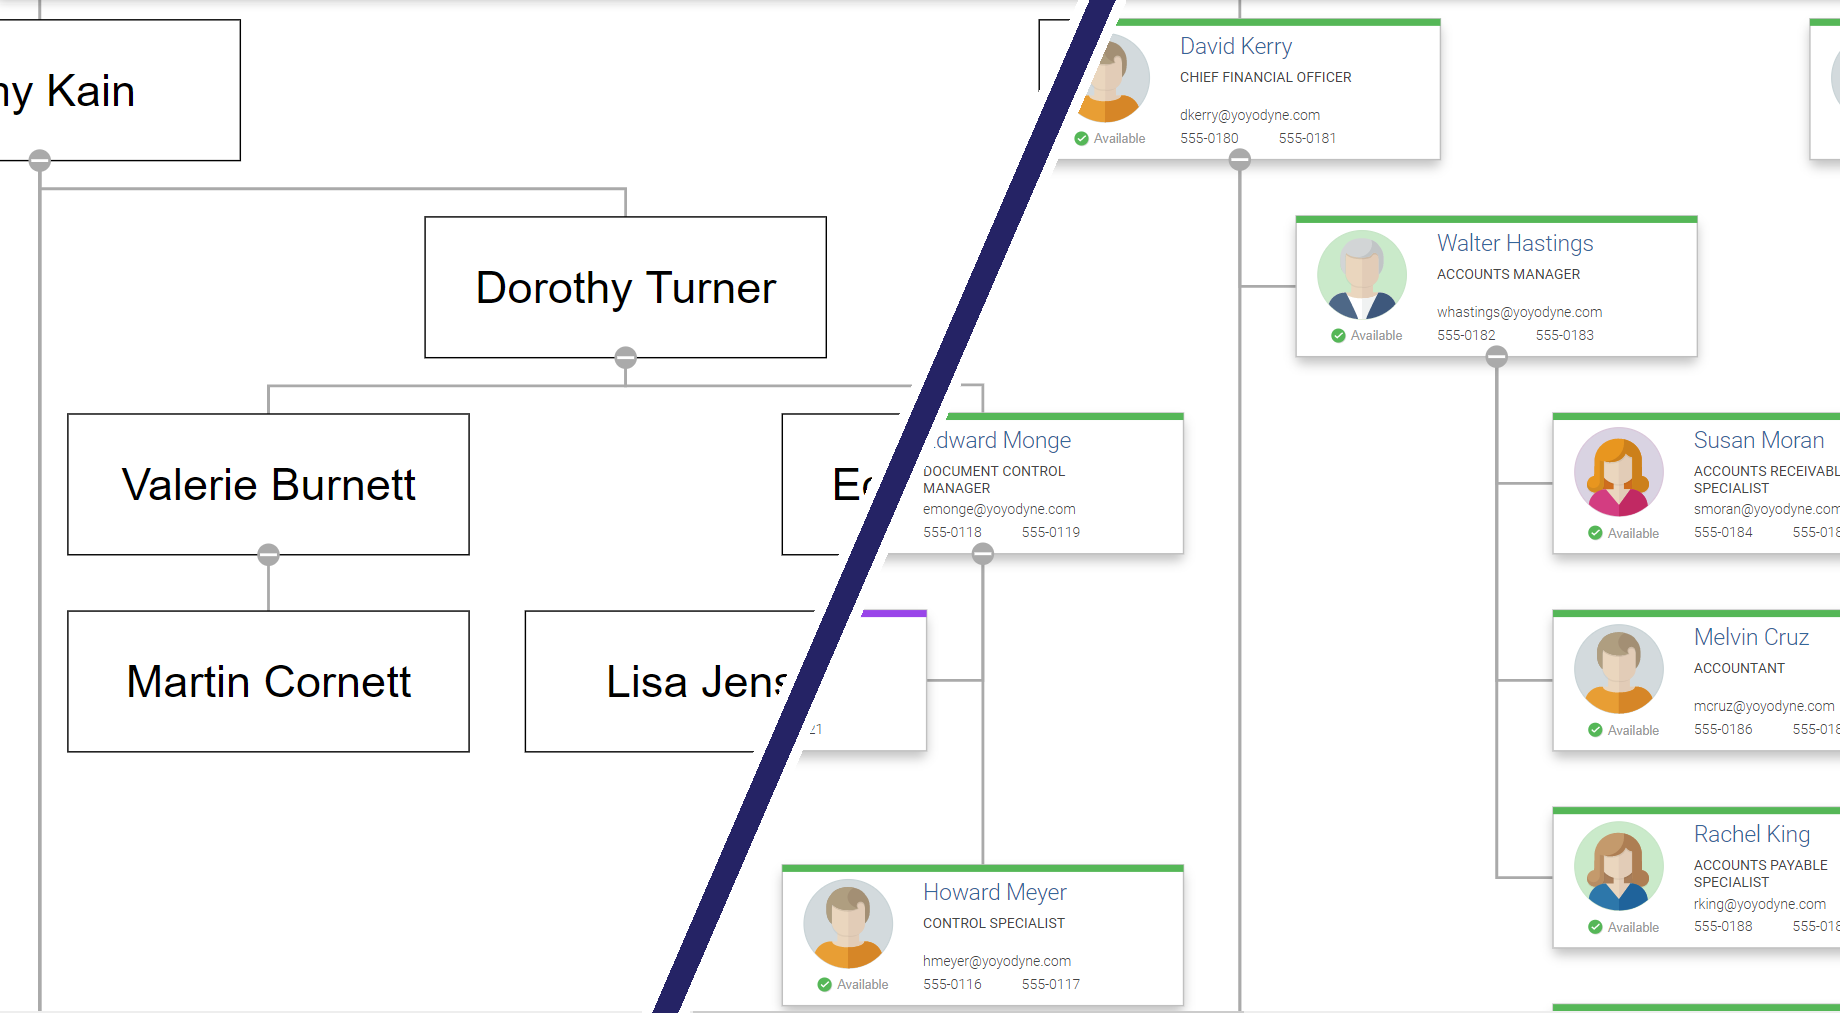
In the example above, all nodes use the same template.
The only difference is the data that is attached to each node. The template defines the general appearance for nodes and contains data binding expressions that are resolved automatically by the templating engine using the corresponding item data. The result is a diagram where all nodes have the same look, but each one showing its very own data. The data binding can be dynamic. For example, when a person’s availability status changes, the color bar on the top and the status under the profile picture will immediately reflect the new value.
Auto-Converting Data
Pure data binding is sufficient if the bound value can be displayed directly. In the example above, the text displaying the person’s name is bound directly to a corresponding name property. In many cases, though, the values in the data cannot be used directly. For example, while the color bar on the top reflects the person’s status, the corresponding data property will usually have text values like present and away. Consequently, the text has to be mapped or converted to a color value in some way.
A small piece of code called a converter usually performs the actual mapping process. For the above example, the pseudo code for such a converter looks like this:
function convert(value) {
  if (value == 'present') return 'green'
  else if (value == 'travel') return 'violet'
  else if (value == 'busy') return 'red'
  return 'gray'
}
This approach lets developers and designers create complex bindings that map the values of one or more data properties to visual characteristics like color, position, size, text content, source image, etc.
Creating Item Templates
yFiles is a commercial diagramming library that supports a vast set of features, like automatic diagram arrangement, interactivity, and sophisticated, customizable visualizations. yFiles is available for different technologies, e.g., JavaScript, WPF, and JavaFX. All of these platforms support templating by some means or other: XAML in the case of WPF, SVG and Vue.js for JavaScript, and FXML for JavaFX. Programmers familiar with the technology usually have experience in creating templates in these markup languages. All of the mentioned languages support data binding, as well.
SVG Templates With Data Binding
An elementary template without any data binding looks like this:
<g id="SimpleTemplate">
  <rect width="50" height="30" fill="white" stroke="blue"></rect>
  <text x="25" y="20" text-anchor="middle">Node</text>
</g>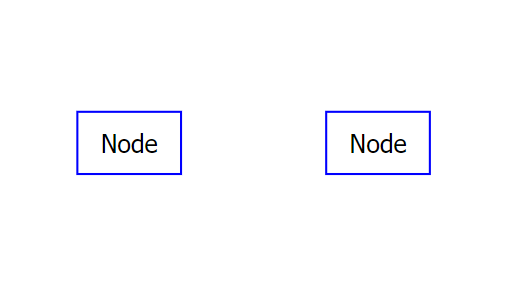
This template displays each node as a blue-bordered rectangle with text in the center.
Now, it is time for data binding to step in. Say, each node has an object attached that has a property name and a property color. For example, John and Melinda:
{
  "name": "John",
  "color": "teal"
}
{
"name": "Melinda",
"color": "red"
}With data binding, the template displays the name and shows the color from the node’s data.
<g id="SimpleTemplate">
  <rect width="50" height="30" fill="white" stroke="{Binding color}"></rect>
  <text x="25" y="20" text-anchor="middle" data-content="{Binding name}"></text>
</g>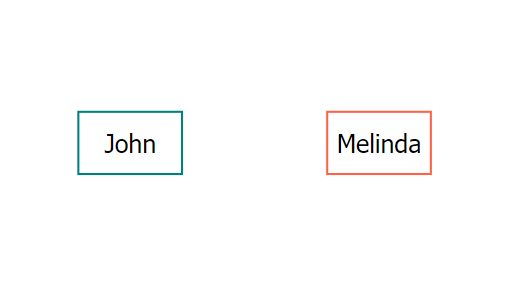
Templating is not limited to simple visualizations like in these examples. Instead, a graphic designer can create a complex visualization in a design tool, all without writing any code. Afterwards, a developer adds data binding to the designer’s template. Together, this creates a rich visualization that displays the diagram data in a pleasing and informative way, for example, like this:
Examples and Source Code
Depending on the target platform, yFiles comes with different source code examples that show templating with data binding. A noteworthy example that is available on all platforms is the Organization Chart Sample Application. Additionally, yFiles for HTML comes with a Template Styles Sample Application, a Vue.js Template Node Style Sample Application, and more.
The source code of the Organization Chart Sample Application is part of all yFiles packages and available on the yWorks GitHub repository:
Similarly, the source code of the other sample applications is part of the yFiles for HTML package and available on the yWorks GitHub repository, too.
