Diagram Visualization With JavaScript
Enrich your web app with sophisticated diagram visualizations
Reasoning over large and complex data sets is a challenging task. However, visualizing such data as diagrams can help understand its anatomy and the relationships between single data entries. This applies in particular if the data’s structure forms a graph or network. Such diagrams are usually part of an application that allows the user to navigate interactively and, if required, modify the underlying data.
While existing generic diagram editors might suffice for some cases, it is often necessary to create applications that are specialized for specific data sets and domains. Since the browser is a popular platform, such applications are frequently implemented in JavaScript and HTML.
Creating Web Applications for Graph Visualizations
Building web applications that are capable of drawing and interacting with graph data is a challenging task. Usually, this problem can be separated into several parts. A typical graph visualization application has to be capable of:
-
Loading the data and convert it into a suitable abstract graph model.
-
Arranging graph items such as nodes, edges, and labels, so the drawing looks clear and shows the data’s underlying structure. This process is called layout.
-
Drawing the graph items and apply a style to them.
-
Enabling user interaction so they can navigate and, if required, edit the graph.
It is possible to implement it using plain web technologies like JavaScript, SVG, or Canvas. While this might work for straightforward cases, visualizing complex graphs will soon become very time-consuming. However, using a dedicated graph visualization library can take much work off your hands.
yFiles for HTML is a commercial diagramming library. It provides all the tools necessary to develop applications that can visualize and automatically arrange graphs elements and allow users to navigate and edit them.
Creating Graph Applications Using yFiles for HTML
yFiles provides a rich graph model that helps to create, update, and delete graph elements like nodes, edges, or labels. A powerful API helps in querying structural information and perform more complex graph operations. Graph items can be combined in groups, and the graph can be filtered to view only parts of it.

yFiles also offers APIs that make creating and updating graphs from external data easy. Loading and saving diagrams from or to any (file) format or database, e.g., JSON, GraphML, or a Neo4j database, can be configured in a few simple steps.
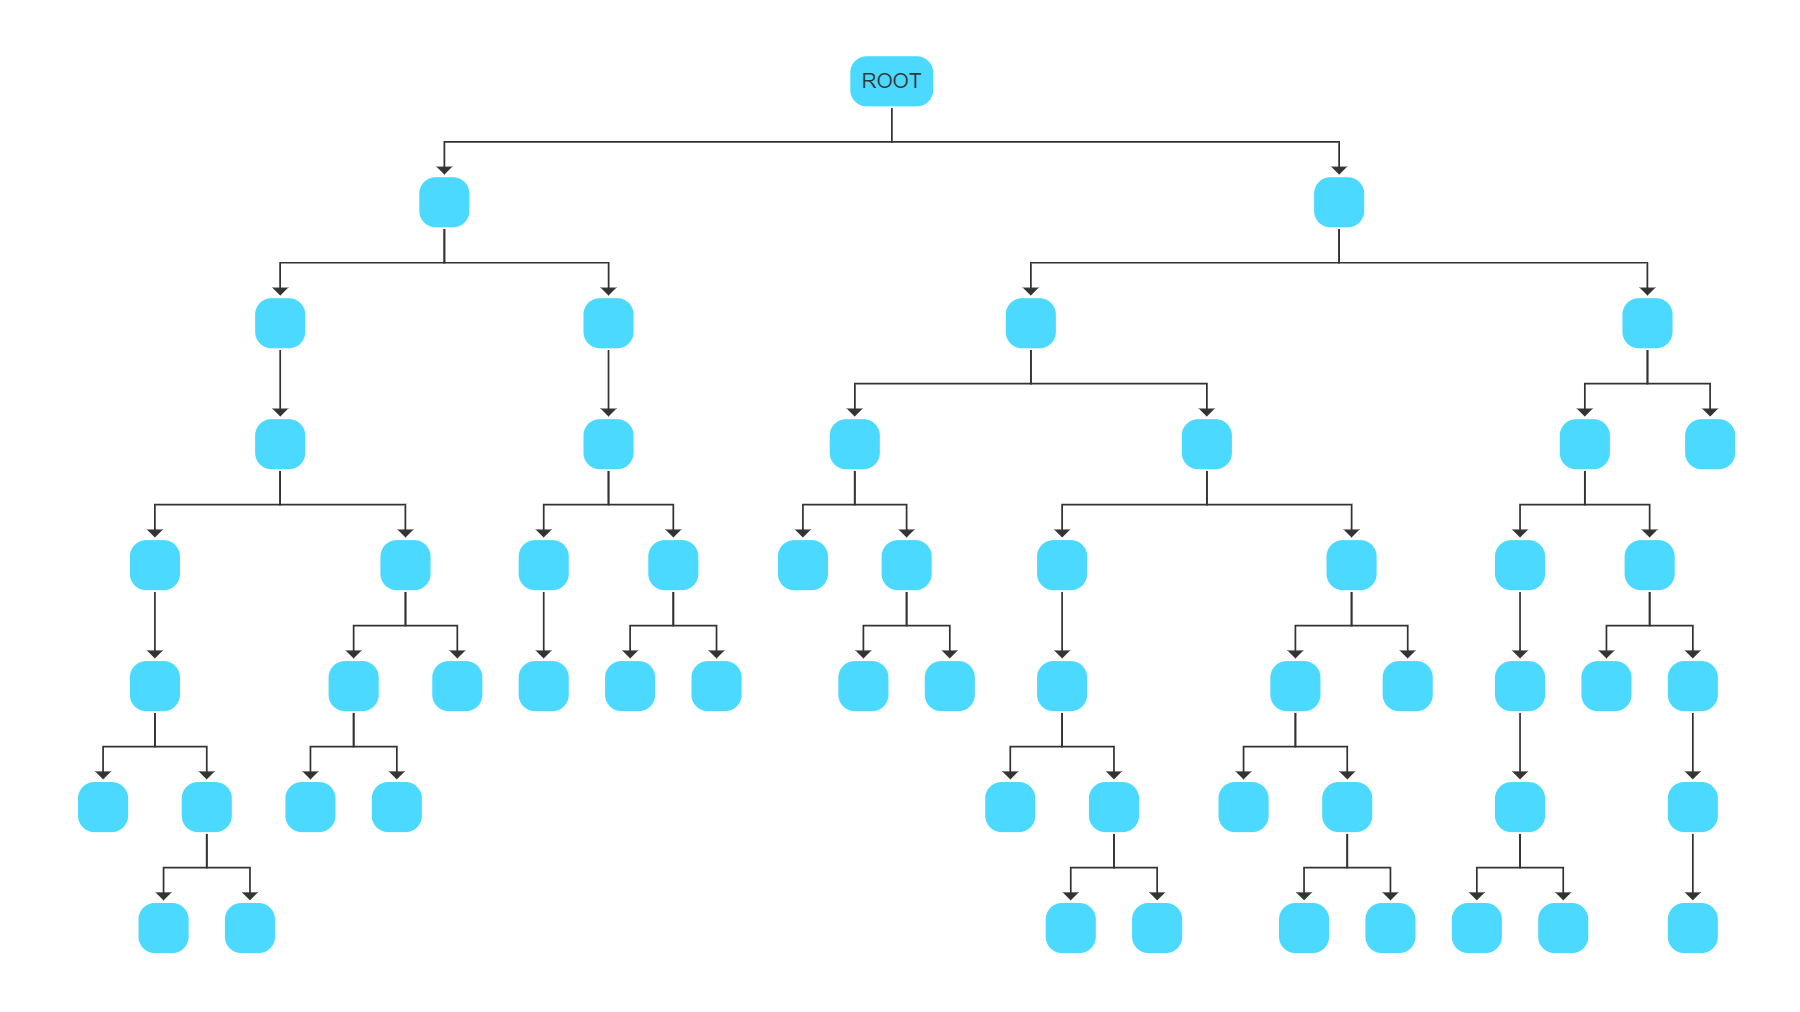
yFiles provides a broad set of unequaled diagram layout algorithms that automatically transform your graph into a neat and readable diagram. Different layout styles, together with rich configuration APIs, allow creating beautiful and lucid drawings for every type of diagram.
For the styling of diagram elements, you can either choose from a set of existing and configurable styles or create entirely custom styles. Use images, templates, and CSS to tailor the visualization to your use case.

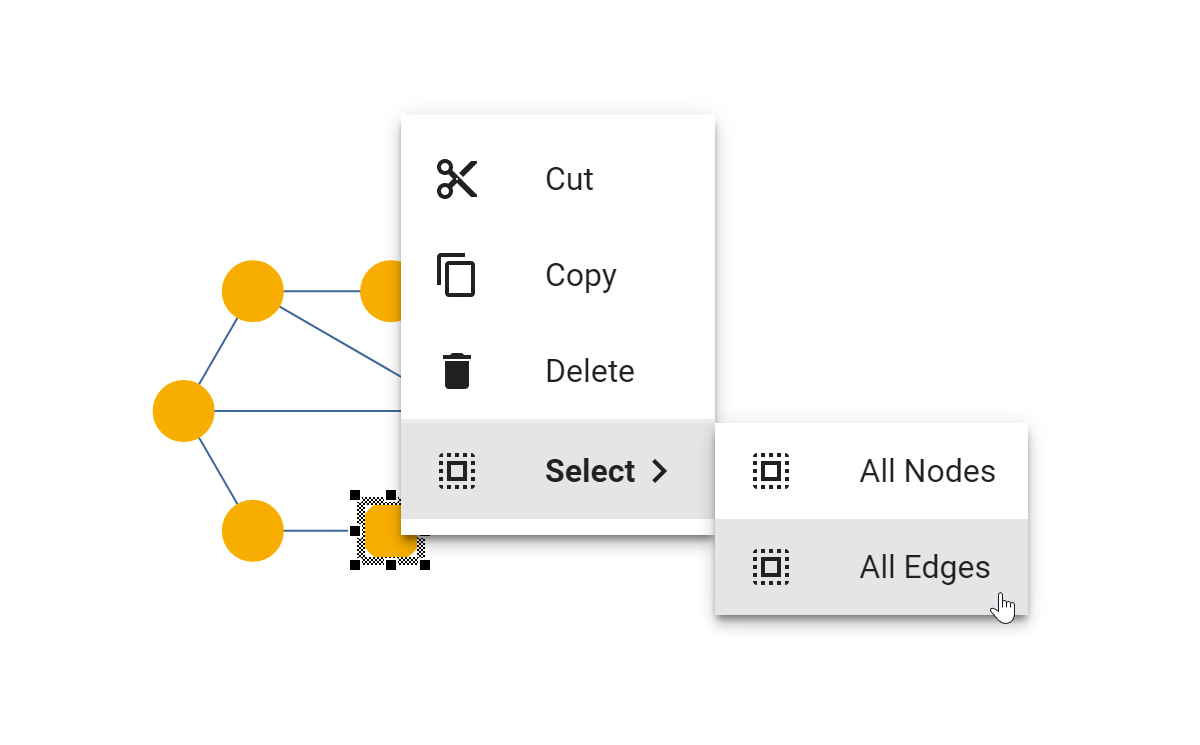
To allow the user to interact with the diagram, developers can leverage yFiles’ rich user interaction APIs. Features like zooming, panning, editing, dragging and dropping, undo and redo, context menus or copy and paste are already built-in and can be customized to fit any needs. yFiles supports user interaction via mouse, keyboard, and touch.
Extensive API documentation, an in-depth developer’s guide, outstanding IDE support, and lots of tutorials and source code examples make developing a diagram web application with yFiles for HTML a breeze.
