Drawing Orthogonal Diagrams
The different orthogonal graph drawing styles and for which diagram types they are best suited
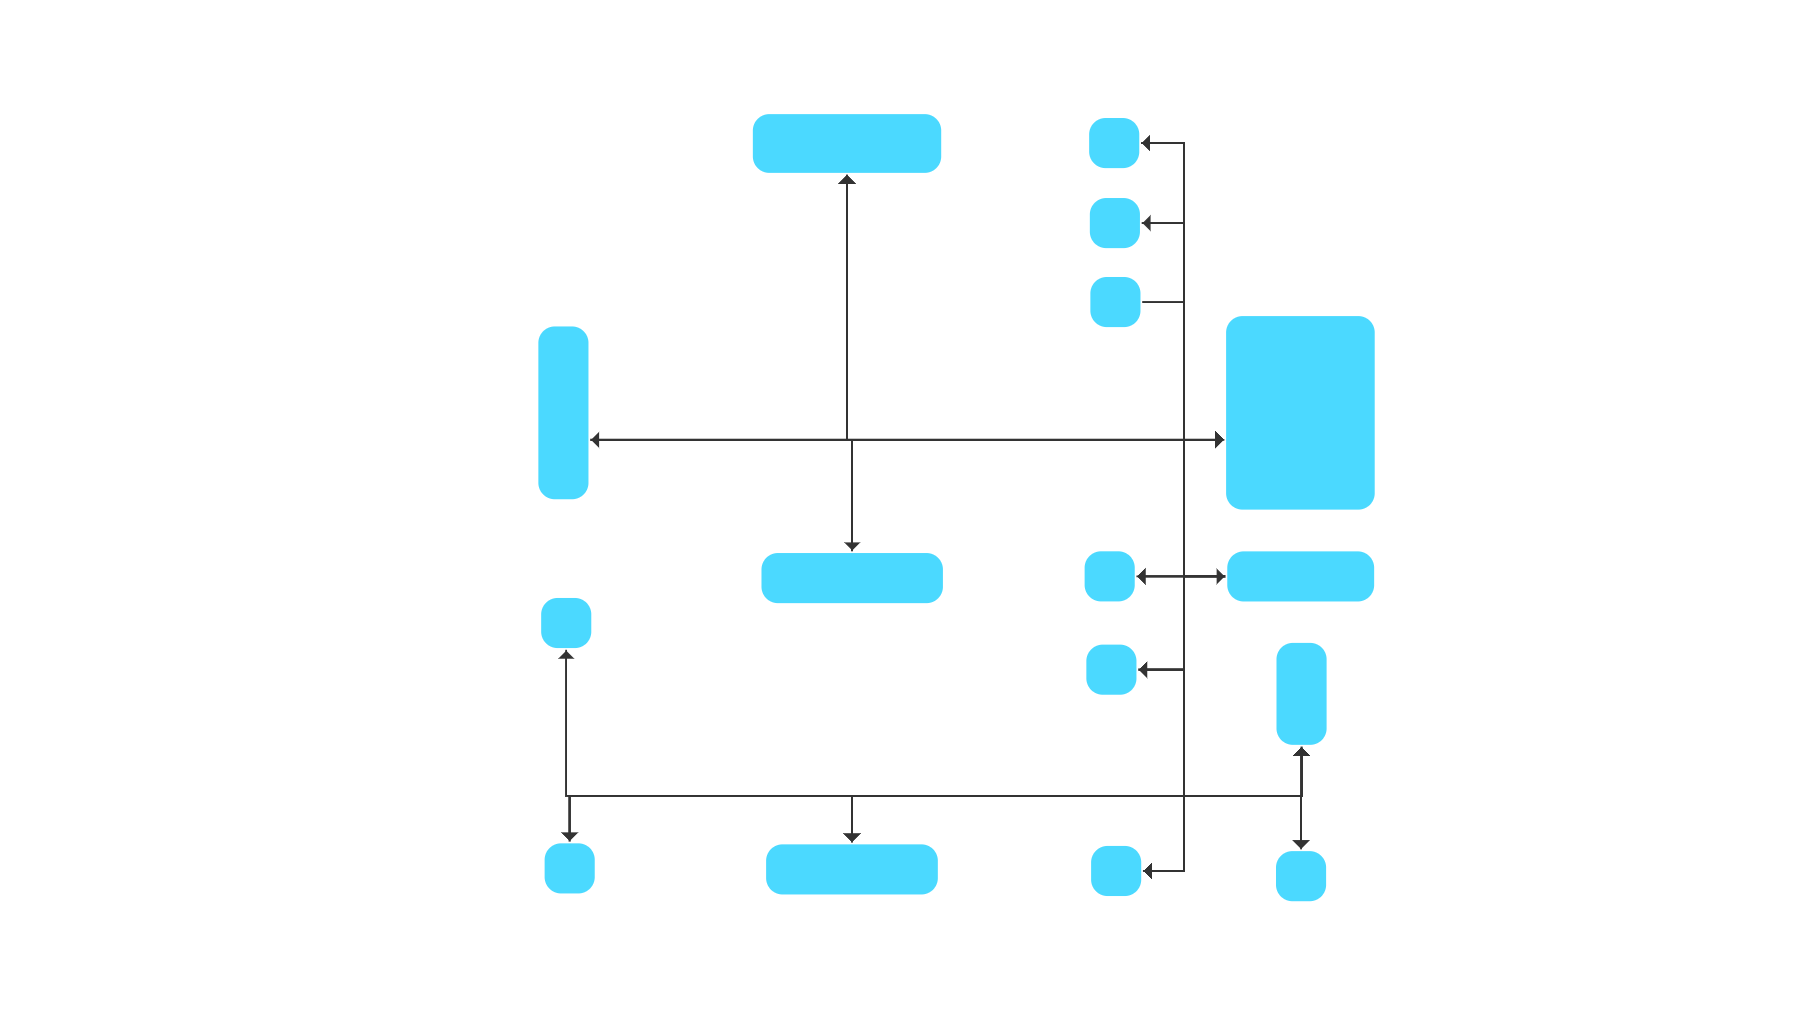
In orthogonal graph drawings, the routes of the edges (i.e., the links between the objects) consist of a sequence of alternating horizontal and vertical line segments. This routing style produces valuable representations of graphs and networks that help to gain insight into the relationships among the elements quickly.
Orthogonal drawings are very well suited for a wide range of application areas such as software engineering, database schema, system management, and knowledge representation.
Here, we describe several graph layout algorithms that produce orthogonal drawings. All of these algorithms are supported by yFiles, a commercial programming library designed explicitly for diagram visualization. The advanced layout algorithms of yFiles can comfortably transform the data in a readable, pleasing, and informative network.
Topology-Shape-Metrics Approach
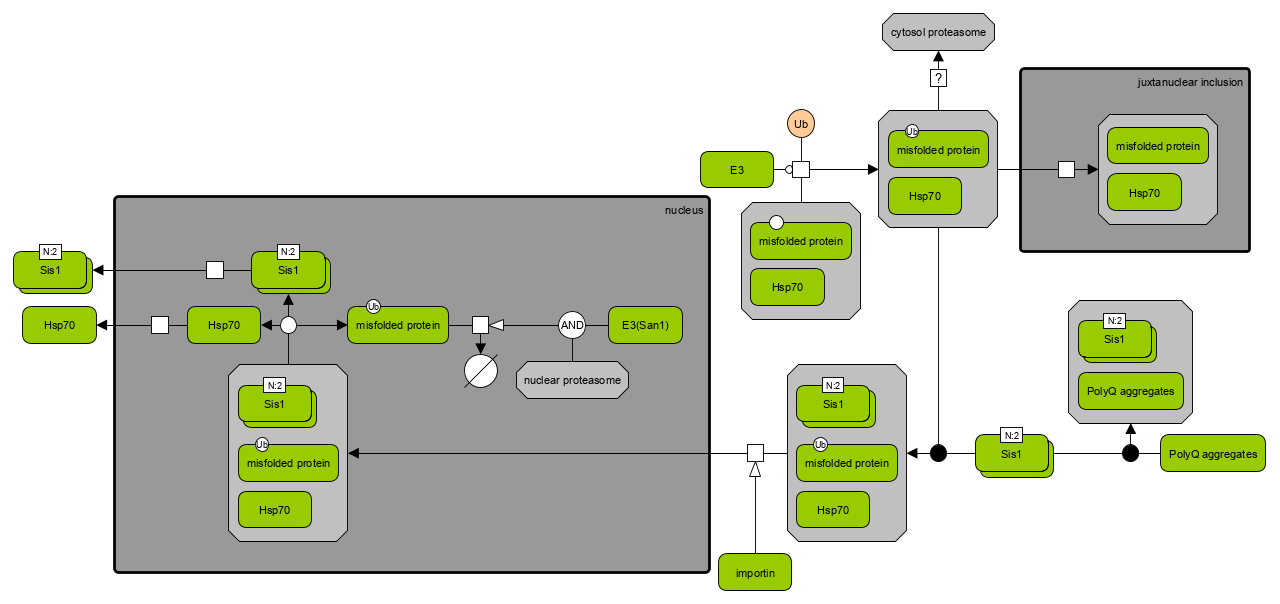
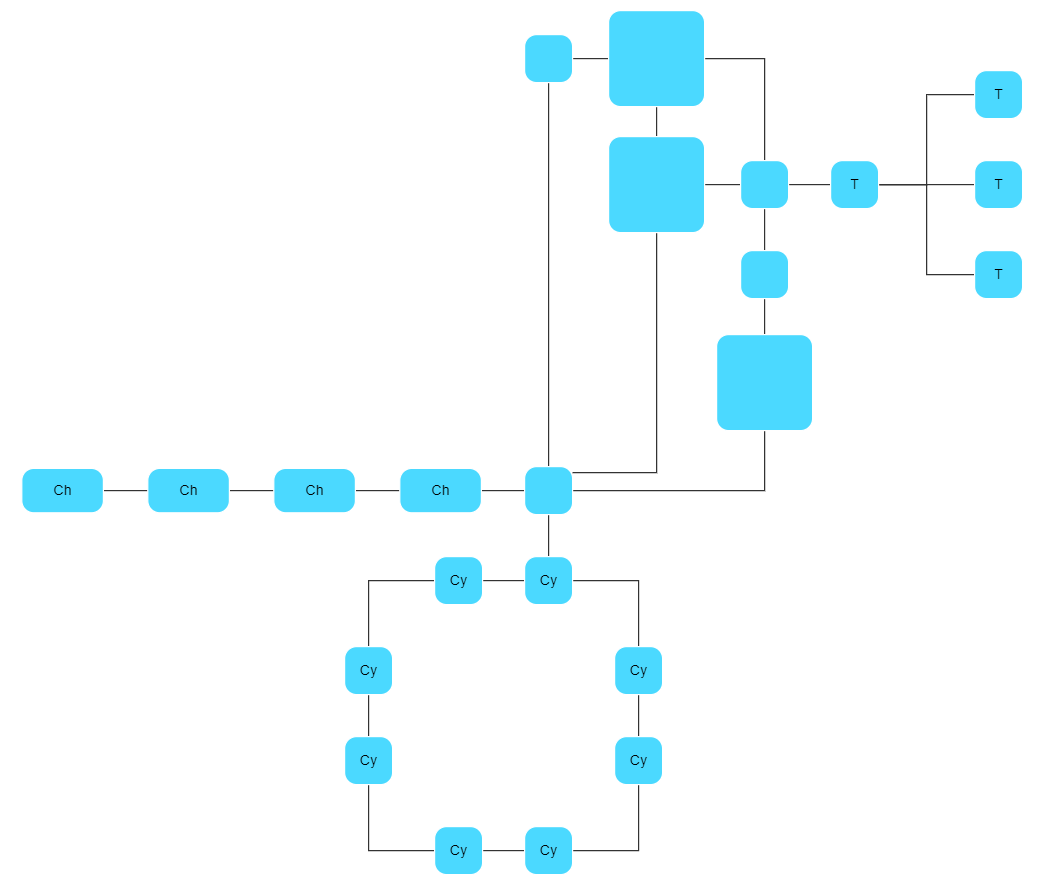
The topology-shape-metrics approach consists of three phases: In the first phase, it calculates a planar embedding that minimizes the number of edge crossings. In the second phase, it computes the shape of the edges (i.e., the bends) in the drawing, and in the third phase, the final coordinates.
This approach highlights planarity and is well suited for small and medium-sized sparse graphs. It produces compact drawings with no overlaps, few crossings, and few bends.
yFiles contains an implementation of this approach called Orthogonal Layout. It provides several advanced features like label placement, support for nested graph elements, and highlighting of specific substructures like cycles, chains, trees. Besides, it supports directed orthogonal drawing where the algorithm draws a subset of the edges such that they point in a uniform, predefined orientation, like, e.g., bottom-to-top.
All available options of the Orthogonal Layout can be explored using the Orthogonal Layout Example.
Layered Drawing Algorithm
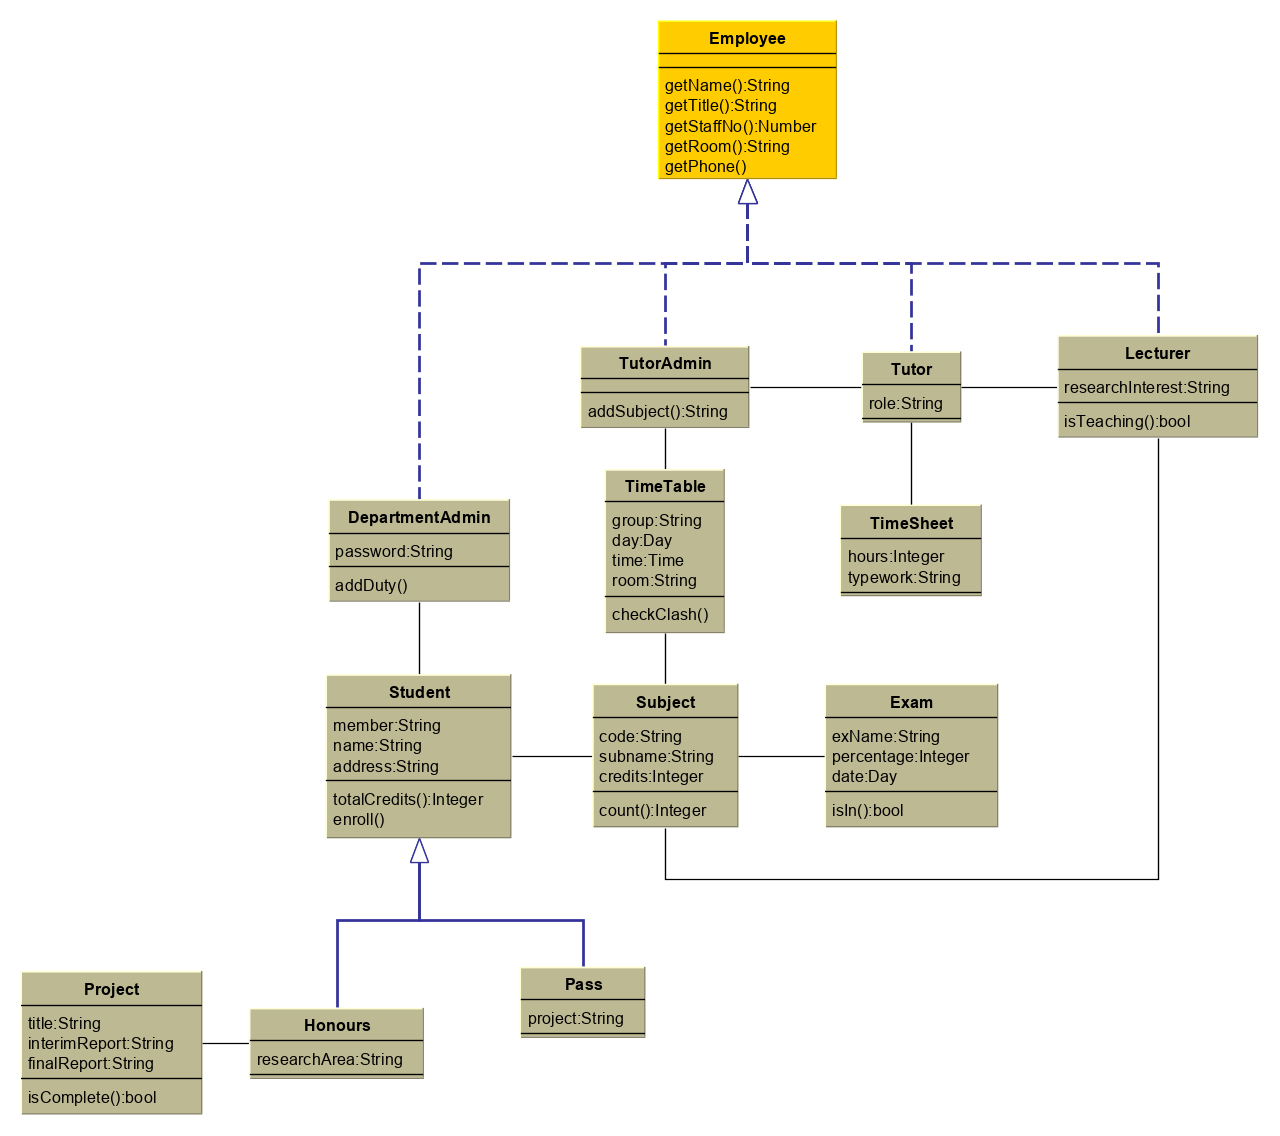
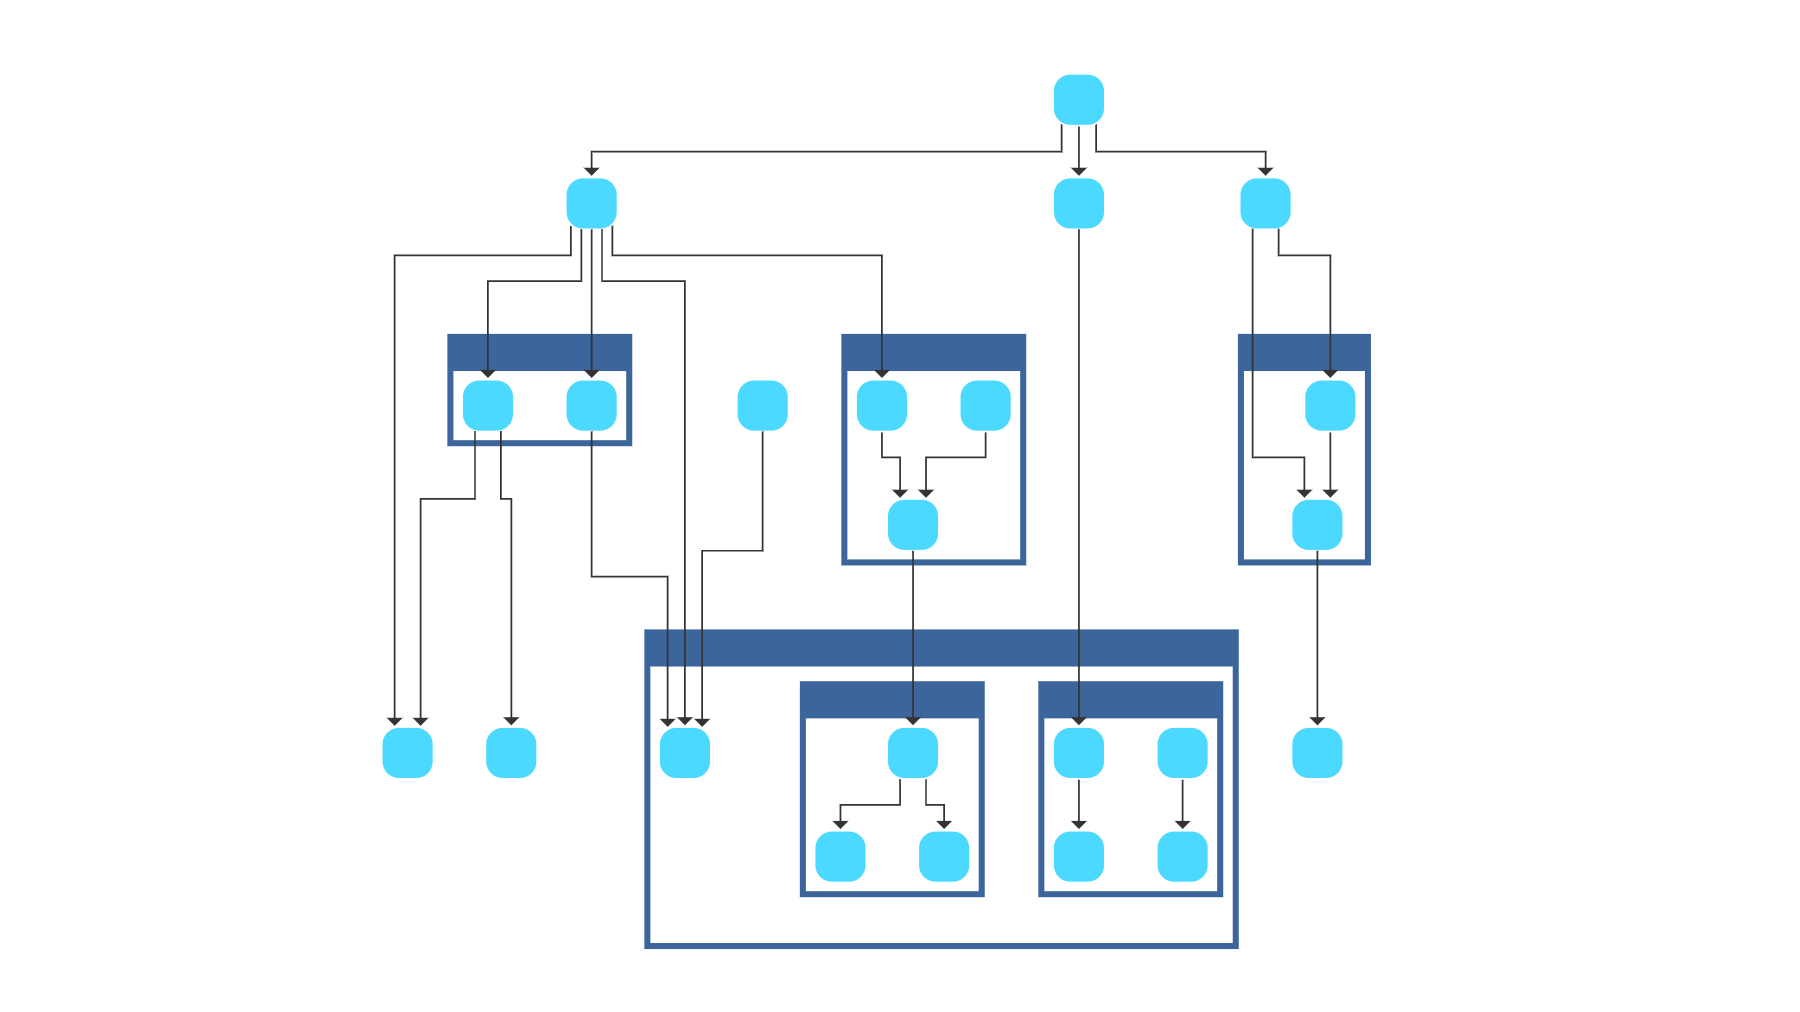
Layered graph drawing algorithms distribute the nodes over layers so that most of the edges point in the main layout direction. This arrangement facilitates the identification of dependencies and hierarchic relationships between the elements in the graph.
The layered graph layout approach consists of three steps: layer assignment, crossing reduction, and coordinate assignment. In the layering step, it assigns the nodes to horizontal layers such that the edges point downwards. During the crossing reduction, the algorithm computes a sequence of the nodes within each layer, minimizing the number of crossings between edges. In the coordinate assignment step, the nodes are assigned to coordinates maintaining the layers and sequence calculated in the previous steps.
The yFiles library contains a sophisticated implementation of this approach called Hierarchic Layout. It provides advanced features like incremental layout, nested graphs, label placement, different edges styles (e.g., bus-like routes), and supports many constraints like swimlanes or tabular grid structures, specific element orders, and port assignments.
All available options of the Hierarchic Layout can be explored using the Hierarchic Layout Example.
Edge Routing Algorithms
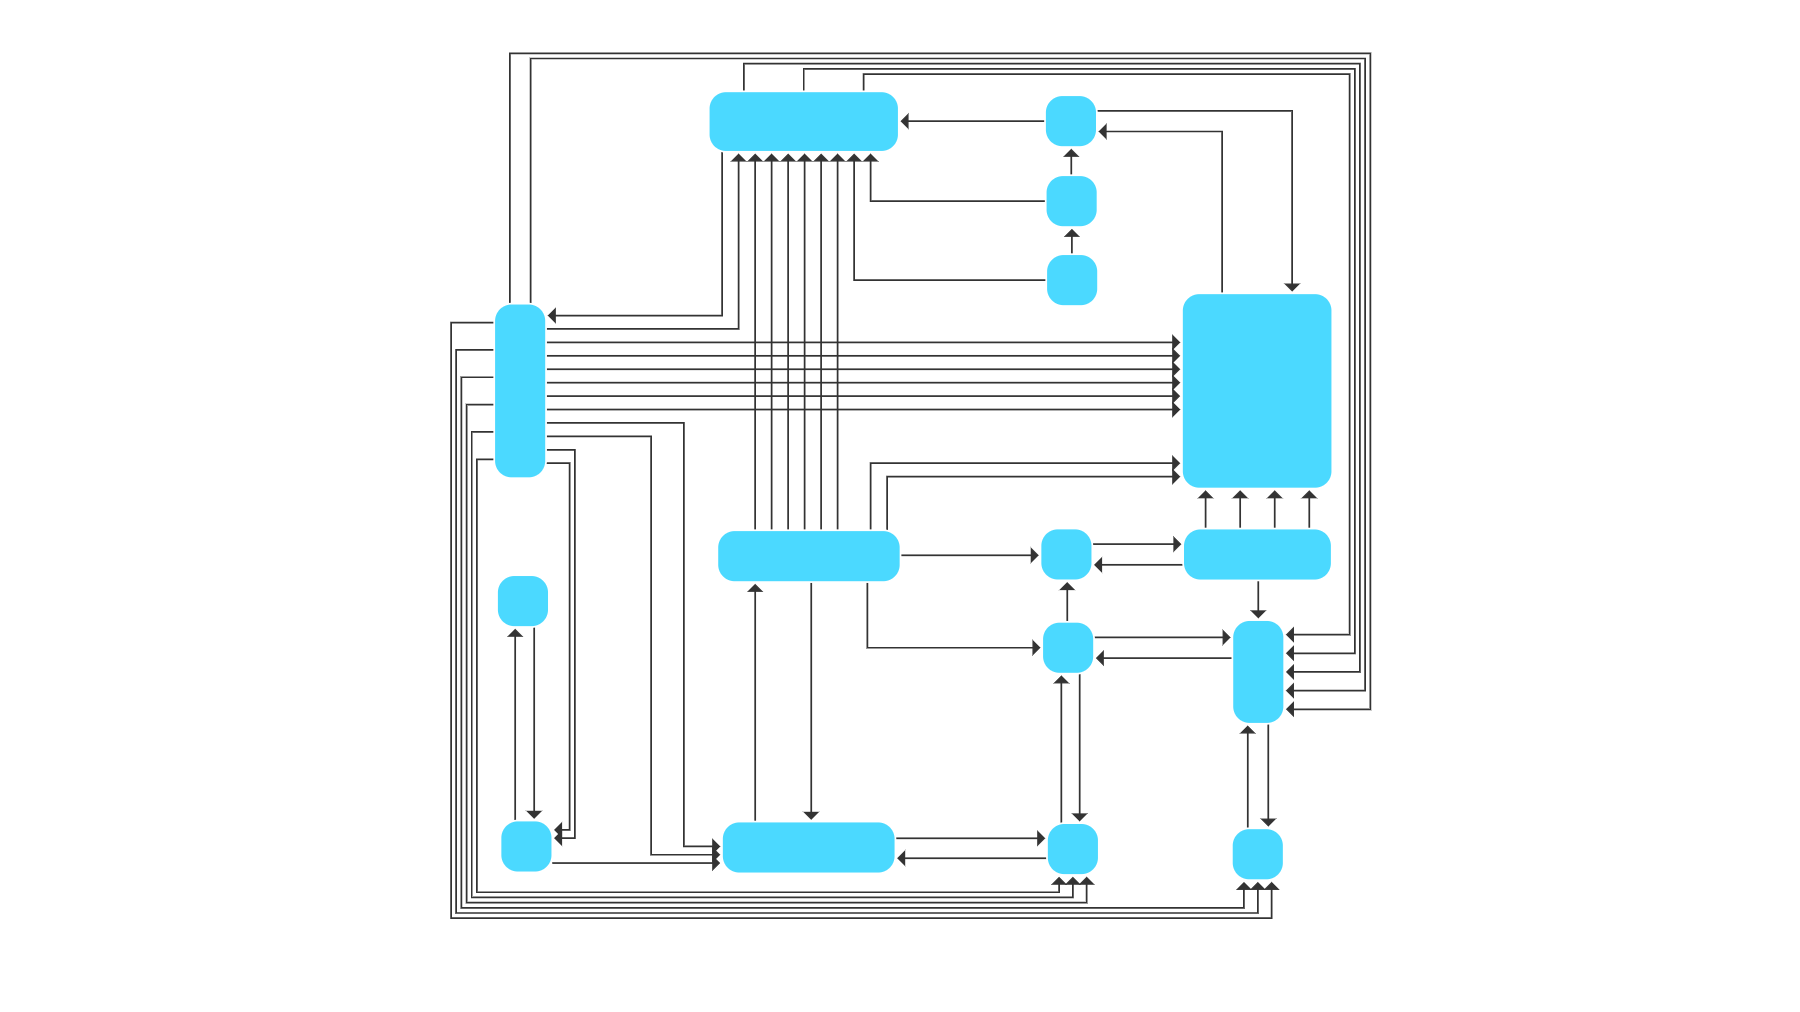
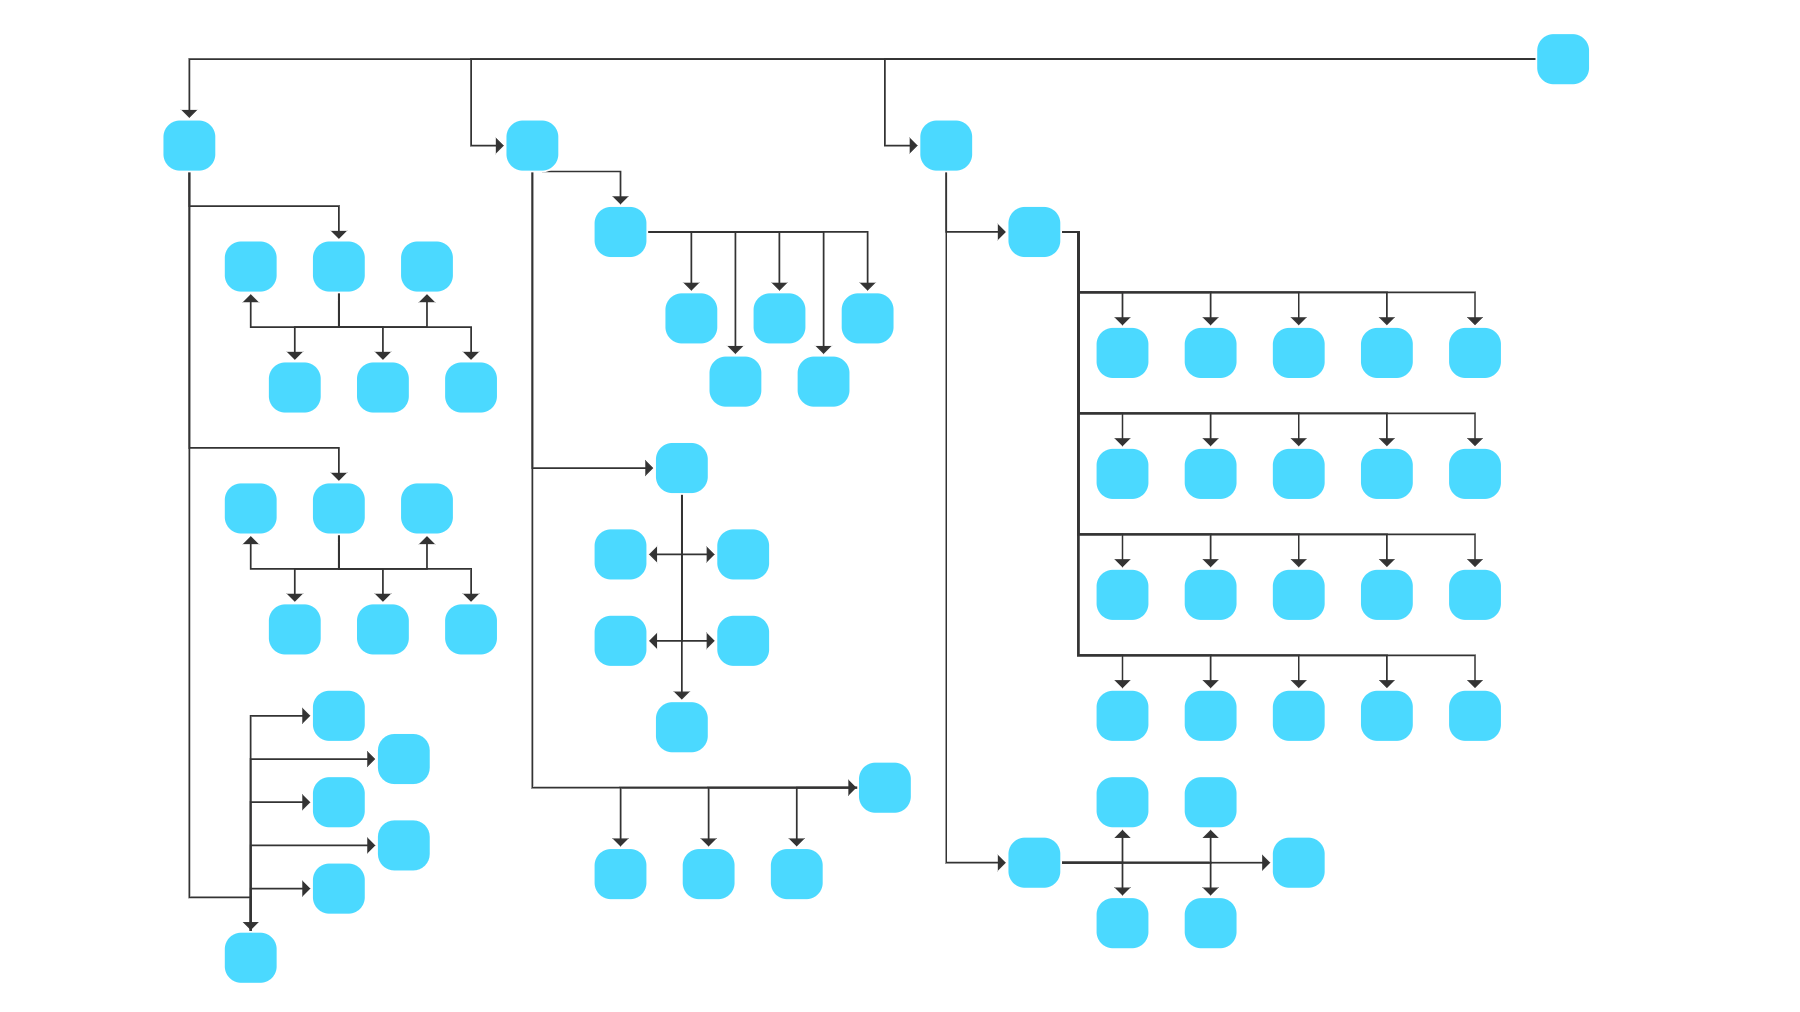
Edge routing algorithms calculate suitable routes for the links (i.e., edges) of a graph while keeping the locations of the nodes fixed. Most algorithms try to omit node-edge overlaps when calculating the specific routes.
There are several use cases where the application of such algorithms is beneficial, e.g., for the visualization of geospatial data where the nodes are already placed in the drawing or for incremental layouts where users add new edges to an existing graph layout. For such scenarios, edge routing provides an easy and fast way to gain insight into the relationships among the elements.
Besides orthogonal edge routing, the yFiles library also provides support for polyline and organic routing styles as well as bus-like routing.
The Bus Router Example and the Polyline Router Example display all available options.
Series-Parallel Drawing Algorithm
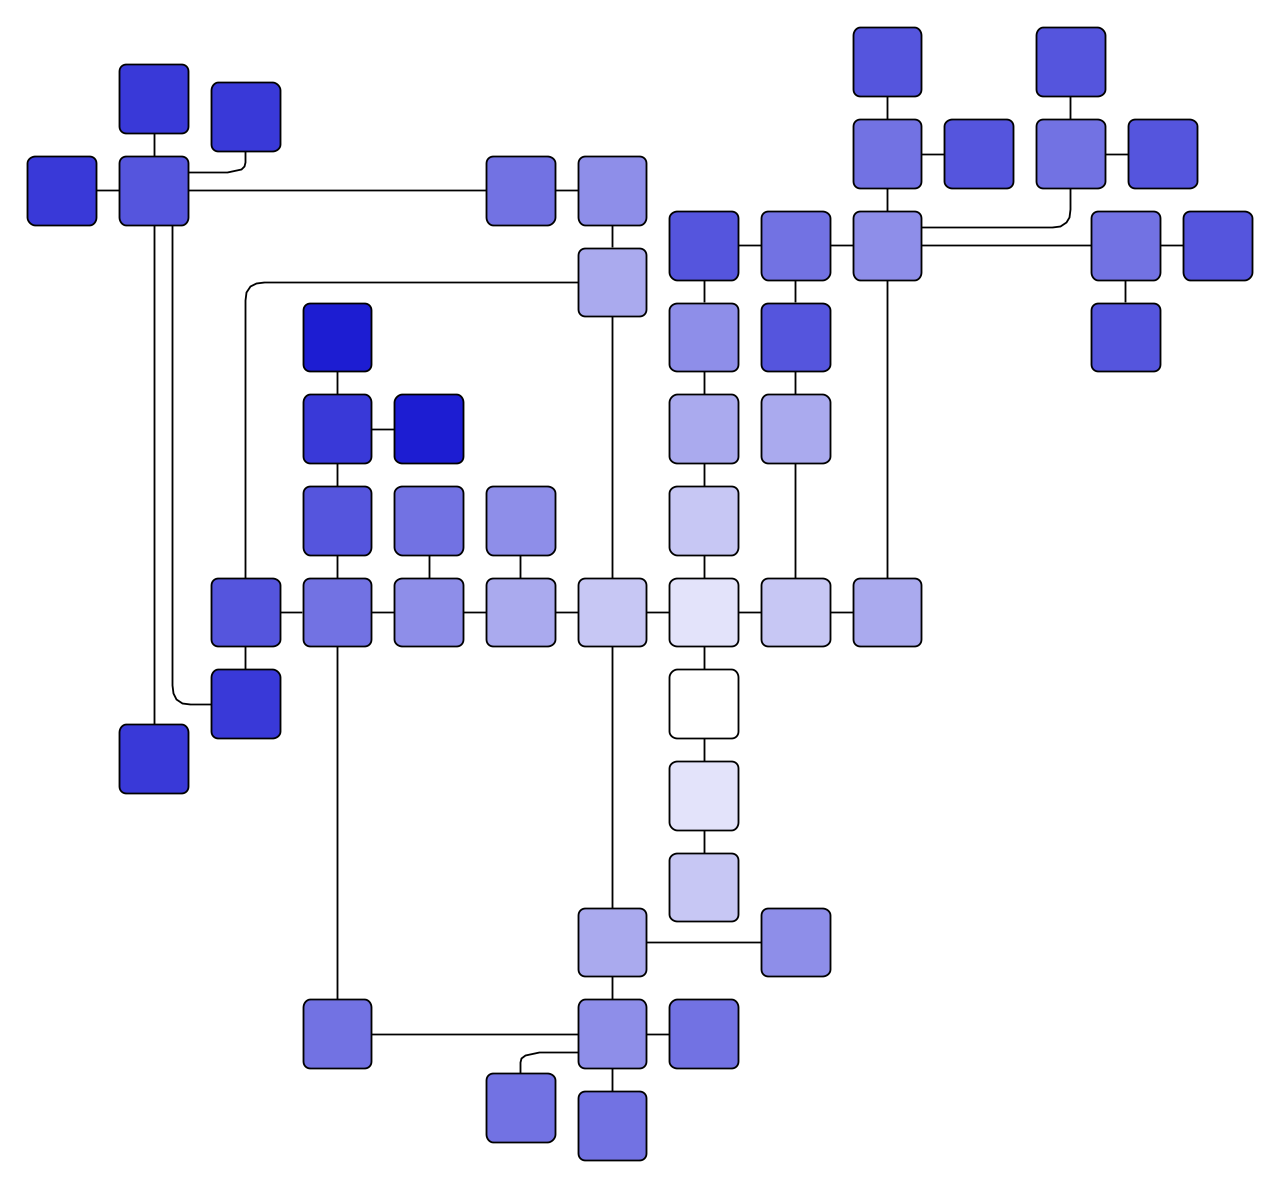
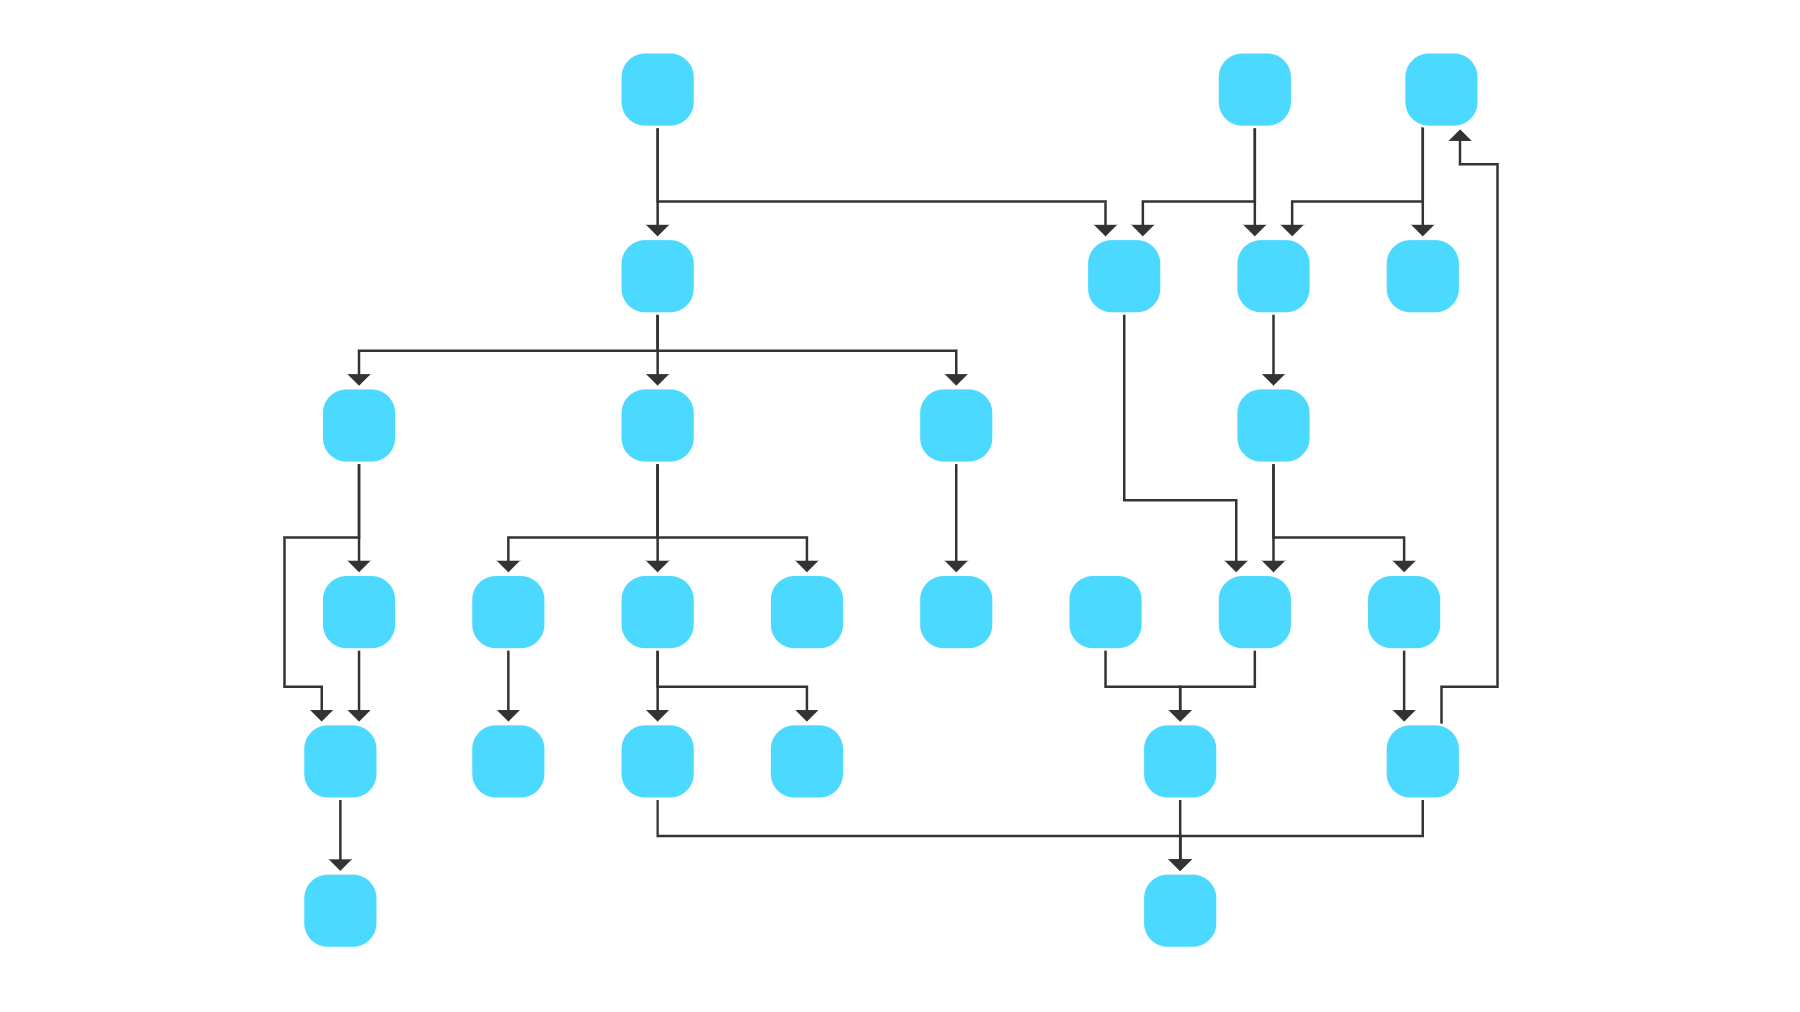
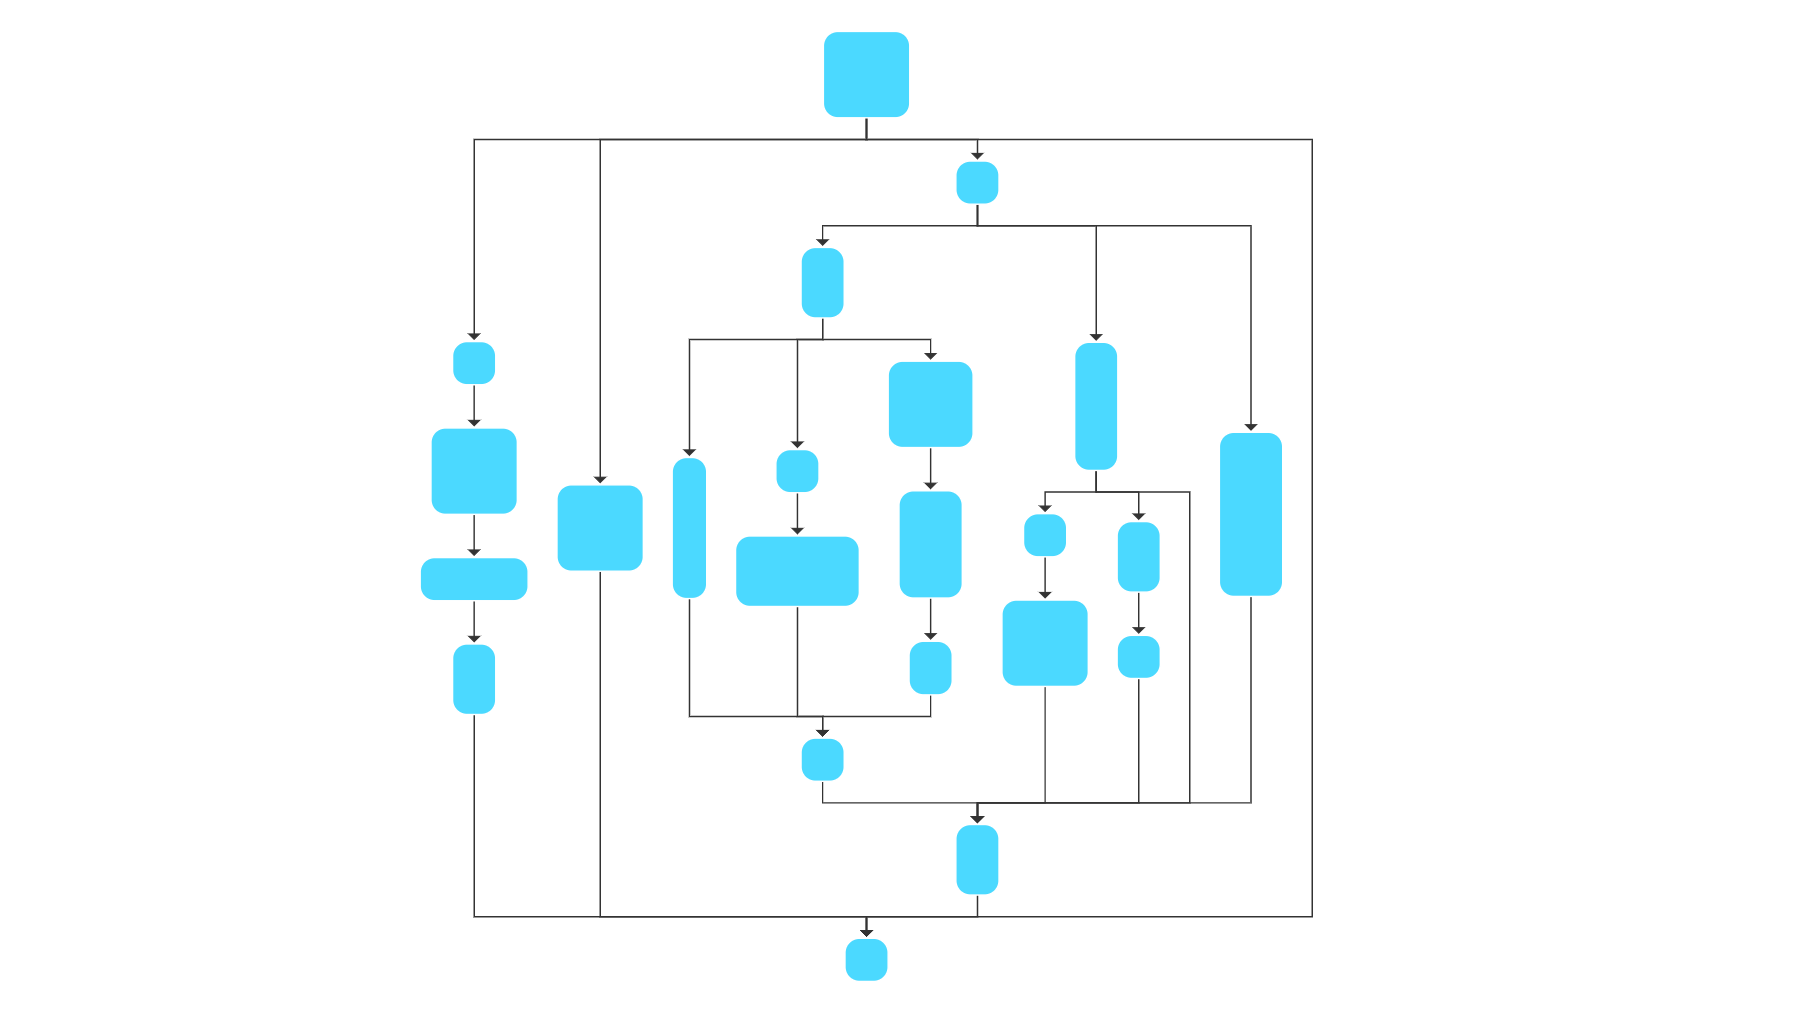
Series-parallel drawings apply to graphs with a specific kind of structure consisting of a recursive composition of series and parallel operations.
These kinds of drawings highlight the main layout direction and produce compact results showing bus-like edge routing with few bends. Thus, they are especially suitable for the visualization of circuits and call trees.
The Series-Parallel Layout implementation provided by the yFiles library supports predefined ordering of nodes, label placement, different alignments within parallel compositions, and several edge routing styles.
All available options of the Series-Parallel Layout can be explored using the Series-Parallel Layout Example.
Tree Drawing Algorithm
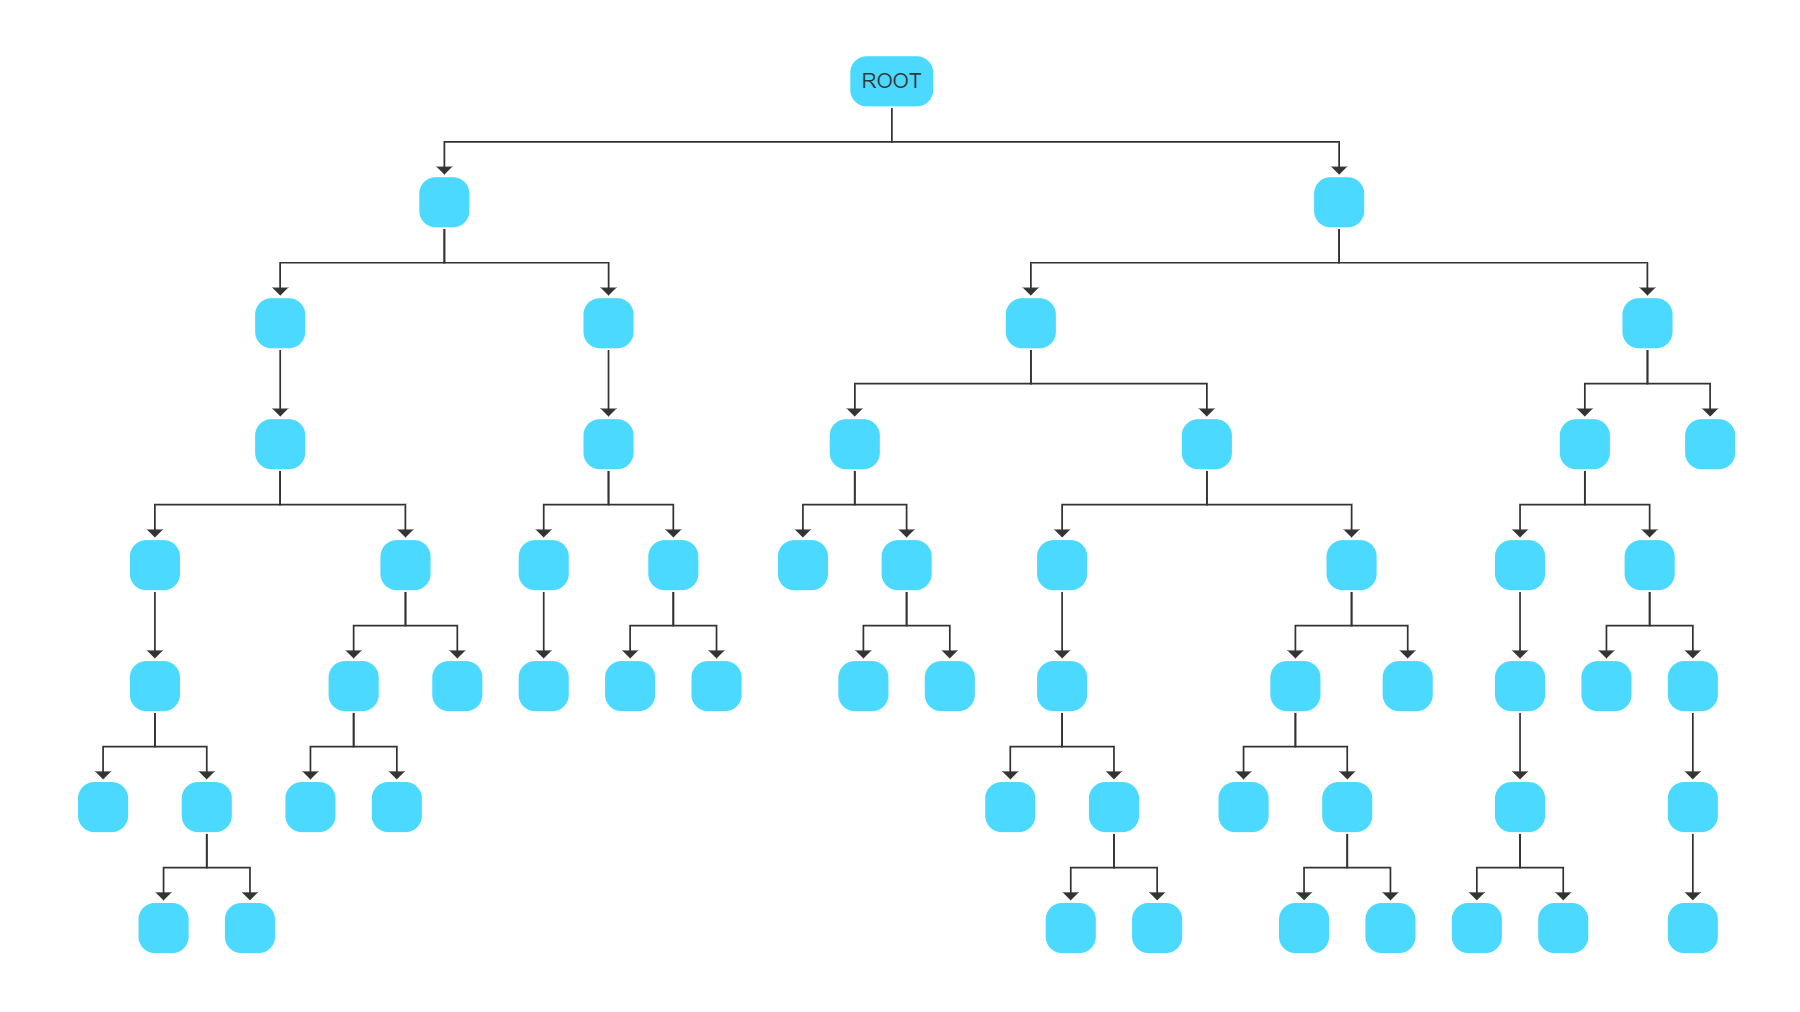
Trees are a particular type of graph structure characterized by containing a global root node with an arbitrary number of children that are again local roots of their respective subtrees. Specifically, a tree never contains cycles. Tree drawing algorithms reveal a hierarchic order within the graph by highlighting these parent-child relations.
Tree drawings are commonly used for visualizing relational data and for producing high-quality diagrams that can reveal possible hierarchic properties of the graph.
The Tree Layout included in yFiles is a highly customizable algorithm that provides many different arrangement styles for a wide range of such applications, e.g., organizational charts.
All available options of the Tree Layout can be explored using the Tree Layout Example.
yFiles comes with much more sophisticated and highly customizable graph layout algorithms.
