Drawing Smooth Curved Links in Diagrams and Networks
Learn how to create smooth routes based on Bézier curves for the connections in a diagram.
The suitable drawing and styling of the links (the so-called edges) is a crucial element for a good computer-based visualization of a graph or network structure. Understanding how elements are connected with each other is ultimately one of the main goals in data visualization.
There are many possibilities when it comes to how the links shall be visualized. Typical styles are the orthogonal style that uses only horizontal and vertical line segments, or the octilinear style that additionally allows sloped, 45-degree segments. They are often required for technical diagrams, like, for example, electrical networks. What if these styles are too technical for your requirements? A smooth, curved routing style might be the solution. Curves are pleasant to look at and easy to follow, making them a good fit for many applications.
Getting Curves
In computer-based data visualization, there are several elements to consider in order to get perfectly curved links for your diagram.
The required technical tool are the so-called splines. A spline is a mathematical function that is defined piecewise by several polynomials. The most prominent polynomial curve is the Bézier curve. Depending on its order, it consists of multiple control points (e.g. four points for a cubic curve). Multiple Bézier curves joined together form a Bézier spline.
Having control points, they must be correctly handled such that actually a proper curve is drawn. The task becomes more challenging in interactive application scenarios, as the curve should appropriately react to user interactions. This is the first important requirement. Second, if curved paths are not manually calculated or given by the data, they should be computed by automatic graph drawing algorithms. Both requirements can be easily implemented using the professional diagramming library yFiles. The library is designed explicitly for diagram visualization and its flexible API offers a huge array of functions out of the box - and this includes functions that let you visualize beautiful curves!
Visualizing Links as Bezier Curves with the yFiles Library
The yFiles library comes with a powerful and customizable style that displays curves by using cubic Bézier curves. It draws nice and smooth curves. Compared with a visualization that uses piecewise linear segments, far less control points are necessary, which is an important fact for improved user interaction and better performance in interactive applications. The diagrams look more organic, and the Bézier style is especially optimized for monotonic flows.
Compare the three paths in the picture below. The orange one is an approximated curve that consists of many straight segments put together. It does not look bad, but the many control points (black dots) make user interaction and possibly the performance quite bad. The second (gray) path shows the result when Bézier control points are simply connected with straight lines. The third (blue) path is the properly-drawn, smooth curve with the same control points. It consists of two Bézier curves that are joined together to a nice spline. Compared to the approximated, orange curve above, it is perfectly smooth.
Automatically Calculating Curves with yFiles
A good visualization of given curves is one thing, but often the requirement is to automatically generate the diagram layout including the paths of the links. Thus, algorithms that generate control points for smooth curves are needed. The automatic layout algorithms of yFiles can comfortably transform the data in a readable, pleasing, and informative network. Among its many options for arranging elements and routing edge paths, yFiles offers algorithms that generate nice, smooth curves. Not only do they look good, but the automatically calculated curves also avoid overlaps with node elements.
Curves in the Layered Graph Layout
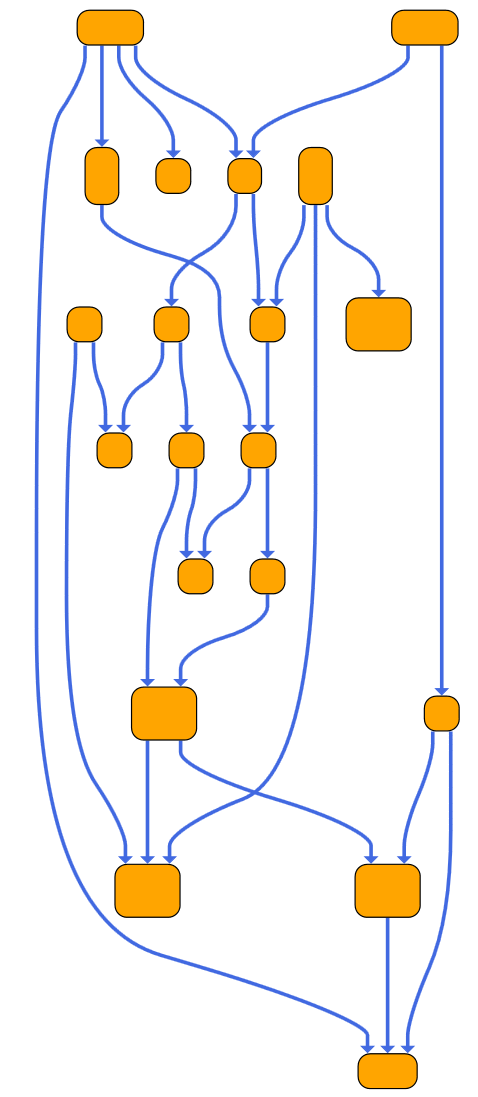
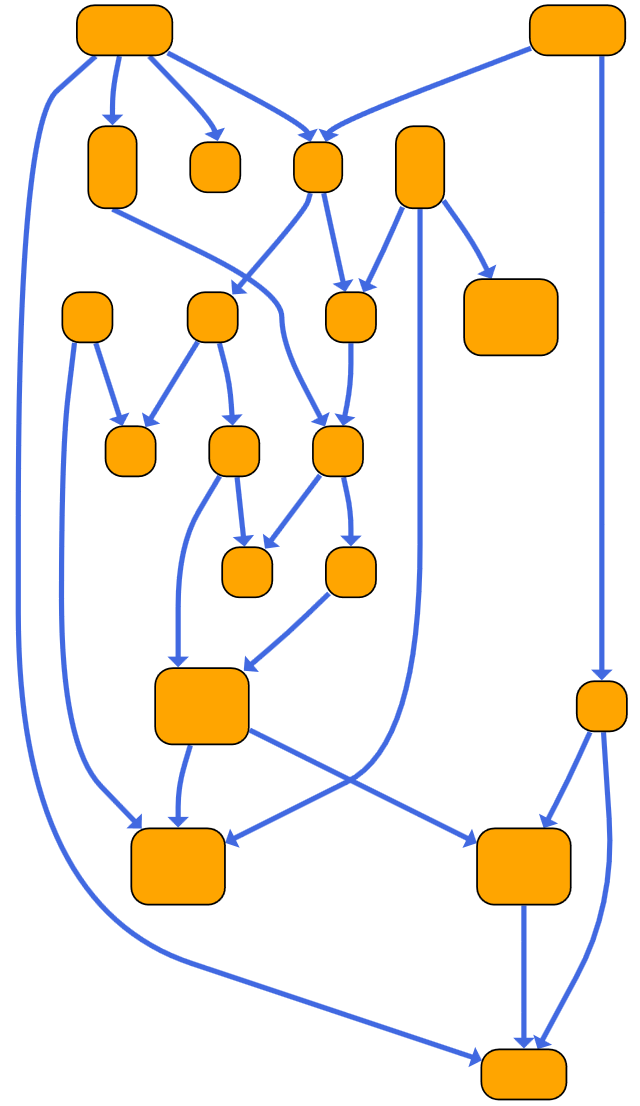
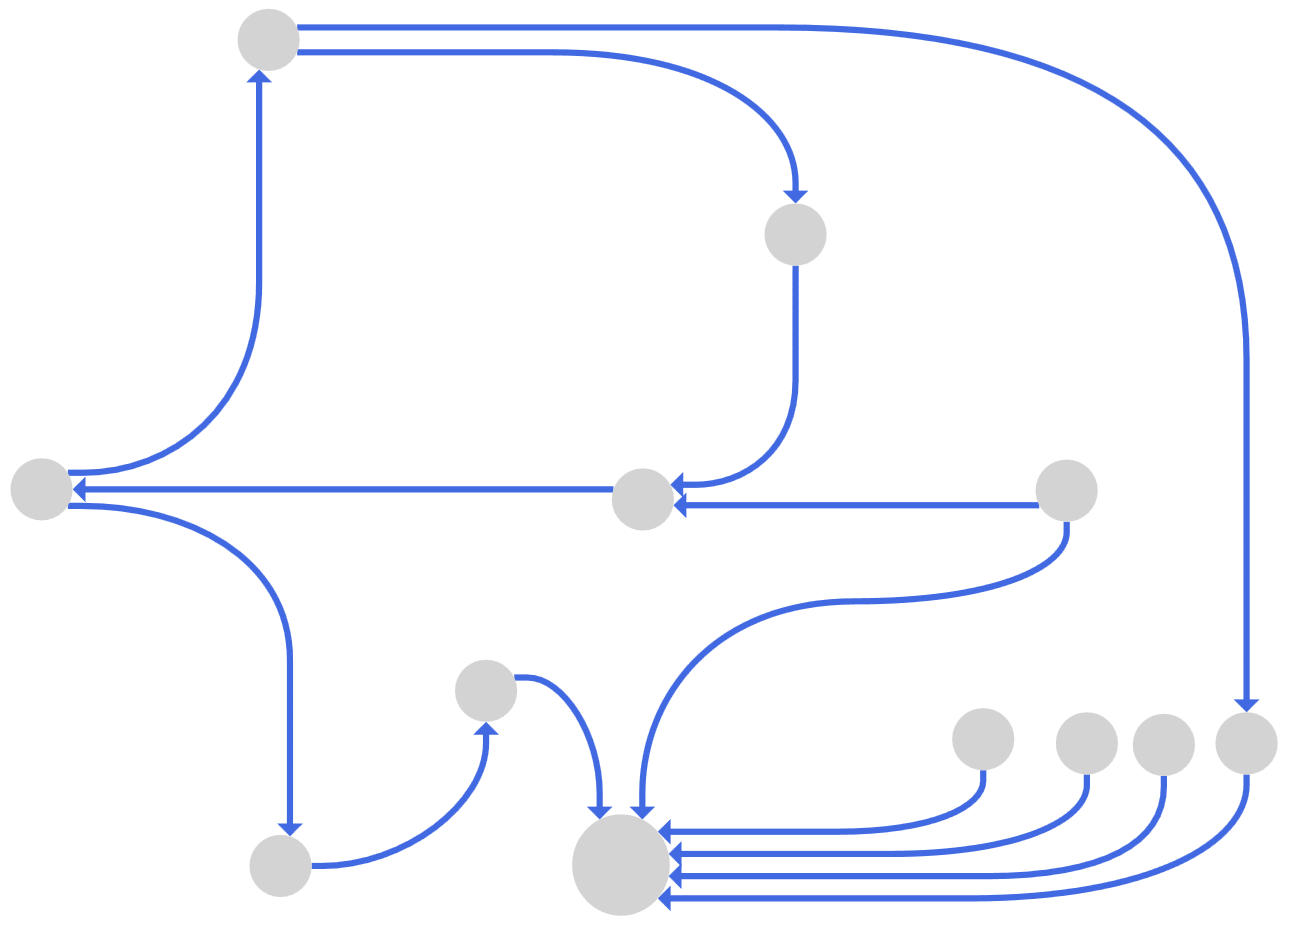
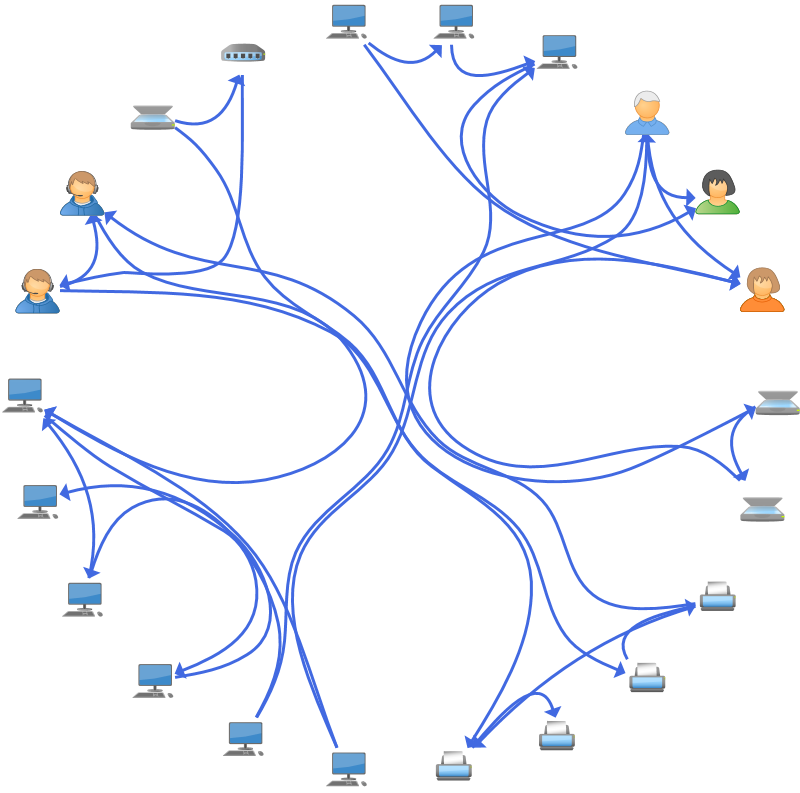
The Layered Graph Drawing Algorithm (also known as Hierarchic Layout or Sugiyama algorithm) is one of the most powerful graph layout algorithms available and applied in many scenarios. The algorithm places all graph elements and produces complex edge paths. In addition to the orthogonal and octilinear path routing styles, the yFiles implementation comes with out-of-the-box support for curved paths! The paths consist of cubic Bézier splines and overlaps with other elements are avoided. When switching to curved routing, it is not necessary to give up other features of the layered graph layout. Important features, like, e.g., edge label placement or minimum distances work with curves, too.
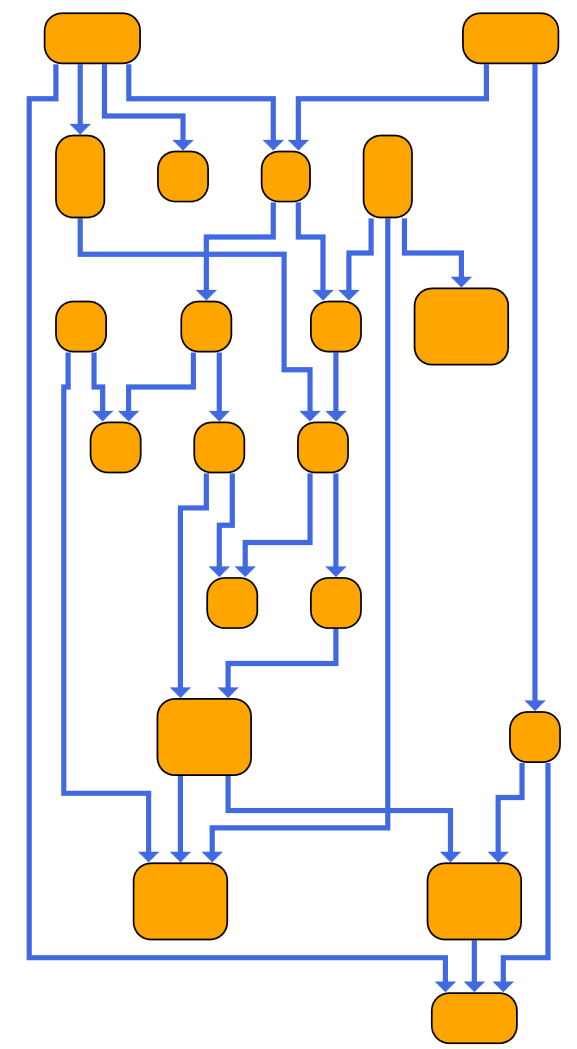
A further feature is the organic-like port connection style that can optionally be enabled. Check out the following pictures to compare the drawings with curves versus a drawing with the default orthogonal style.
Curves in the Edge Routing Algorithm
The Edge Routing algorithm of yFiles provides a sophisticated implementation of a routing algorithm that generates edge paths without changing node positions. It supports many constraints and routing features and besides the ability to generate orthogonal or octilinear edge paths, it supports also curved ones. The curves are compatible with all other routing features of the algorithm.
Curves in other Layouts
With yFiles it is also possible to generically transform given edge paths to curved paths. This might become necessary when using a layout algorithm that does not support curved paths itself but has other features which are required for a certain use case. The Curve Routing Stage of yFiles requires octilinear or orthogonal edge paths as input and generates paths consisting of cubic Bézier splines. The general shape of the given paths is preserved and the positions of other elements are not changed. This enables to convert many other layouts to ones with beautiful, smooth curves!
Examples
Check out the following example application to see Bézier curves in action and to interactively play with them: Bezier Edge Style Demo.
The layered graph layout and the edge routing algorithm with curved edge paths are shown as part of the Layout Styles example application:
