Embedding D3.js Charts in a Diagram
Enrich the item presentation of your diagram with bar charts and other D3.js visualizations
Diagrams often contain additional data associated with the nodes or the links (edges). In many cases, charts are the best solution for displaying this supplementary information. For example, a time-series bar chart can visualize the different time-dependent loads on each node of a computer network.
The open-source JavaScript library D3.js provides a flexible and powerful API for chart visualization with HTML, SVG, and CSS. Embedded in a diagram, D3.js adds another layer of information and liveliness.
Adding D3.js Charts to Diagrams
Although D3.js specializes in charts, it can also create diagrams. However, it lacks a specific diagramming interface that abstracts the graph model from the visualization and also misses more advanced diagramming features. Still, its focus on charts makes it a well-rounded companion for explicit diagramming libraries.
yFiles for HTML is a commercial programming library explicitly designed for diagram visualization. The built-in user input handling makes the diagram accessible with keyboard, mouse, or touch gestures. The diagram can be adapted to any domain with flexible style options. And its sophisticated layout algorithms easily create readable, pleasing, and informative networks.
There exist many different ways of utilizing charts in visualization for displaying further information. The following sections demonstrate two common usages.
Use Bar Charts as Diagram Nodes
A vivid way of embedding charts in diagrams is to use them directly as nodes, i.e., each node is rendered using a chart. This approach emphasizes the data that is associated with each node and makes the diagram structure and connections less critical.
yFiles for HTML provides several node visualizations out of the box. Besides, you can implement arbitrary custom styles based on SVG, WebGL, or HTML5 canvas. Thus, the user can quickly wrap the same code that generates the D3.js chart in a custom style instance that will act as a node visualization. Business data attached to the node can then be used to populate the chart.
The D3.js Chart Nodes sample application showcases the D3.js embedding. The source code of this application is available on GitHub.
Leverage D3.js for Contextual Information
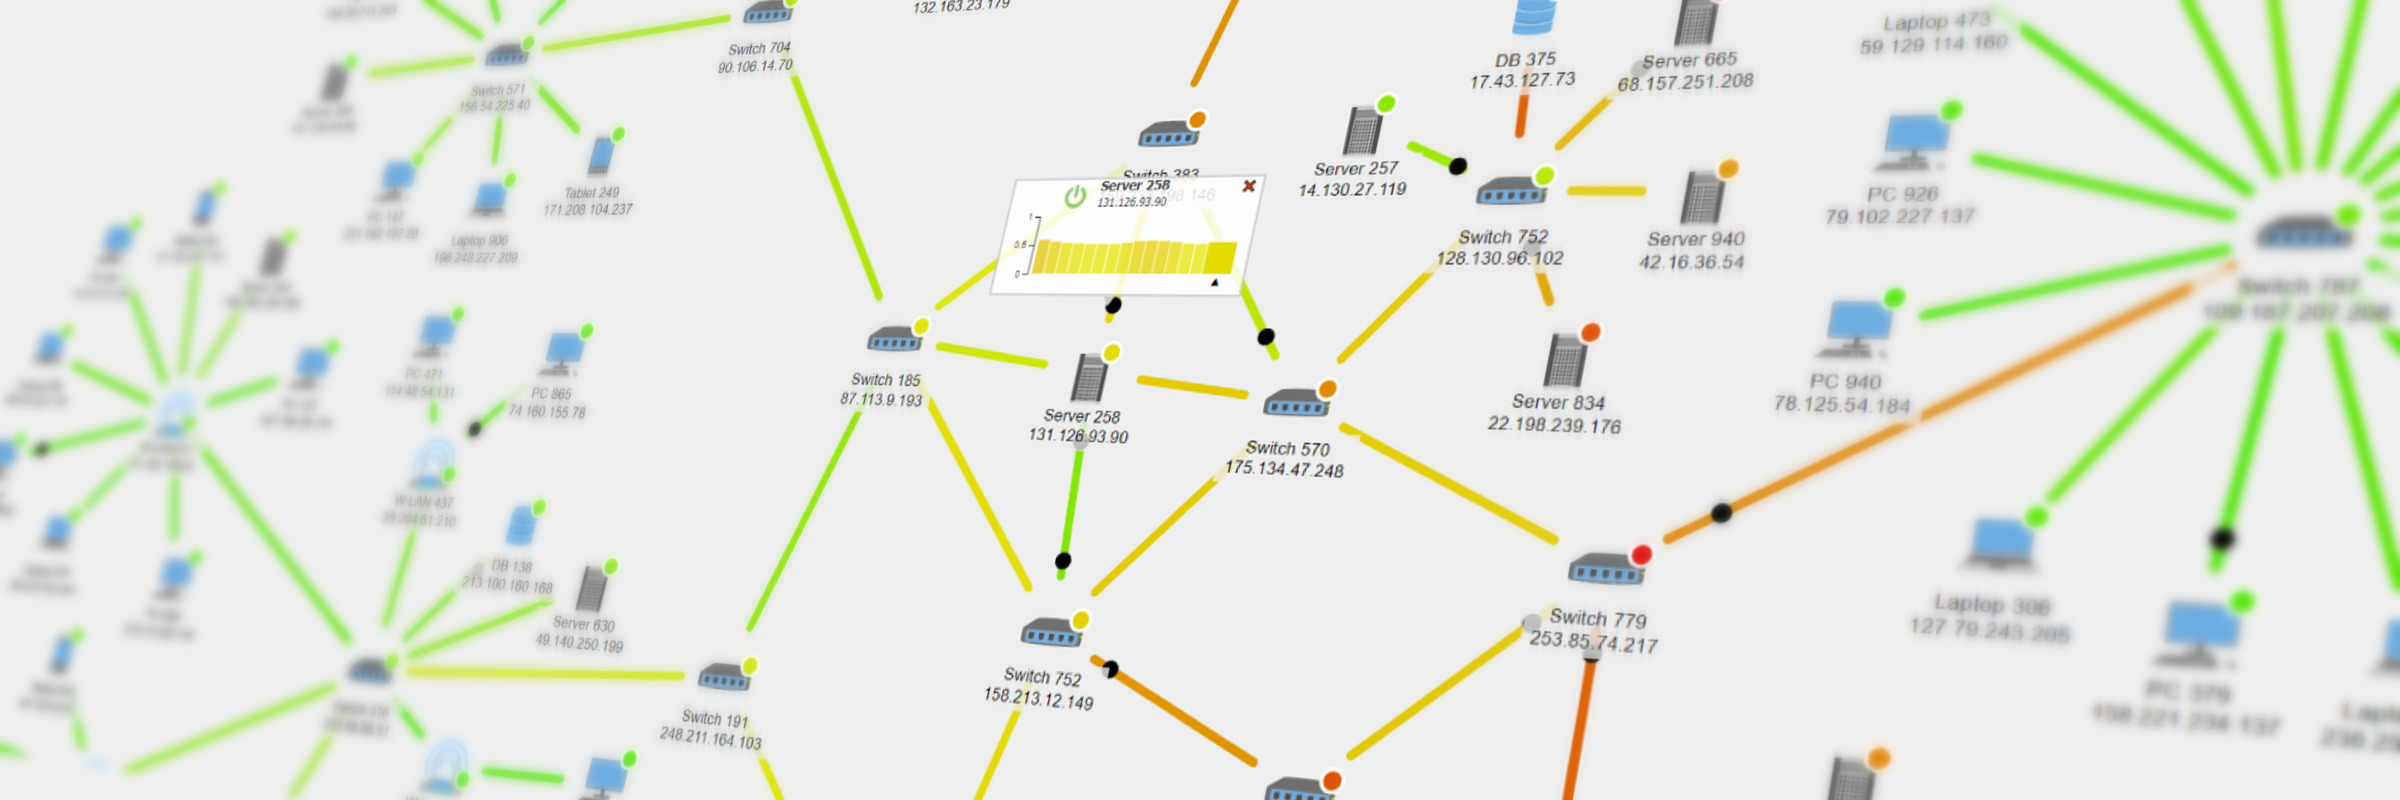
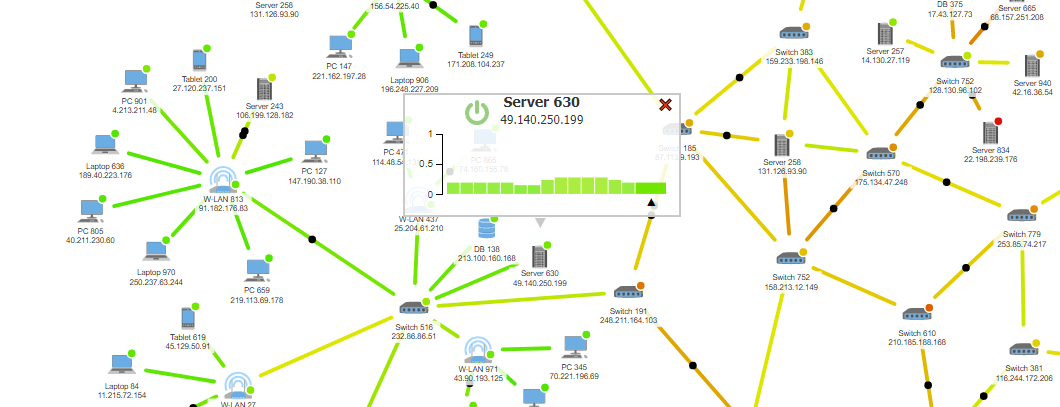
Adding charts as supplemental information is a common approach in scenarios where the graph structure is more important. There are different ways of adding charts in a subsidiary role. Adding the additional information in a contextual popup or menu is the most popular implementation.
Due to yFiles for HTML's flexible user input handling, the user can add charts in the diagram utilizing a tooltip that appears on hover, or as a positionally fixed popup that opens on click.
Examples and Source Code
yFiles for HTML comes with a D3.js Chart Nodes Sample Application that shows a node style that visualizes dynamic data with D3.js and a Network Monitoring Sample Application that displays D3.js charts in dynamic popup panels on node click.
The source code of these sample applications is part of the yFiles for HTML package and available from our GitHub repository:


