Level of Detail for Large Diagrams
Improve the readability and performance of diagrams by adapting the visible information to the zoom level
In a diagram, it is a great challenge to display large amounts of data. One problem is to present the data in a clear and readable way. The diagram should convey the information even with a large number of objects visible. Another common issue is performance: displaying lots and lots of objects at once can be consuming both in terms of processing time and memory.
An important option is the level-of-detail data visualization. This principle is common in the area of 3D graphics: Rendering time can be saved by displaying objects which are farther away and, therefore, smaller, with less detail than the objects in the foreground. The same principle is also applicable to the representation of diagrams: In a visualization that shows a large number of data, the display usually is zoomed far out, which means there are many objects to display. These objects, however, are small, and thus, it is possible to reduce the details of the object visualization without losing information — by omitting details that cannot be distinguished, anyway. It might even be possible to minimize clusters or sub-graphs into one single object without changing the overall picture of the graph. Ideally, the diagram might become even more transparent that way.
Level of Detail Visualization
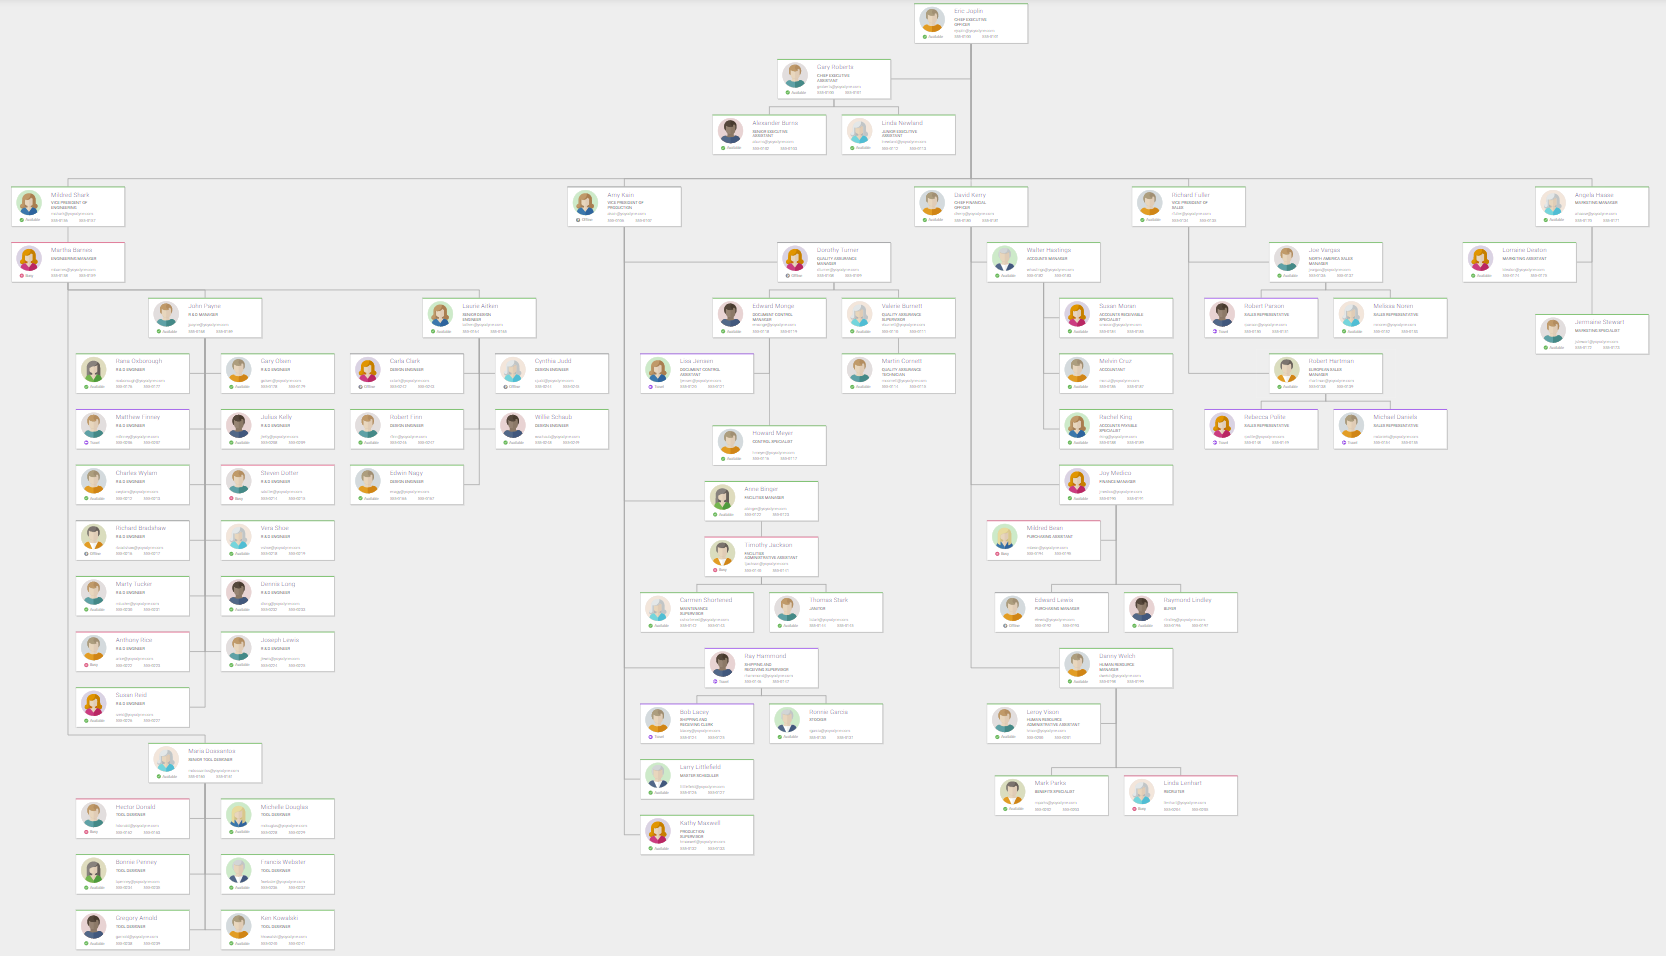
The question to answer is how to reduce rendering time and improve clarity by leaving out details. Let us view an organization chart as an example:
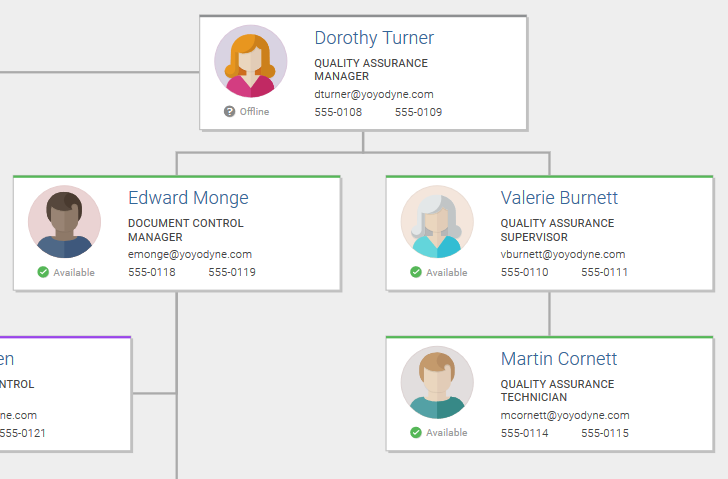
From the above images, it is evident that if we always display the objects with all details, the text becomes unreadable in smaller zoom levels. Moreover, we waste rendering time for displaying text, which is not readable, anyway.
The solution here is to simplify the visualization with smaller zoom levels, which reduces the rendering time and memory usage per object. Ideally, this compensates for the resource usage of more objects to display at the same time. Simplifying the information has another advantage: reducing the displayed text to only the essential information allows for using a larger font, which yields better readability of the visual information.
The above figure presents the same diagram with the level of detail rendering. Note that the most important information — the surnames — are readable even if the entire diagram is displayed. Also, note that the text rendering is omitted as soon as the short text becomes unreadable.
yFiles is a commercial programming library that provides maximum flexibility for the visualization of diagrams and diagram items.
Run the Organization Chart Sample Application to explore the examples demonstrated here. It is part of yFiles on all platforms. The Organization Chart Sample Application that comes with yFiles for HTML focuses solely on the level of detail rendering.
Level of Detail Filtering
In addition to simplifying the rendering of the objects, it is also possible to reduce the entire diagram, if necessary. For example, a sub-graph can be replaced by a single node, probably by a node of the appropriate size.
Again, we take an organization chart as an example. Instead of having one entity (or node) per employee, entire departments can be merged into single entities. The resulting objects are large enough to display a readable label with the department name, which contributes to a further clarification since it adds information which was not visible in the level of detail rendering. Also, the size of the nodes loosely corresponds to the department size, adding even more information.
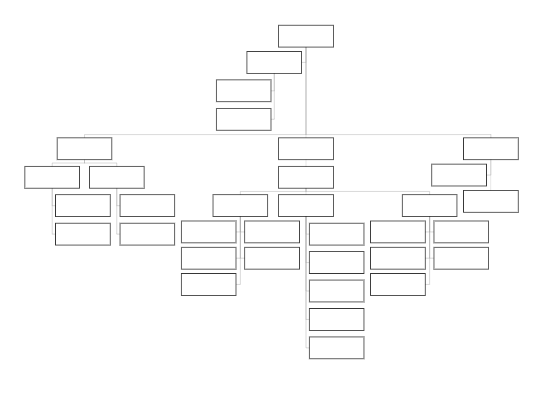
Especially for a diagram organized in clusters, one could replace the nodes of a cluster with a single node.
yFiles provides various methods to filter graphs. The user can try multiple online demo applications to explore the capabilities of yFiles driven applications.
The Hierarchic Grouping Sample Application shows how parts of a hierarchically organized graph can be hidden and shown interactively. The Collapsible Tree Sample Application demonstrates how to hide and show sub-trees of a tree structure. Similarly, the Organization Chart Sample Application also supports showing and hiding parts of the diagram.
Examples and Source Code
With yFiles, level of detail visualization and level of detail filtering can be realized on all supported platforms. yFiles comes with the following sample applications that demonstrate these features:
The source code of these sample applications is part of the yFiles packages and available on the yWorks GitHub repository:
-
yFiles for HTML: Organization Chart, Hierarchic Grouping, Collapsible Tree
-
yFiles WPF: Organization Chart, Hierarchic Grouping, Collapsible Tree
-
yFiles.NET (WinForms): Organization Chart, Hierarchic Grouping, Collapsible Tree
-
yFiles for Java (Swing): Organization Chart, Hierarchic Grouping, Collapsible Tree
-
yFiles for JavaFX: Organization Chart, Hierarchic Grouping, Collapsible Tree
yFiles for HTML also contains a Level of Detail Rendering Sample Application that focuses on the implementation of a level of detail rendering with yFiles and can be used out of the box in any project based on yFiles for HTML.
