Network Monitoring Visualization
Build your own advanced network monitoring tool for displaying network topology and packet flow
Computer networks are critical infrastructures that handle enormous volumes of data that have to be transported to their final destination quickly and efficiently. Many times, this data is related to services offered to customers, and thus, it is fundamental that the data flow in the network circulates continuously and without delays. However, traffic monitoring is a challenging task for network administrators, especially in large and complex systems, due to the enormous volume of transferred data.
Network monitoring means continually analyzing network traffic and alerting administrators to slow or failing components and increased response times of the network’s devices. Monitoring tools provide administrators with an overview of their systems as well as a way to control and troubleshoot networks from a central location.
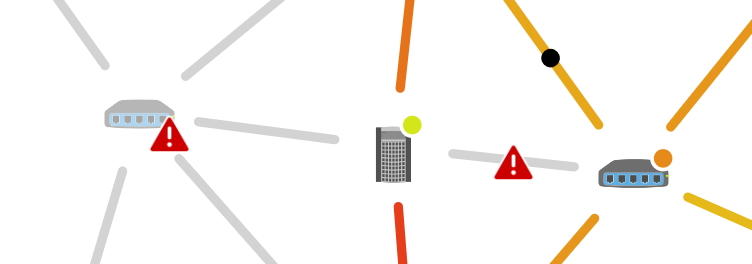
In real life, however, raising alerts related to failed components or other problems is not sufficient for administrators since, in most cases, they need a visual representation of the network’s topology at the time of a failure to efficiently diagnose and fix the failure’s cause. Network visualizations are invaluable help since they intuitively provide insight into the current status of the system.
How to Create a Network Monitoring Visualization
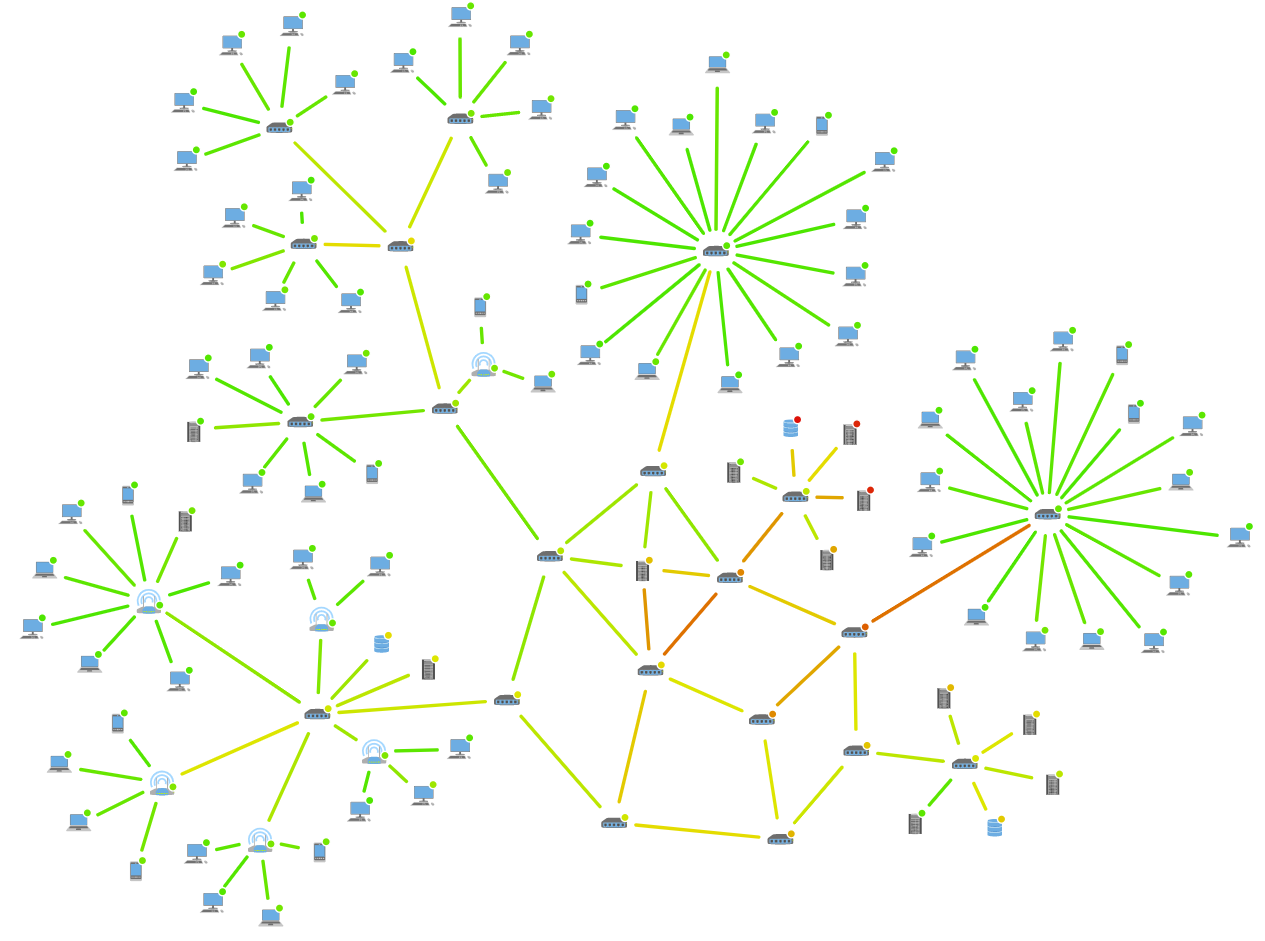
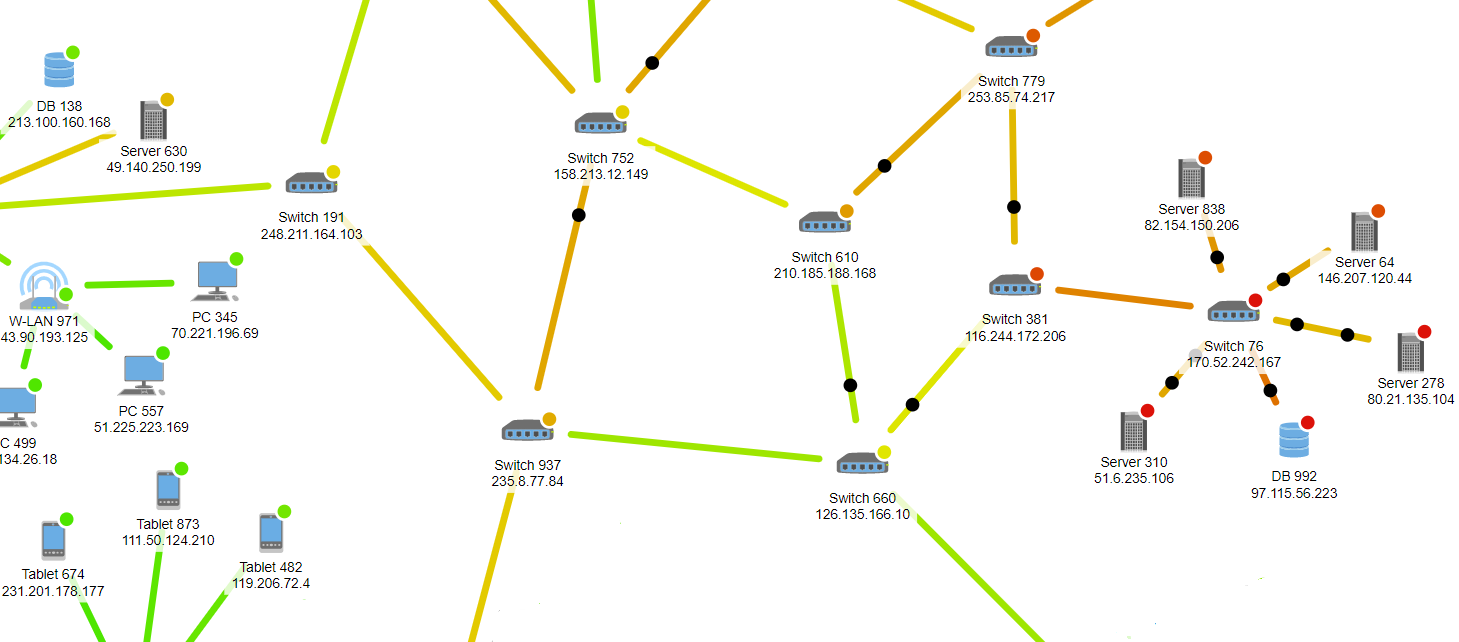
A computer network can be represented as a network graph in which the nodes (vertices) correspond to network devices (such as PCs, Laptops, Tablets, Servers, Databases, and Routers), while the edges (links) represent connections between devices. Besides displaying the general network topology, such a graph may be used to simulate the results of broken links or identify the nodes that suffer from severe traffic loads. A visualization makes this additional information readily accessible.
Many of the existing network tools provide various types of visualizations (some are limited to bars and charts displaying information about the network) that help administrators with their monitoring duties. However, network administrators often require additional features for their work that are beyond the scope or even the capabilities of these tools.
yFiles is a commercial programming library designed explicitly for diagram visualization and is a perfect fit for the challenges of network monitoring. It provides an extensive set of predefined styles for visualizing the elements of a network, while it also supports the creation of user-defined custom styles. yFiles comes with a complete set of layout algorithms for arranging the network graph based on the user’s needs. These sophisticated algorithms organize the network to produce a clear and concise network diagram.
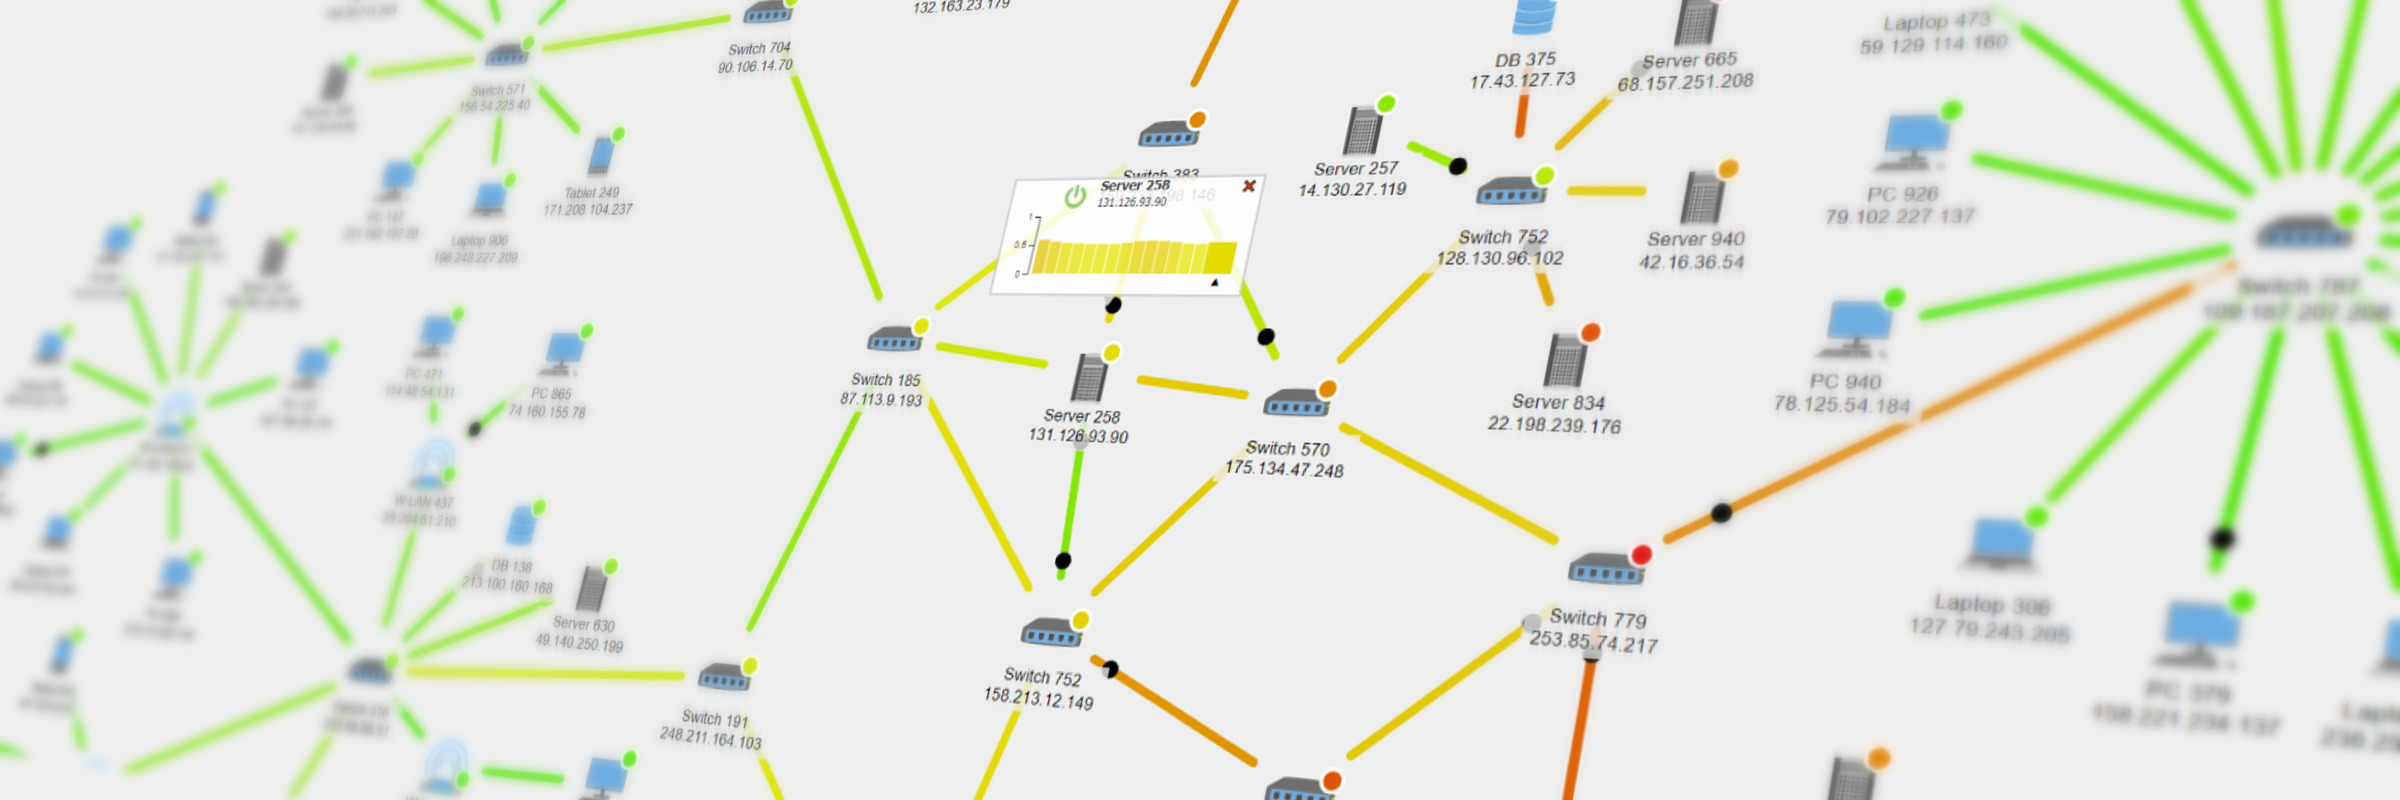
Another challenge in network monitoring is the real-time visualization of the network. yFiles supports updating diagrams in real-time and integrates well with third-party services for retrieving data from external sources. Additionally, it provides the means for creating animations that visualize traffic load or highlight network failures, for example.

Network visualizations often show additional data for the network’s devices and connections. For example, time-series bar charts can visualize time-dependent loads on individual nodes of the network.
Examples and Source Code
With yFiles, a network monitoring application can be created on all supported platforms. yFiles for HTML and yFiles WPF come with a Network Monitoring Sample Application. In this application, users can observe the traffic flowing through the network and even interact with the system by activating/ deactivating nodes.
The source code of the Network Monitoring Sample Application is included in these yFiles packages and available on the yWorks GitHub repository:
Implement Your Own Premium Network Monitoring Application
Test the yFiles diagramming library with a fully-functional trial package. To implement your network monitoring application, start with the Network Monitoring Sample Application included in the yFiles package. This is not only a demo but also provides best-practices source code that you can re-use in your projects. Customizing any aspect of this demo is easy. For example, you can adjust user interaction, change visualizations, and load network topologies with little to no effort.
STEP BY STEP GUIDE:
-
Download the trial version of yFiles for your target platform at the yWorks Customer Center.
-
Navigate to the source directory of the Network Monitoring Sample Application.
-
Explore the sample application’s features and
-
adjust its source code to match your requirements or
-
copy the source code of the features you like to your projects.
-


