Organization Chart Visualization
Create an interactive organization chart using a professional diagramming library
An organization chart (often called organigram, or organogram) shows the internal structure of an organization. It describes the relations and hierarchy inside the organization. The members (employees, positions) are usually represented as boxes, often containing further information such as name, contact information, sometimes photos. Structure-wise, such a diagram is a tree, which itself is a special kind of graph.
Building an organization chart visualizer or editor from scratch can be a challenging task. However, developers can save a lot of money, time, and workforce by using a software library that provides ready-to-use components for this task. yFiles is a commercial programming library that facilitates the creation of organization chart editors. yFiles is available for many different platforms.
Visualizing the Members
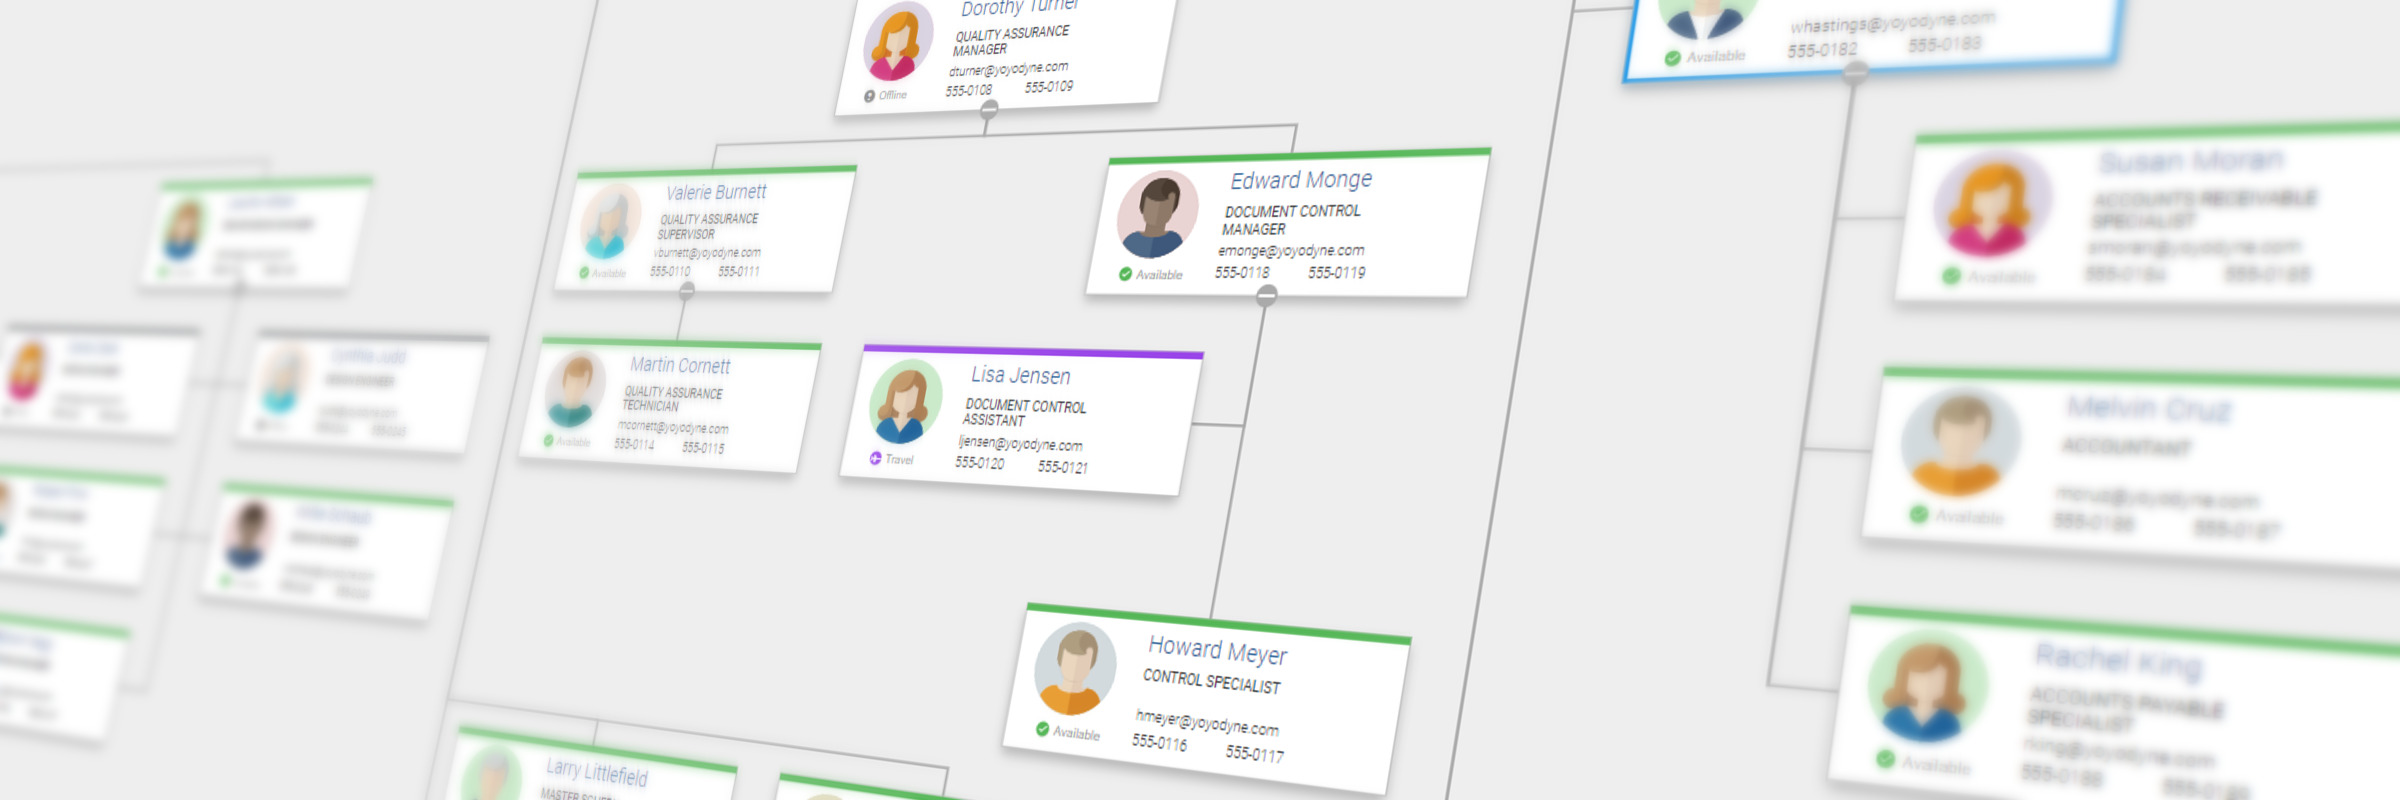
In an organization chart, it is common to visualize a member (e.g. an employee) as a box or card, which shows further information about the member. Besides the name, this often is the member’s position, contact information like phone number, and email address. Often, a photo and information about the member’s current status complete the information.
yFiles supports arbitrary visualizations for elements. Particularly, the use of platform-specific technologies like SVG or XAML allows for the creation of complex styles with familiar tools.
Managing Large Organization Charts
Large-scale organization diagrams, such as the structure of a large corporation, quickly become crowded and confusing. Several techniques may be applied to improve their readability.
Level Of Detail
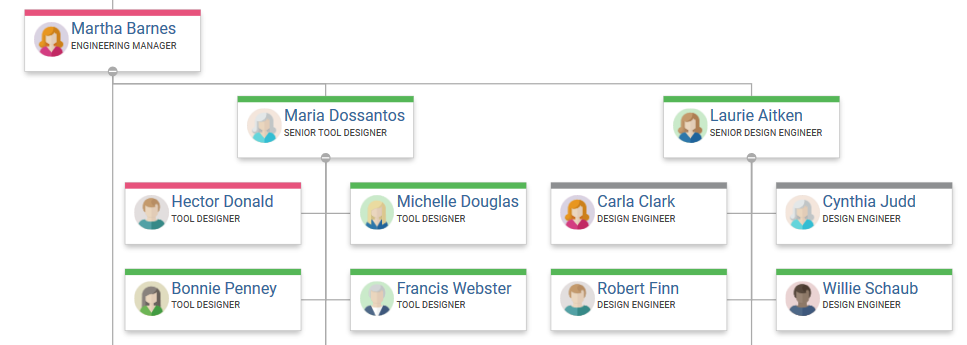
Depending on how far the diagram is zoomed out, omit some node information from the display. For example, addresses and telephone numbers needlessly clutter the diagram if one was to try getting an overview. You may want to reveal this information at an appropriate zoom level only. One might even go so far as to display simple icons for persons if sufficiently zoomed out.
The above example was created using yFiles. A highly flexible visualization is one of the key features of this commercially available software library.
Collapsing of Substructures
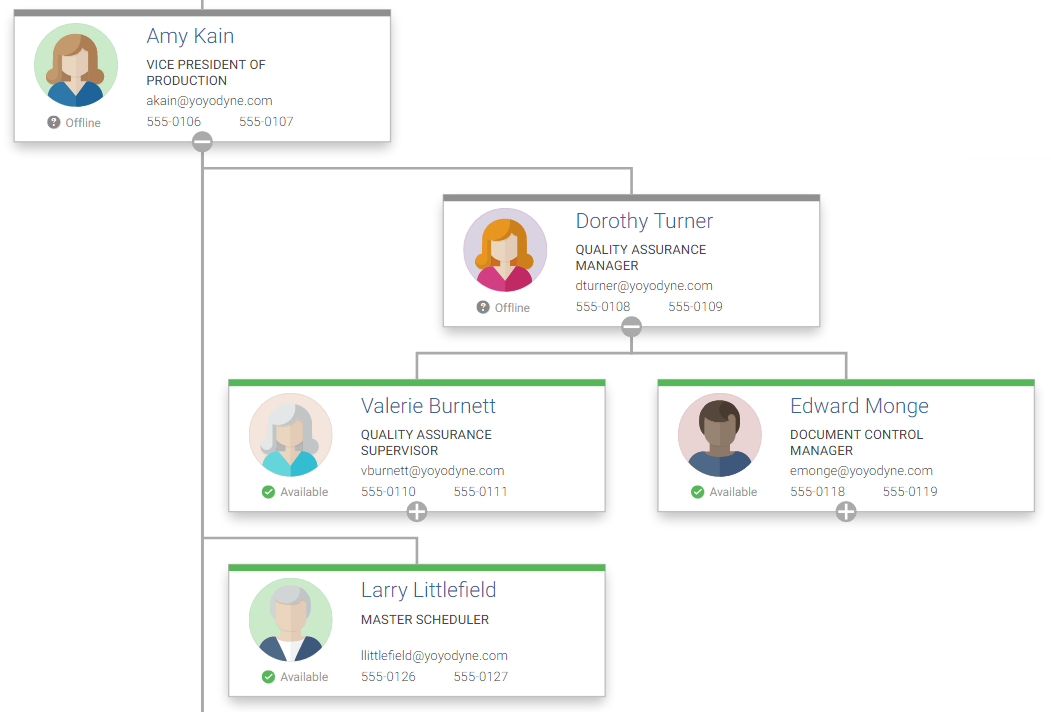
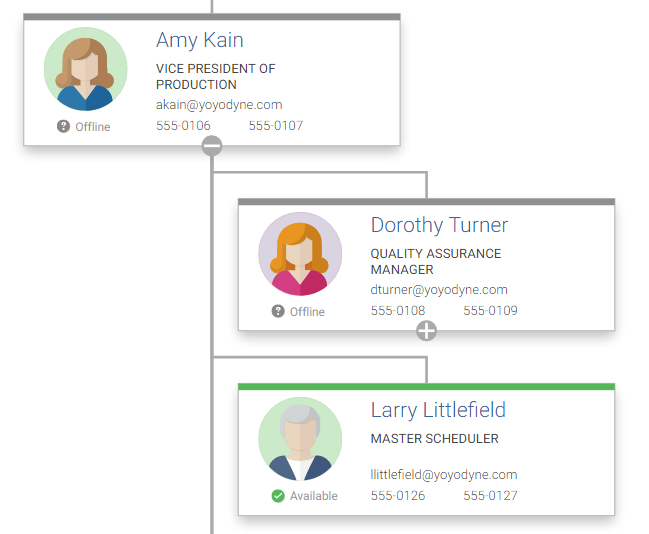
As with all large diagrams, you would want to filter down on the relevant data. So it is sometimes convenient to hide multiple entities altogether. To show a rough outline of a company structure, for example, you would typically hide away all nodes beneath the executive level. Whereas if you wanted to focus on a particular branch, displaying the board of directors is a moot point. Thus ideally, a way to hide an entity’s child and parent nodes is needed.
The above example was created using yFiles. It takes advantage of yFiles’ filtering capabilities combined with the use of interactive elements (for example, buttons) as part of the visualizations.
Examples and Source Code
The commercial programming library yFiles provides components for the visualization and the creation of diagram viewers and editors. It comes with a Organization Chart Sample Application that shows how to create an interactive organization chart. The employees are visualized with different levels of detail based on the current zoom level.
The source code of the Organization Chart Sample Application is part of all yFiles packages and available on the yWorks GitHub repository:
Implement Your Own Organization Chart
Test the yFiles diagramming library with a fully functional trial package. To display an organization chart in your own application, start with the Organization Chart Sample Application that is part of the yFiles package. It’s not only a showcase application but also provides best-practice source code that you can re-use in your own project.
yFiles makes it easy to customize all aspects of this application, for example, include your own styling, change the user interaction, or load the data from your data source. Features like the node visualizations and the specialized automatic layout are separate components that work in any yFiles-based project.
-
Download the trial version of yFiles for your target platform at the yWorks Customer Center.
-
Navigate to the source directory of the Organization Chart Sample Application.
-
Explore the sample application’s features and
-
adjust its source code to match your requirements or
-
copy the source code of the features you like to your project.
-


