React Graph Component
How to integrate custom graph visualization into your React-based web application. Quickly and easily.
The open-source web application framework React is a very popular choice among web developers. There exist many accompanying component frameworks that facilitate the build of a modern web application. Its component-based approach allows creating use case specific components easily.
For example, wrapping yFiles for HTML in a React component, yields a graph visualization component with an easy to use interface, customizable visualization, and sophisticated layouts. The yFiles React Components provide such an integration as open-source, use-case-specific React orgchart components.
yFiles for HTML is a commercial programming library explicitly designed for graph, network, and diagram visualization. Note that the word "graph" refers to the mathematical graph with nodes and edges, rather than a function graph or bar charts, here. yFiles' built-in user input handling makes the graph visualization accessible with keyboard, mouse, or touch gestures. The graph visualization can be tailored to any domain with flexible style options. And its sophisticated layout algorithms easily create readable, pleasing, and informative graph visualizations.
Graph Creation
In a component-based web application, data is usually passed to the component to create the graph visualization. Although yFiles for HTML can be directly attached to an asynchronous data provider, it is also possible to provide data objects (e.g., JSON) from which a graph will be populated.
This allows defining an interface for the component that binds to the graph data. Thus, all features of the yFiles graph visualization library can be utilized on the data to create a perfectly tailored user experience in a React application.
Integrating a sophisticated graph-visualization with yFiles for HTML in a React application is as easy as this:
<ReactGraphComponent graphData={graphData} />Data Binding For Elements
React components typically use data binding to visualize business data that is associated with an element. The framework provides specific directives to bind data in templates easily.
These templates can be used to create dynamic, arbitrary element visualizations. For example, rendering node elements that are zoom-dependent to show the different detailed data:
Building your own node visualizations with React and JSX/TSX becomes trivial:
declare type TagType = { name: string }
const MyNodeTemplate =
  ({ width, height, tag }: ReactComponentNodeStyleProps<TagType>) => (
     <g>
       <rect width={width} height={height} fill="blue"/>
       <text y="10">{tag.name}</text>
     </g>
  )
const style = new ReactComponentNodeStyle(MyNodeTemplate)
const tag: TagType = { name: 'yFiles' }
graph.createNode({ style, tag })
Automatic Graph Layout
Often, connected data does not contain positional information and relies on the user or the application to arrange the elements in a meaningful way.
yFiles’ sophisticated layout algorithms provide arrangements for many different use cases out of the box, each of which can be configured to match specific requirements.
Use-case-specific React components with yFiles integration
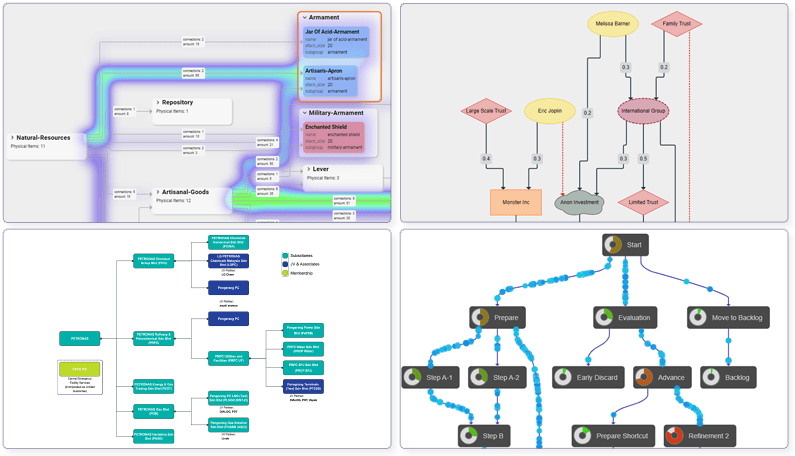
An easy way to integrate an interactive diagram component in your React application are the ready-to-go yFiles React Components. Whether you’re visualizing organizational structures, mapping out intricate supply chains, creating professional business ownership charts, or process mining visualizations, our easy-to-use React components bring the power of yFiles graph visualization into your React applications:

These open-source React components wrap yFiles with the above-mentioned approach and provide a use-case-specific interface with preconfigured automatic layout options to match your needs. Each React component comes with extensive documentation and live playgrounds that demonstrate the various features and the versatile API.
After adding a component as a dependency to your React application (see also the Getting Started sections of their documentation), you just need to include it in your template and provide some data to embed an interactive diagram. For example, to get started with the supply chain component, all you need is the following snippet:
function App() {
 registerLicense(yFilesLicense)

 const data = {
   items: [
     { name: 'Copper-Ore', id: 1, parentId: 3 },
     { name: 'Copper-Plate', id: 2, parentId: 4 },
     { name: 'Resource', id: 3 },
     { name: 'Material', id: 4 }
   ],
   connections: [{ sourceId: 1, targetId: 2 }]
 } satisfies SupplyChainData<UserSupplyChainItem, UserSupplyChainConnection>

 return  <SupplyChain data={data}></SupplyChain>
}
Try it directly in your browser in the online playground.
Examples and Source Code
Blueprint repo
You can find the blueprint for a complete, working sample application in this GitHub repository:
Demo apps
yFiles for HTML comes with React sample applications out-of-the box that show how to integrate yFiles for HTML in a React project by simply adding yFiles as npm module dependency.
The source code of thes demo application is available on the yWorks GitHub repository and part of the yFiles for HTML package.
AppGenerator for yFiles for HTML
The App Generator allows you to test and play with yFiles for HTML in a low-code environment: Build upon various example projects or start from scratch. Configure your data-sources, select the features you want for your app, preview and share the prototype.
Eventually, let the source code generator scaffold a bundle for you and your development team. The bundle includes a React-based diagram component with the features and functionality you configured in the generator.
yFiles for HTML in Your React Project
Test the yFiles for HTML graph visualization library with a fully functional trial package. The recommended way to use yFiles for HTML in a React application is shown by the React source code examples that are part of that package, but using the App Generator as described above is also a great way to start quickly.
If you want to start coding right away, though, follow these simple steps:
-
Download a trial version of yFiles for HTML.
-
Navigate to the source directory of the React Sample Application or one of the other React demo applications of yFiles.
-
Inspect the sample application’s documentation and
-
copy its build configuration and its React sample graph components to your project or
-
adjust its source code to match your requirements.
-
Alternatively, the yFiles React Components offer ready-to-go, versatile React components that easily integrate in existing React projects.
