Smooth Visualization of Big Data Structures
Find out how to efficiently visualize large network diagrams
Internet technologies like social networks, knowledge graphs, and other big data applications are on the rise. In addition to storing and processing the data, it is often necessary to visualize this data as a diagram that humans can view and analyze. However, this can be a challenging task, since visualizing large data sets tends to pose various challenges.
Reduce the Displayed Data: Use a Drill-Down Approach
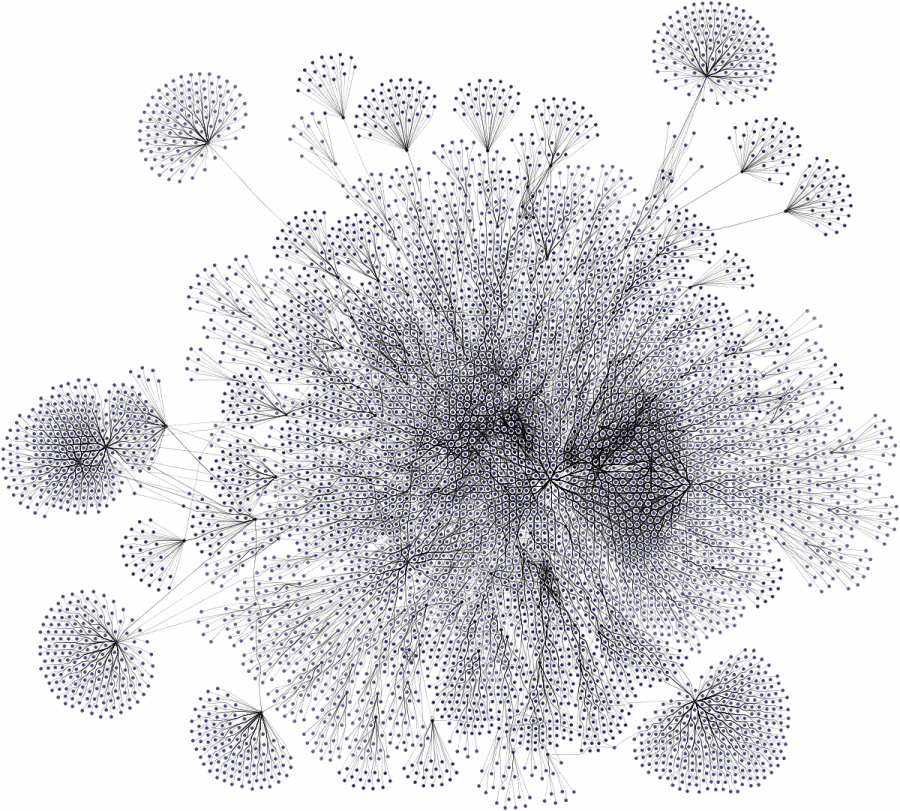
First of all, it should be evaluated whether it makes sense to display a vast amount of diagram elements at the same time. In many cases, the data can be reduced to a relevant subset, which improves visual cluttering and makes the relevant data easier to understand. Displaying all the data at the same time in contrast often leads to visual clutter, and a typical “hairball” graph that might look impressive, but does not provide much insight to the viewer.
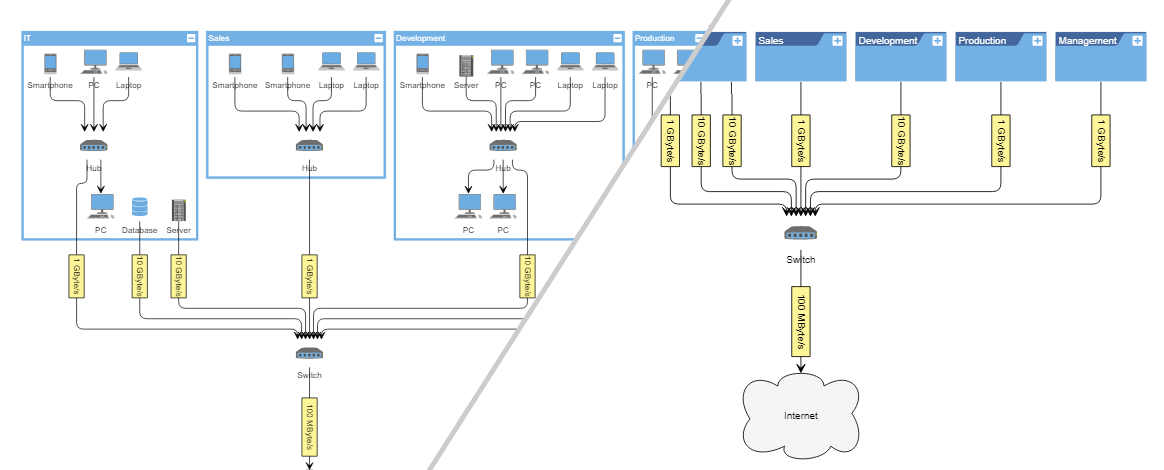
There are several approaches to reduce the data, like filtering, drill-down, merging of elements, or a combination of those. Which strategy fits a use case best depends on the nature of the data and the goal of the visualization, i.e., what aspects of the data should be pointed out.
In some cases, however, displaying a large number of elements at the same time is unavoidable. If users have not considered this necessity when designing the code that generates the diagram visualization, it can lead to serious performance issues. However, there exist several optimization strategies when processing the diagram data, which can prevent such performance problems.
How to Optimize Visualization Performance
The root problem of visualizing large data sets is the rendering of a sheer amount of elements. It might still be feasible to generate a static picture, but an interactive scenario, where items can be added, modified, and removed, is more challenging. The visualization has to be updated each time the data changes, while it still has to offer acceptable performance, i.e., high frame rate and responsibility.
There exist a few general optimizations that can apply to almost any case and some that apply only to specific scenarios. In general, the best-suited strategy depends on the exact use case.
Choose a Fast Enough Rendering Technology
Depending on the platform, there might exist several visualization technologies that offer high rendering performance. Some might produce a higher-quality rendering with features like vector graphics, anti-aliasing, others might provide better performance with concessions to rendering quality. For large diagrams, users have to choose a suitable rendering technology that provides reasonable performance and produces an acceptable quality at the same time.
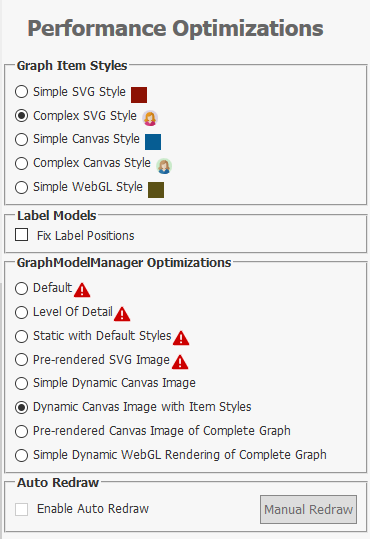
For example, modern browsers provide several ways for web applications to visualize data. SVG is a technology that produces high-quality, scalable, and printable renderings. However, due to the amount of DOM objects, SVG can easily lead to performance issues when displaying a large number of elements, especially if they have to be updated frequently. In this case, switching to canvas rendering, which draws all elements into one canvas DOM element, can be a better option since it can significantly improve performance. The drawback is that in this case, users lose the scalable vector graphics of SVG. Another option is using WebGL rendering that utilizes the PC’s graphics processor. Similar technologies are available for other platforms as well. In general, it’s a tradeoff between choosing the technology and settings that are good enough in performance and still provide a reasonable graphic quality.
Carefully Choose Diagram Item Visualization
When rendering many elements, the visualization of each item must not be too complicated. For example, a drawing that performs perfectly fine with 100 nodes can lead to issues in the case of 1000 nodes. Usually, drawing a simple rectangle performs better than using a complex visualization with a lot of rendered objects. Thus, users have to make sure that they don’t use high-resolution images where it is not necessary. Especially text rendering can easily lead to performance issues. So users have to find a balance between appealing item visualizations that convey all the relevant information and simple enough drawings to ensure satisfying performance.
Reduce Visual Complexity With Level of Detail Rendering
Level of Detail rendering is a great approach to improve visualization performance without losing any details. It allows using complex item visualizations while at the same time provides high performance.
This technique applies to diagram applications where the user can zoom the diagram. The idea is to render the item details only when zoomed-in above a certain threshold and switch to a simpler visualization when zoomed-out. When zoomed-in, fewer items are visible on the screen and have to be rendered at the same time, thus making it possible to use a more complex visualization without affecting performance too much. When zoomed-out, more items are visible and have to be rendered, making it necessary to switch to a plain visualization.
Usually, there is a zoom level below which the text on diagram items is not readable anymore because it gets too small. In this case, the text can safely be hidden without losing any information. Once the user zooms-in above the threshold, the text becomes visible again. This approach can be applied to any visual elements to reduce the complexity of the drawings and improve performance.
Level of Detail can also be applied to the rendering technology mentioned in the previous section. For instance, a web application can switch from high-quality but slow SVG rendering to high-performance, but visually simpler WebGL rendering when the user has zoomed-out below the threshold. The visualization can benefit from both technologies, i.e., high-quality rendering when zooming-in on details and high-performance when zoomed-out to get the overview.
Only Draw What’s Needed
A diagram application should only render the parts of the diagram that are currently visible on the screen. The items that are outside of the view box should not be rendered at all, which is usually already the default behavior if someone uses a high quality diagramming tool or library.
Also, when using a visualization technology that works with objects, like WPF, JavaFX UI controls, SVG, etc., the rendering code should make sure that it updates only the necessary parts of the visualization at each render cycle. In the best base, only the recently modified properties are updated to the new values so that the rendering engine can use its caching mechanisms to a maximum. In the worst case, the whole object tree representing the diagram is re-created at each render cycle, which usually results in a significant performance decline.
Using Static Drawings
For some applications, where the underlying data does not change too often, it can be a viable solution to use a static drawing (either vector or pixel image) to display the diagram. This static image is created once at the beginning and can be updated when the data changes. This approach results in a high performance since only a single image has to be rendered. Changes to the data might be displayed with a latency since the whole image has to be re-created.
Use a Diagramming Tool That Provides Performance Optimizations
yFiles is a commercial programming library explicitly designed for diagram visualization. It supports all of the performance optimization strategies described in this article. Due to its generic nature, it gives users the freedom to visualize any connected data. Also, it provides features that help to reduce a large diagram to the relevant parts, like grouping, folding, and filtering.
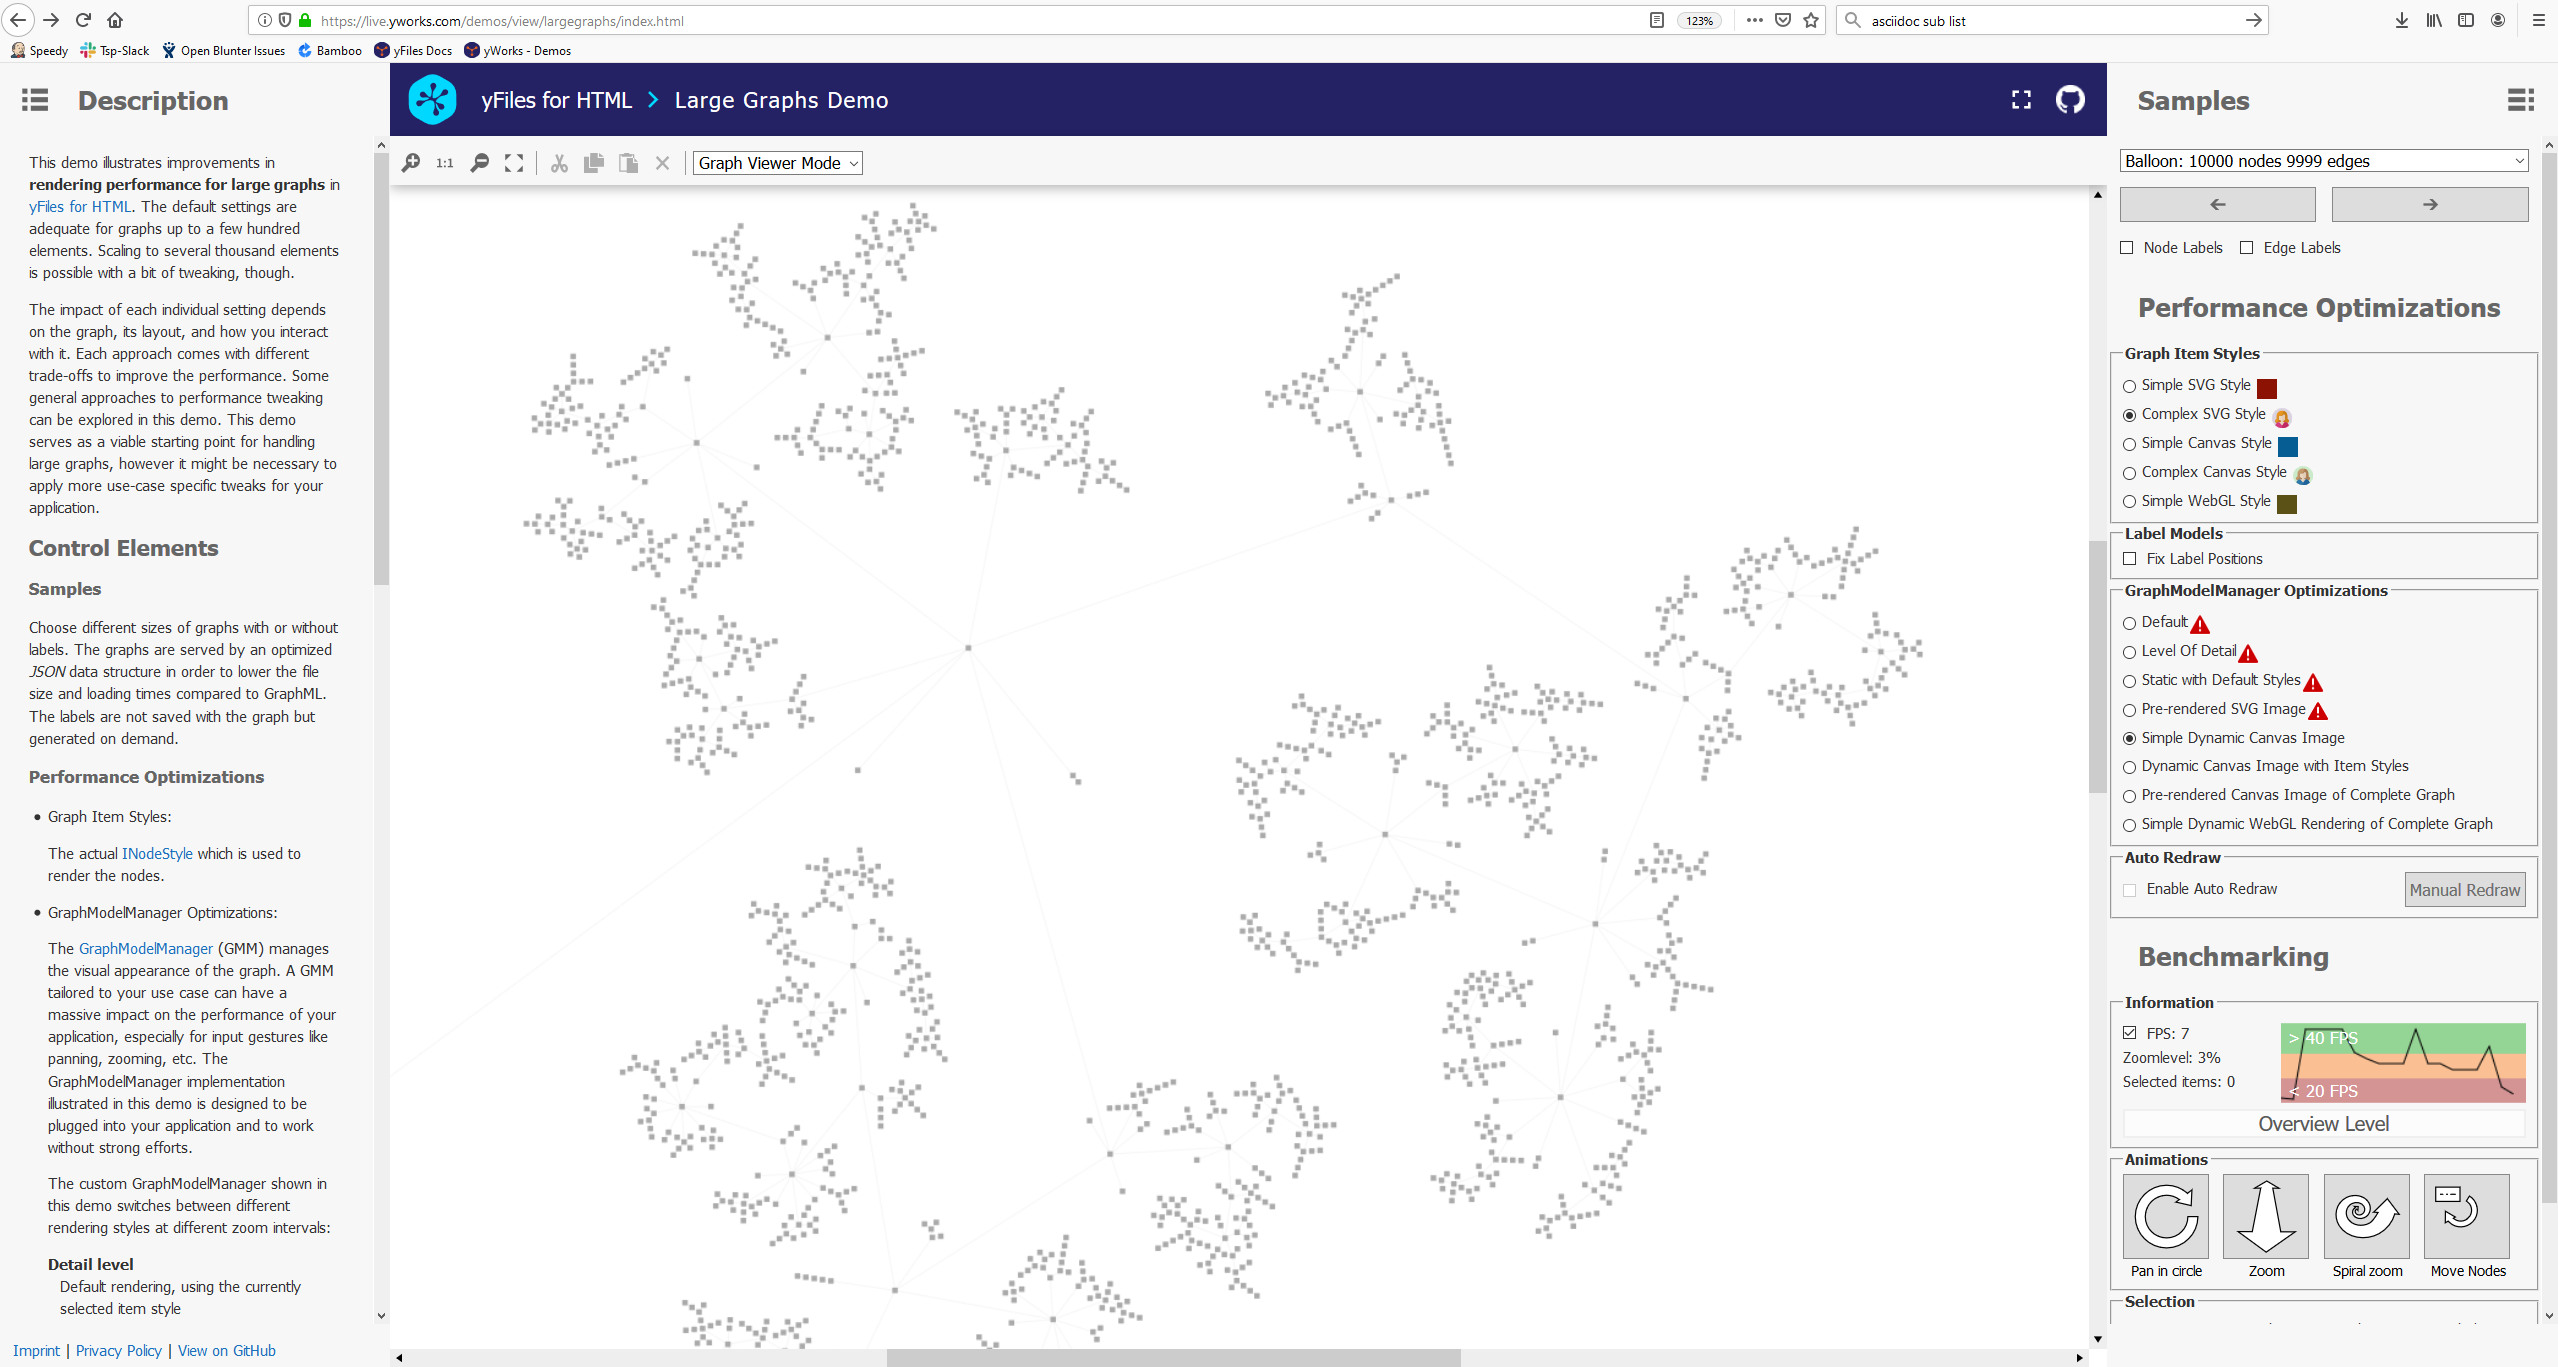
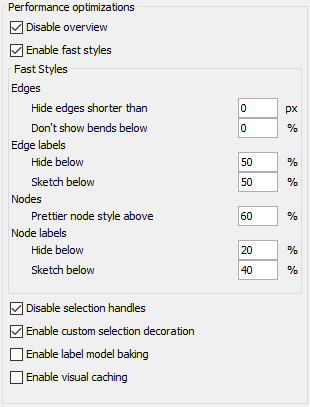
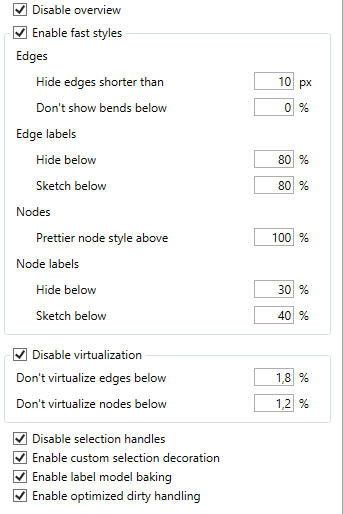
A Rendering Optimizations Sample Application is part of yFiles for all platforms except WinForms. This example application allows interactive exploration of standard approaches to performance tweaking. The available settings are platform-specific.
Optimizing Layout Calculation
Automatic layout algorithms calculate suitable locations for the graph elements and, thus, help to gain insight into the visualized data and reveal information about the underlying structure in a fast and easy way.
Note that there are many different types of layout algorithms with different capabilities and drawing styles. Of course, in general, the runtime increases with the graph size. However, while some of the algorithms are quite fast, even for large graphs, others are quite slow and only suitable for diagrams with up to a few hundred elements.
Most of the various layout algorithms provided by yFiles support the specification of a preferred time limit called maximum duration. Dependent on the specified time as well as graph size, the layout algorithm can automatically adjust its internal settings and skip/disable some of the optimization steps. This option significantly reduces the runtime for large graphs even though it may still exceed the maximum duration since the layout algorithm always has to find a valid solution. Note that, in general, quality and runtime are conflicting objectives and, thus, limiting the runtime usually reduces the layout quality. While for smaller graphs, quality is often the main objective, the required runtime gets more critical for larger ones where the primary focus does not lie in showing every detail.
Run the Layout Styles Showcase Application that comes with yFiles to see all of yFiles’ layout algorithms in action.
Examples and Source Code
On all platforms except Windows Forms, yFiles comes with the Rendering Optimizations Sample Application that demonstrates standard performance optimization strategies. The Layout Styles Showcase Application is available for all yFiles platforms.
The source code of these sample applications is part of these yFiles packages and available on the yWorks GitHub repository:
-
yFiles for HTML: Large Graphs Sample Application, Rendering Optimizations Sample Application, Layout Styles Showcase Application
-
yFiles WPF: Rendering Optimizations Sample Application, Layout Styles Showcase Application
-
yFiles.NET: Layout Styles Showcase Application
-
yFiles for Java (Swing): Rendering Optimizations Sample Application, Layout Styles Showcase Application
-
yFiles for JavaFX: Rendering Optimizations Sample Application, Layout Styles Showcase Application

