Smooth Visualization of Large Diagrams in JavaScript
Find out how to efficiently visualize large networks in JavaScript
When visualizing large amounts of data in a diagram, one almost inevitably will face performance problems. It is, however, possible to make adjustments to improve the performance for large data sets. Potential for optimization is a result of the fact that large graphs have different visualization requirements than smaller ones:
-
No interaction: Usually, interactions can be disabled for large graphs since it doesn’t make sense to manipulate elements that are only a few pixels in size. As a result, it is possible to disable expensive hit tests or complex highlight rendering.
-
Varying levels of detail: When the diagram is zoomed-out to a large extent, elements are very small, and details are not visible. This fact allows for a more simple rendering:
-
No unnecessary details: Render elements as simple, flat geometric shapes.
-
No text: If it is not readable, don’t bother rendering it.
-
No connections: If the zoom level is small enough and the graph is already organized in clusters, remove the connections.
-
-
Only draw visible elements in the zoomed-in state: In the zoomed-in state, on the other hand, one has to show all details. However, there are only a few elements on the visible area, so we can disable rendering elements that are currently not visible. This concept is the so-called “virtualization” that is already supported by many platforms.
Performance Tuning
yFiles is a commercial programming library explicitly designed for diagram visualization. With yFiles, the default settings are adequate for graphs up to a few hundred elements. Incidentally, this is usually the scale of graphs where users can still understand what they see, while meaningful editing is still possible. yFiles does support much larger diagrams with a bit of tweaking, though. The impact of each setting depends on the graph, its layout, and how you interact with it. Each approach comes with different trade-offs to improve performance.
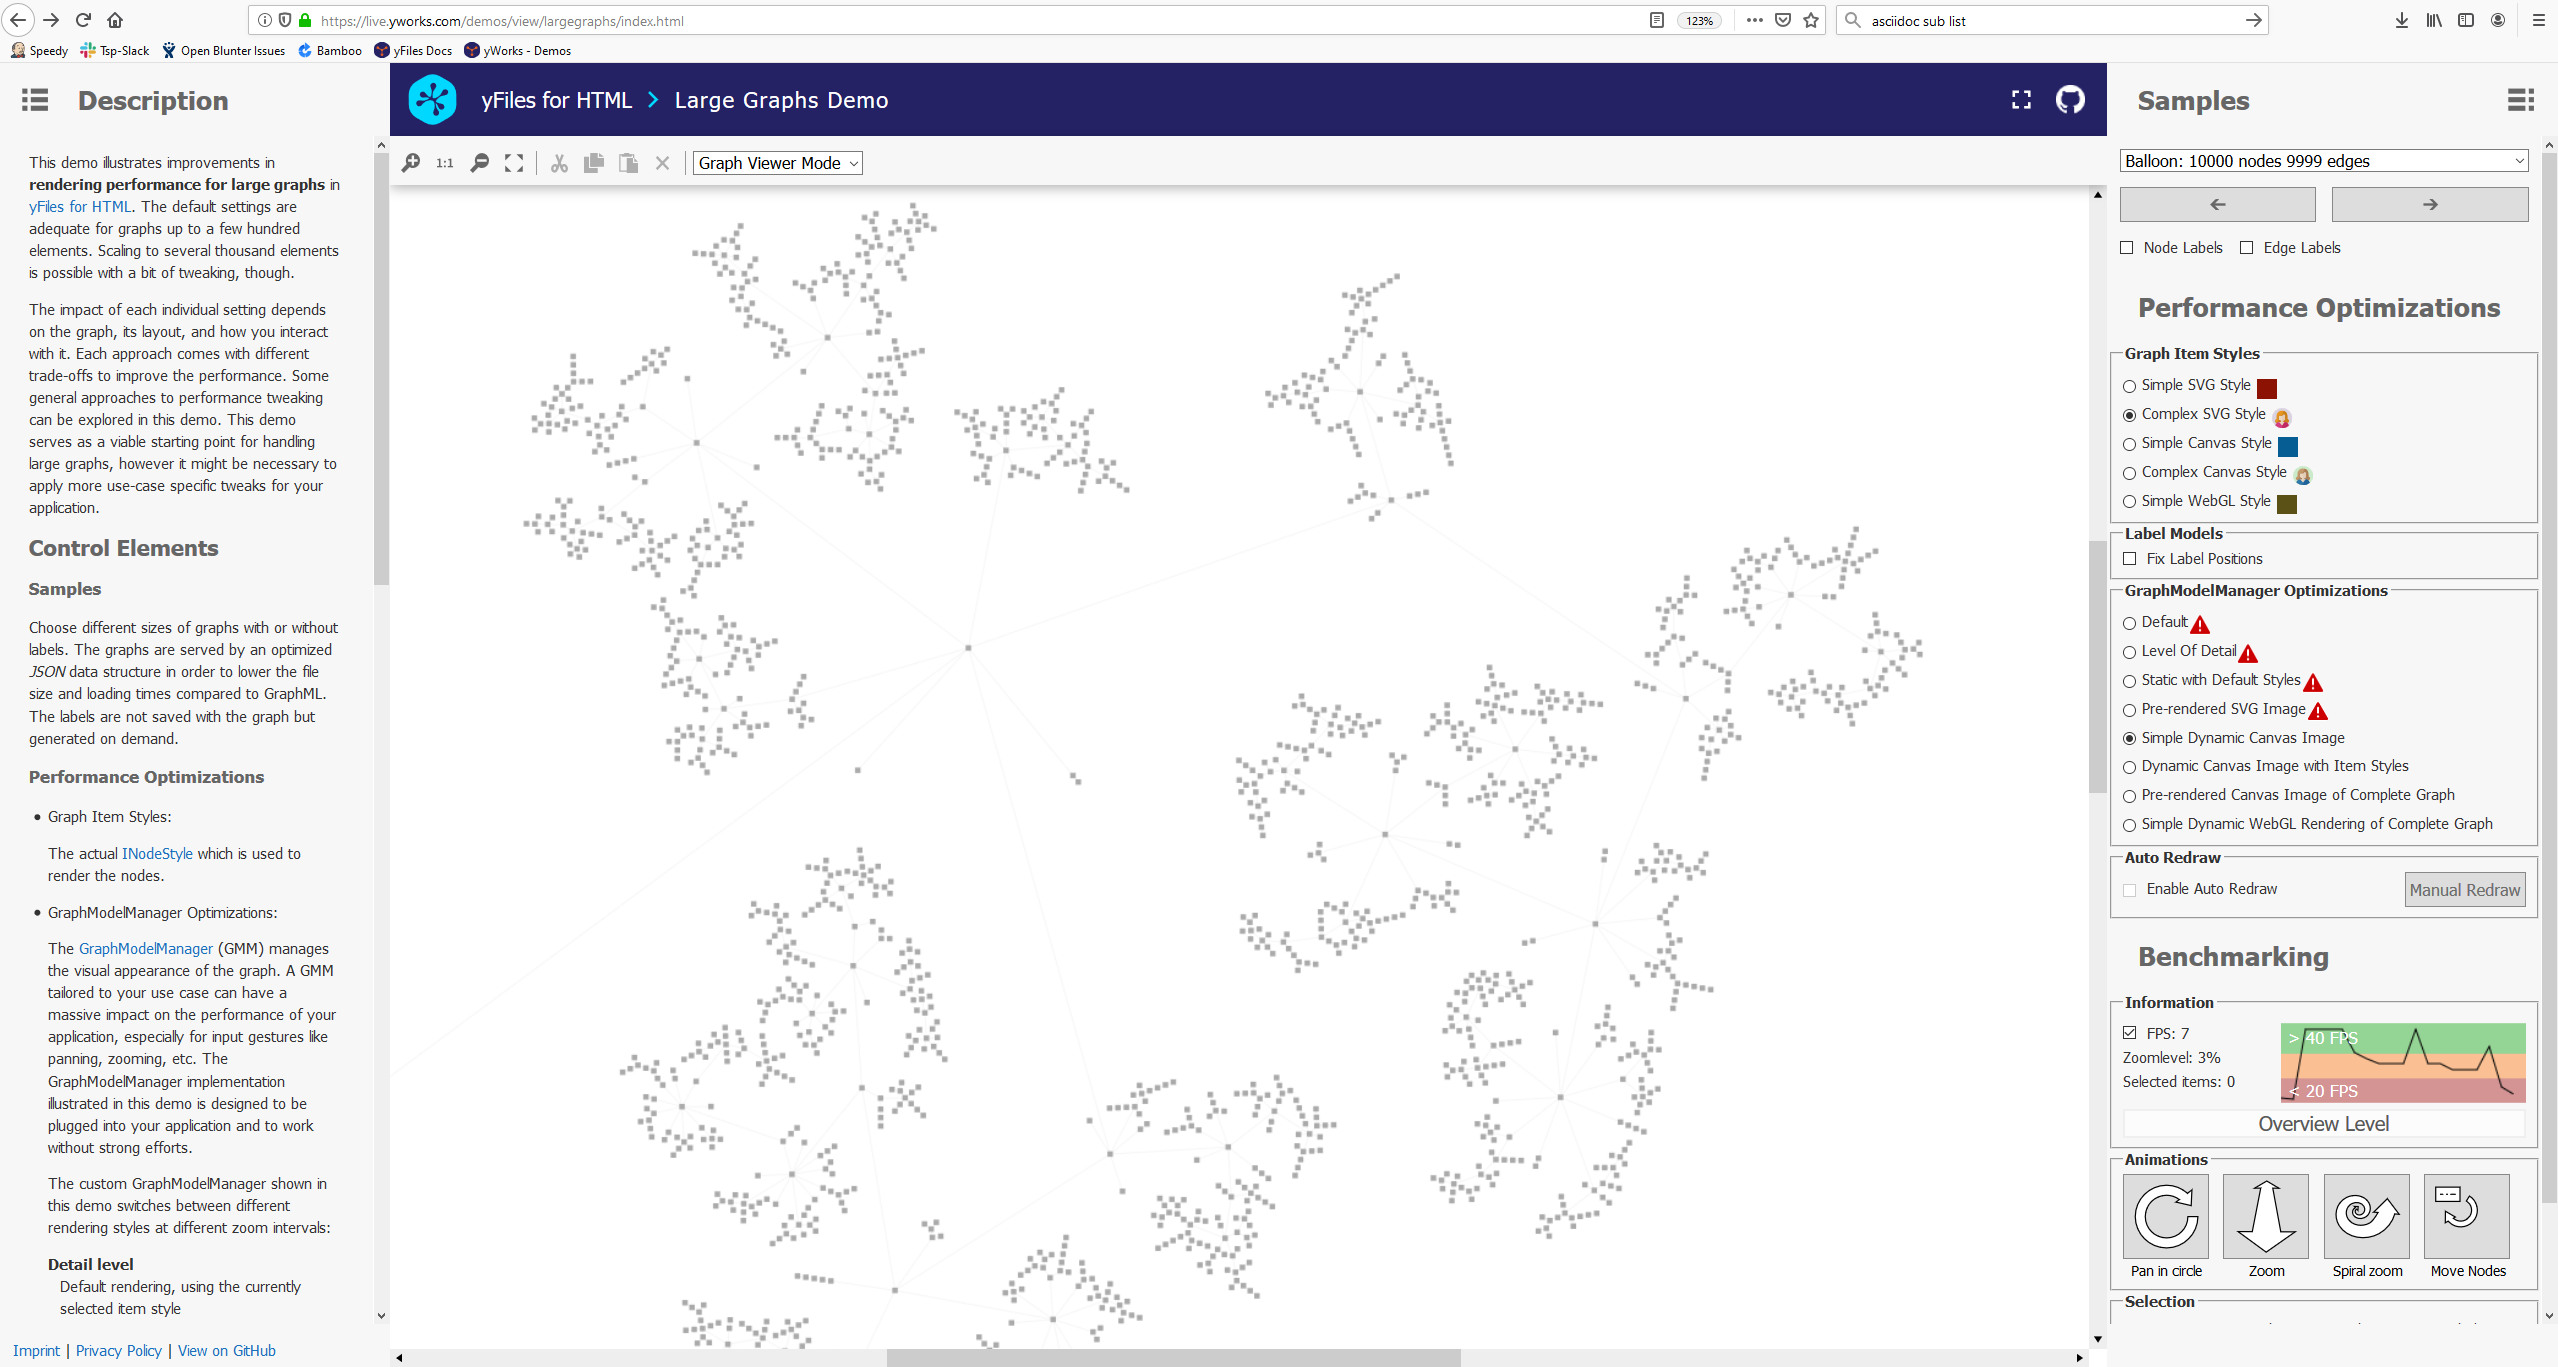
Since potential performance optimizations are so intricately linked to the graph and the desired interactions, there’s no single best configuration for all cases. The Rendering Optimizations Sample Application allows you to explore different approaches to tweaking performance interactively. This example is part of yFiles on all platforms except yFiles.NET.
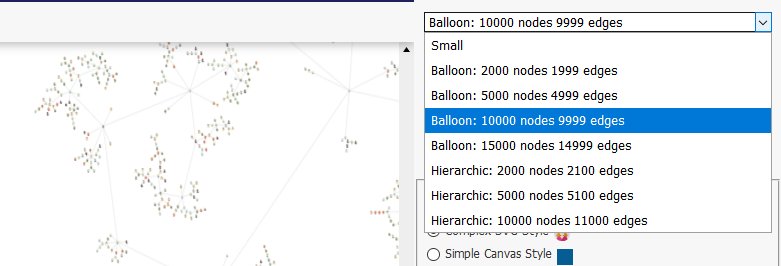
The example provides sample diagrams with up to 15000 elements with and without labels.
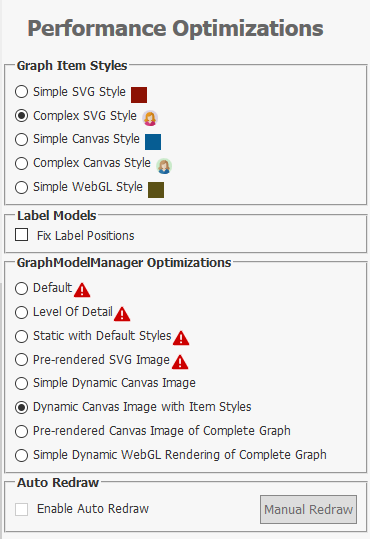
The most common settings which have an impact on performance can be turned on or off easily. Some settings are marked as not recommended because of (possible) slow performance for the typical gestures or (potential) memory shortages. However, users can try each configuration despite the warnings.
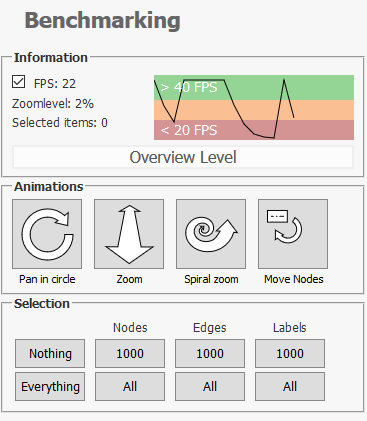
A Benchmarking section provides a means to compare the performance of different graph sizes and settings directly. An FPS meter measures the redraw frequency of the displayed diagram. An Animation and Selection subsection can be used to compare the performance during typical user interactions. The animations simulate specific interactions that can be problematic, depending on the settings.
Optimizing Your yFiles-powered Application
The example code in the Rendering Optimizations Sample Application is structured to allow easy re-use in your applications. Thus, users can apply the same optimizations that the sample application provides, and with little custom code, they can achieve satisfying performance in the vast majority of cases.
The Rendering Optimizations Sample Application can also help to determine what level of performance can be achieved in general with a graph of a given size. This provides a useful comparison for your application to highlight improvement opportunities.
Example and Source Code
On most platforms, yFiles comes with the Rendering Optimizations Sample Application. The available settings are platform-specific, as rendering mechanisms differ on each platform:

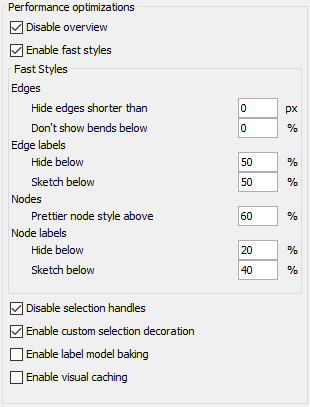
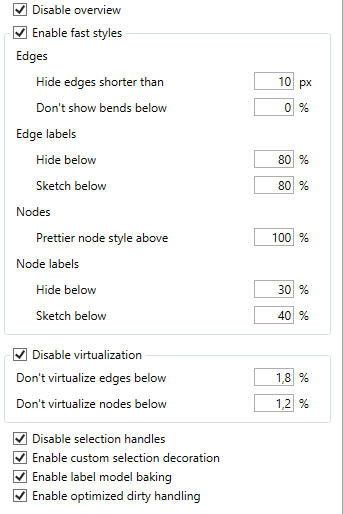
The source code of the Rendering Optimizations Sample Application is part of most yFiles packages and also available on the yWorks GitHub repository:

