yFiles React Organization Chart Component
Integrate organization charts in React applications using a powerful and versatile React component
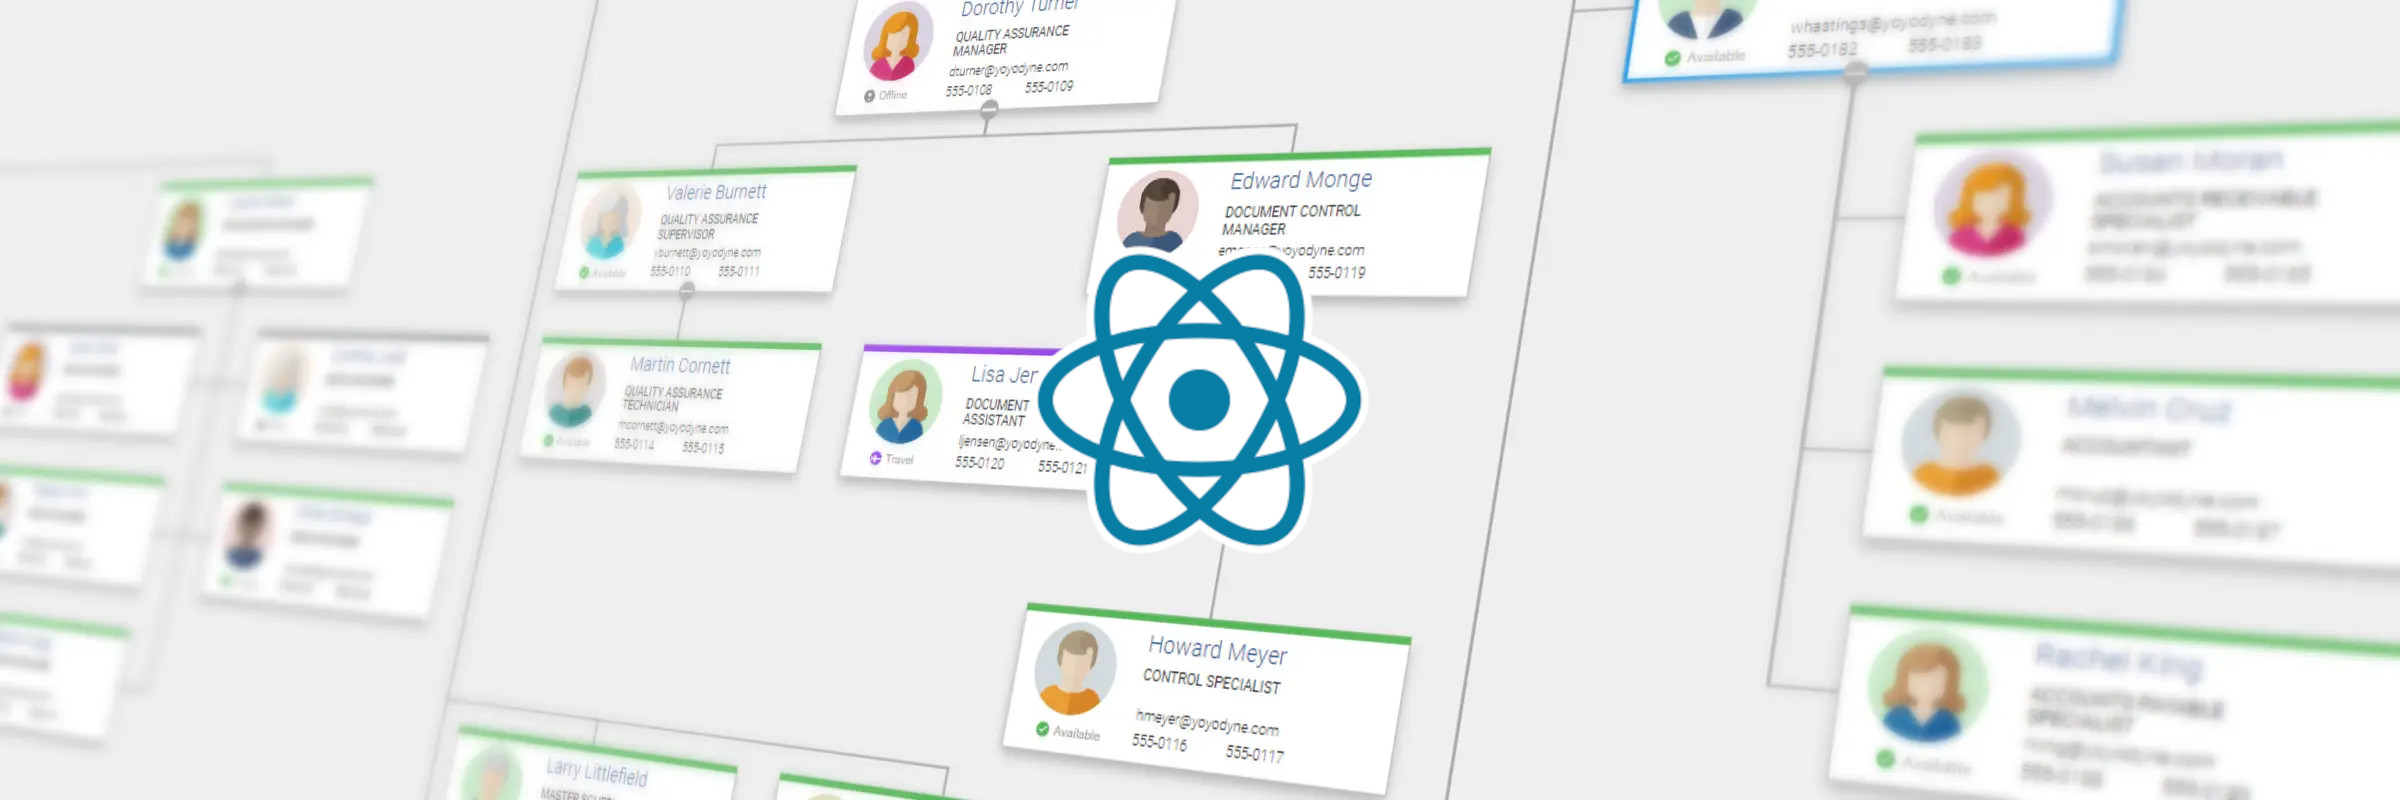
An organization chart (commonly referred to orgchart, organigram, or organogram) visually depicts the internal structure of an organization. It delineates the relations and hierarchy within an organization, with the members (e.g. employees, roles) usually represented as boxes.
These boxes may contain additional details such as their names, contact information, and occasionally images. Such a diagram usually has a tree structure, which itself constitutes a special kind of graph.
The open-source web application framework, React, continues to stand out as a top choice for web developers. However, building a visualizer or editor for organization charts in a React application can be challenging.
Developers can use various component frameworks that simplify the creation of modern web applications. Leveraging React’s component-based approach makes the tailoring to specific use cases much easier. In a web application that uses React, think of components as building blocks for different parts of the webpage.
yFiles for HTML offers a highly adaptable React component. This component is specifically designed to simplify the visualization of organizational charts within a React application.
What is yFiles exactly? Well, yFiles for HTML is a commercial programming library explicitly designed for graph, network, and diagram visualization.
Note that the word "graph" here refers to the mathematical graph with nodes and edges, rather than a function graph or bar charts.
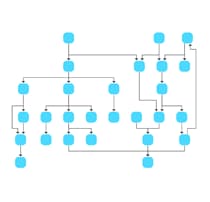
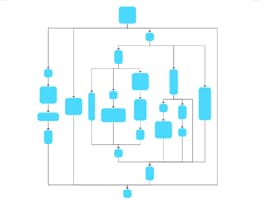
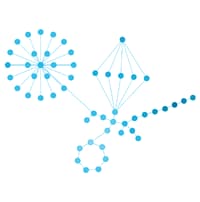
yFiles' built-in user input handling makes the graph visualization highly interactive with keyboard, mouse, or touch gestures.
Because of the flexible style options, the graph visualization can be tailored to any domain. Have a look at the various use cases yFiles can cater to.
And its sophisticated layout algorithms let you easily create clear, stunning, and highly complex graph visualizations.
Organization Chart Component Creation
In a React-based web application, data is commonly supplied to the organization chart component as props to facilitate its rendering.
Now, when we say "data is passed to the component," it means that the information about who works where in the company is given to this organization chart section.
This information helps the component create and show the chart on the webpage, displaying the structure of the organization visually.
Although yFiles for HTML can be directly attached to an asynchronous data provider, you can also supply data objects, such as JSON, which contain information. This data is then used to generate a diagram.
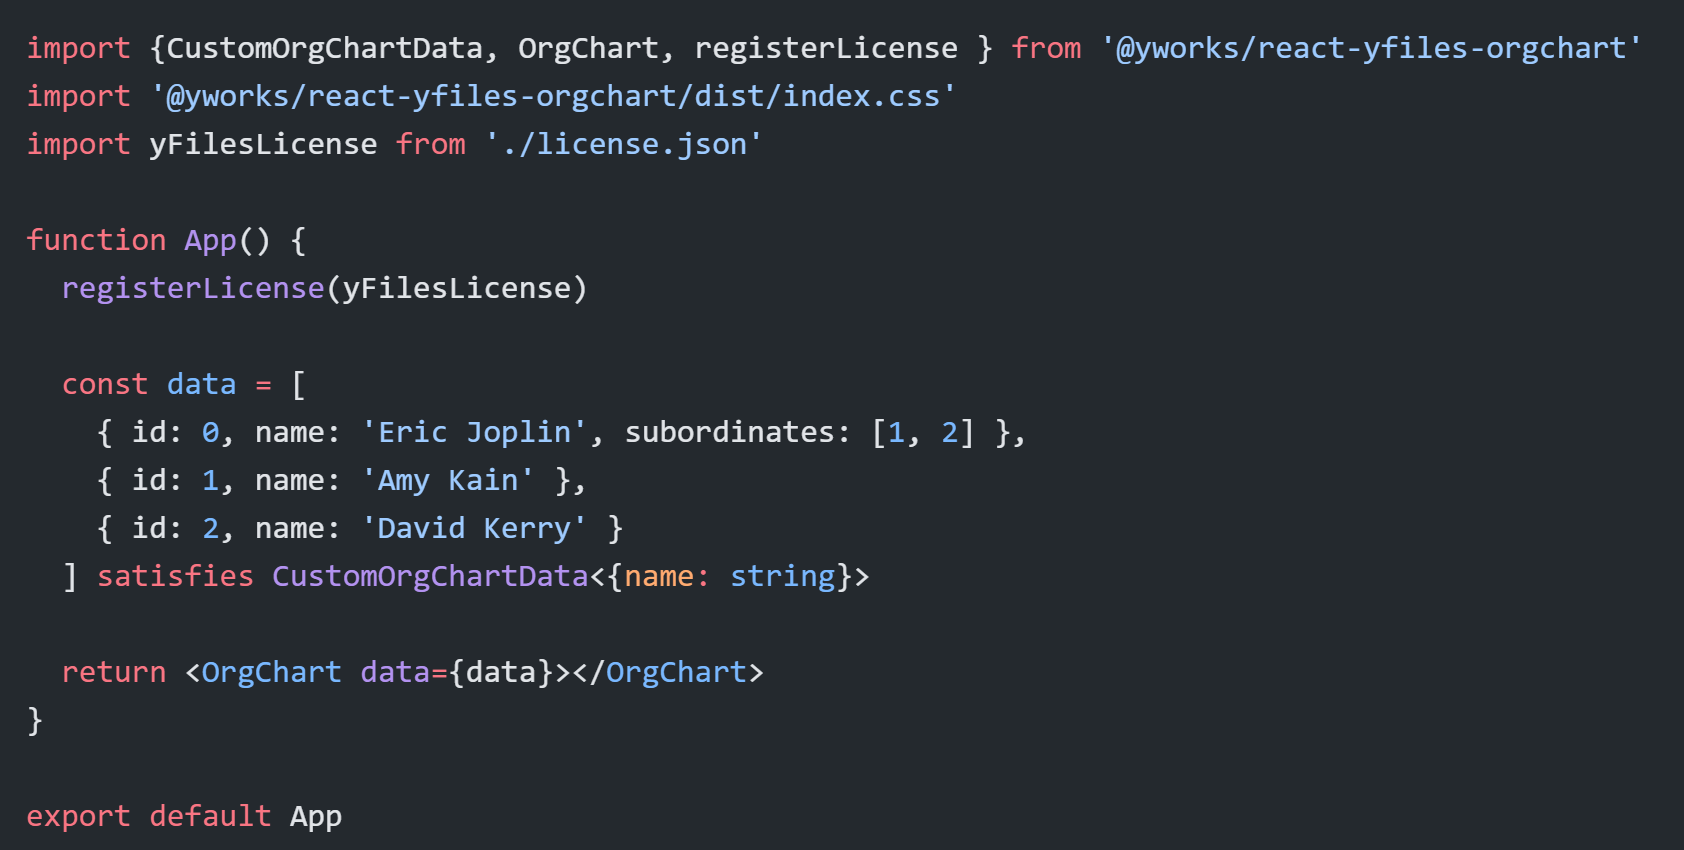
Integrating a sophisticated organization chart component in a React application is as easy as this:
Discover the yFiles React Organization Chart Component through the yFiles Playground, an optimal platform for getting acquainted with the component and its functionalities.
Visualizing the Members
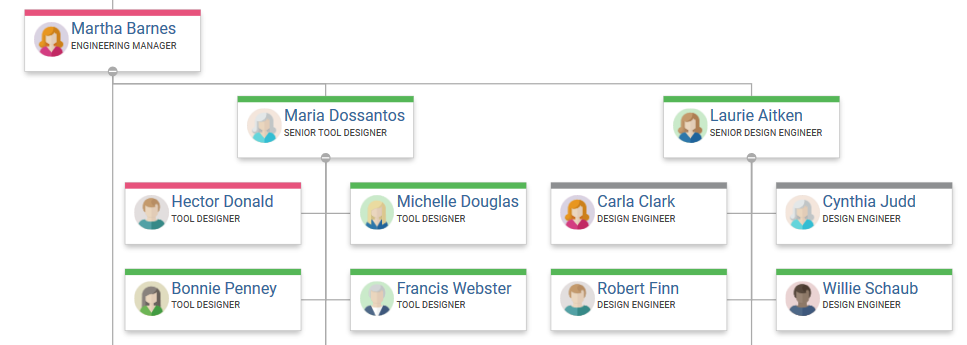
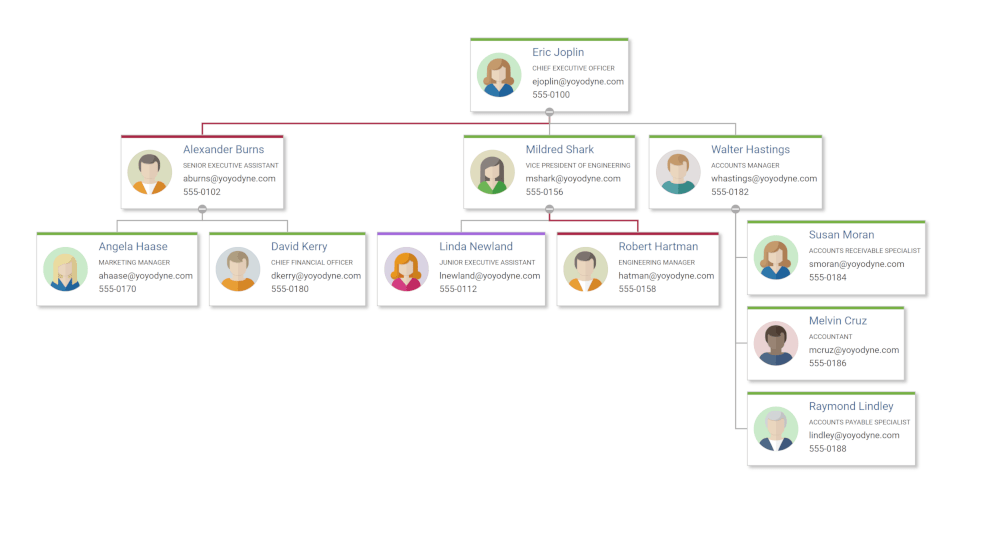
In the context of an organizational chart, it’s typical to represent a member, like an employee, using a box or card that displays additional details about that member, e.g., the member’s name.
In addition to the name, the usual content encompasses the member’s role, along with contact details like phone number and email address. Frequently, a photograph and additional information about the member’s present status are included to provide a comprehensive profile.
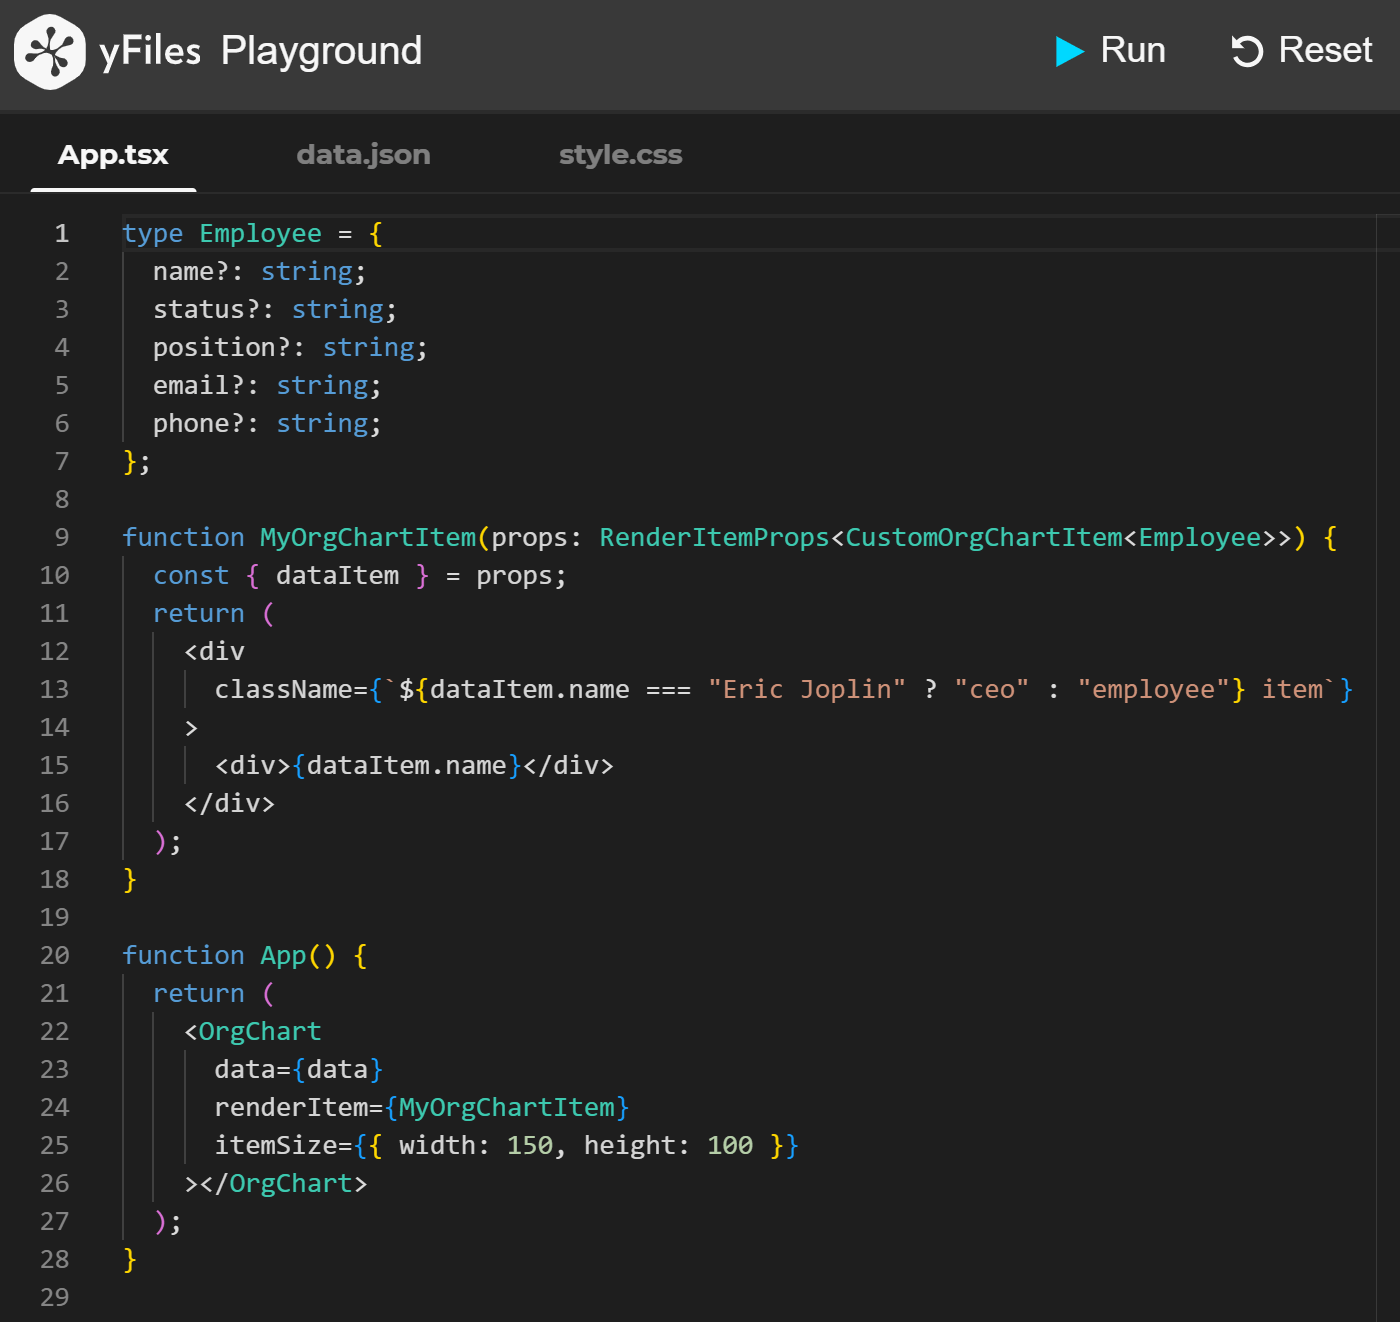
The yFiles React Organization Chart Component enables a high level of customization in visualizing items. This is achieved by utilizing custom React components to render items based on specific requirements.
The following code snippet exemplifies how this customization can be seamlessly integrated into your web application.
Furthermore, the yFiles React Organization Chart Component incorporates a rendering functionality, allowing users to tailor connection visualizations. This feature provides command over parameters like stroke, bend smoothing, thickness, and arrow styles for a more personalized representation.
Managing Large Organization Charts
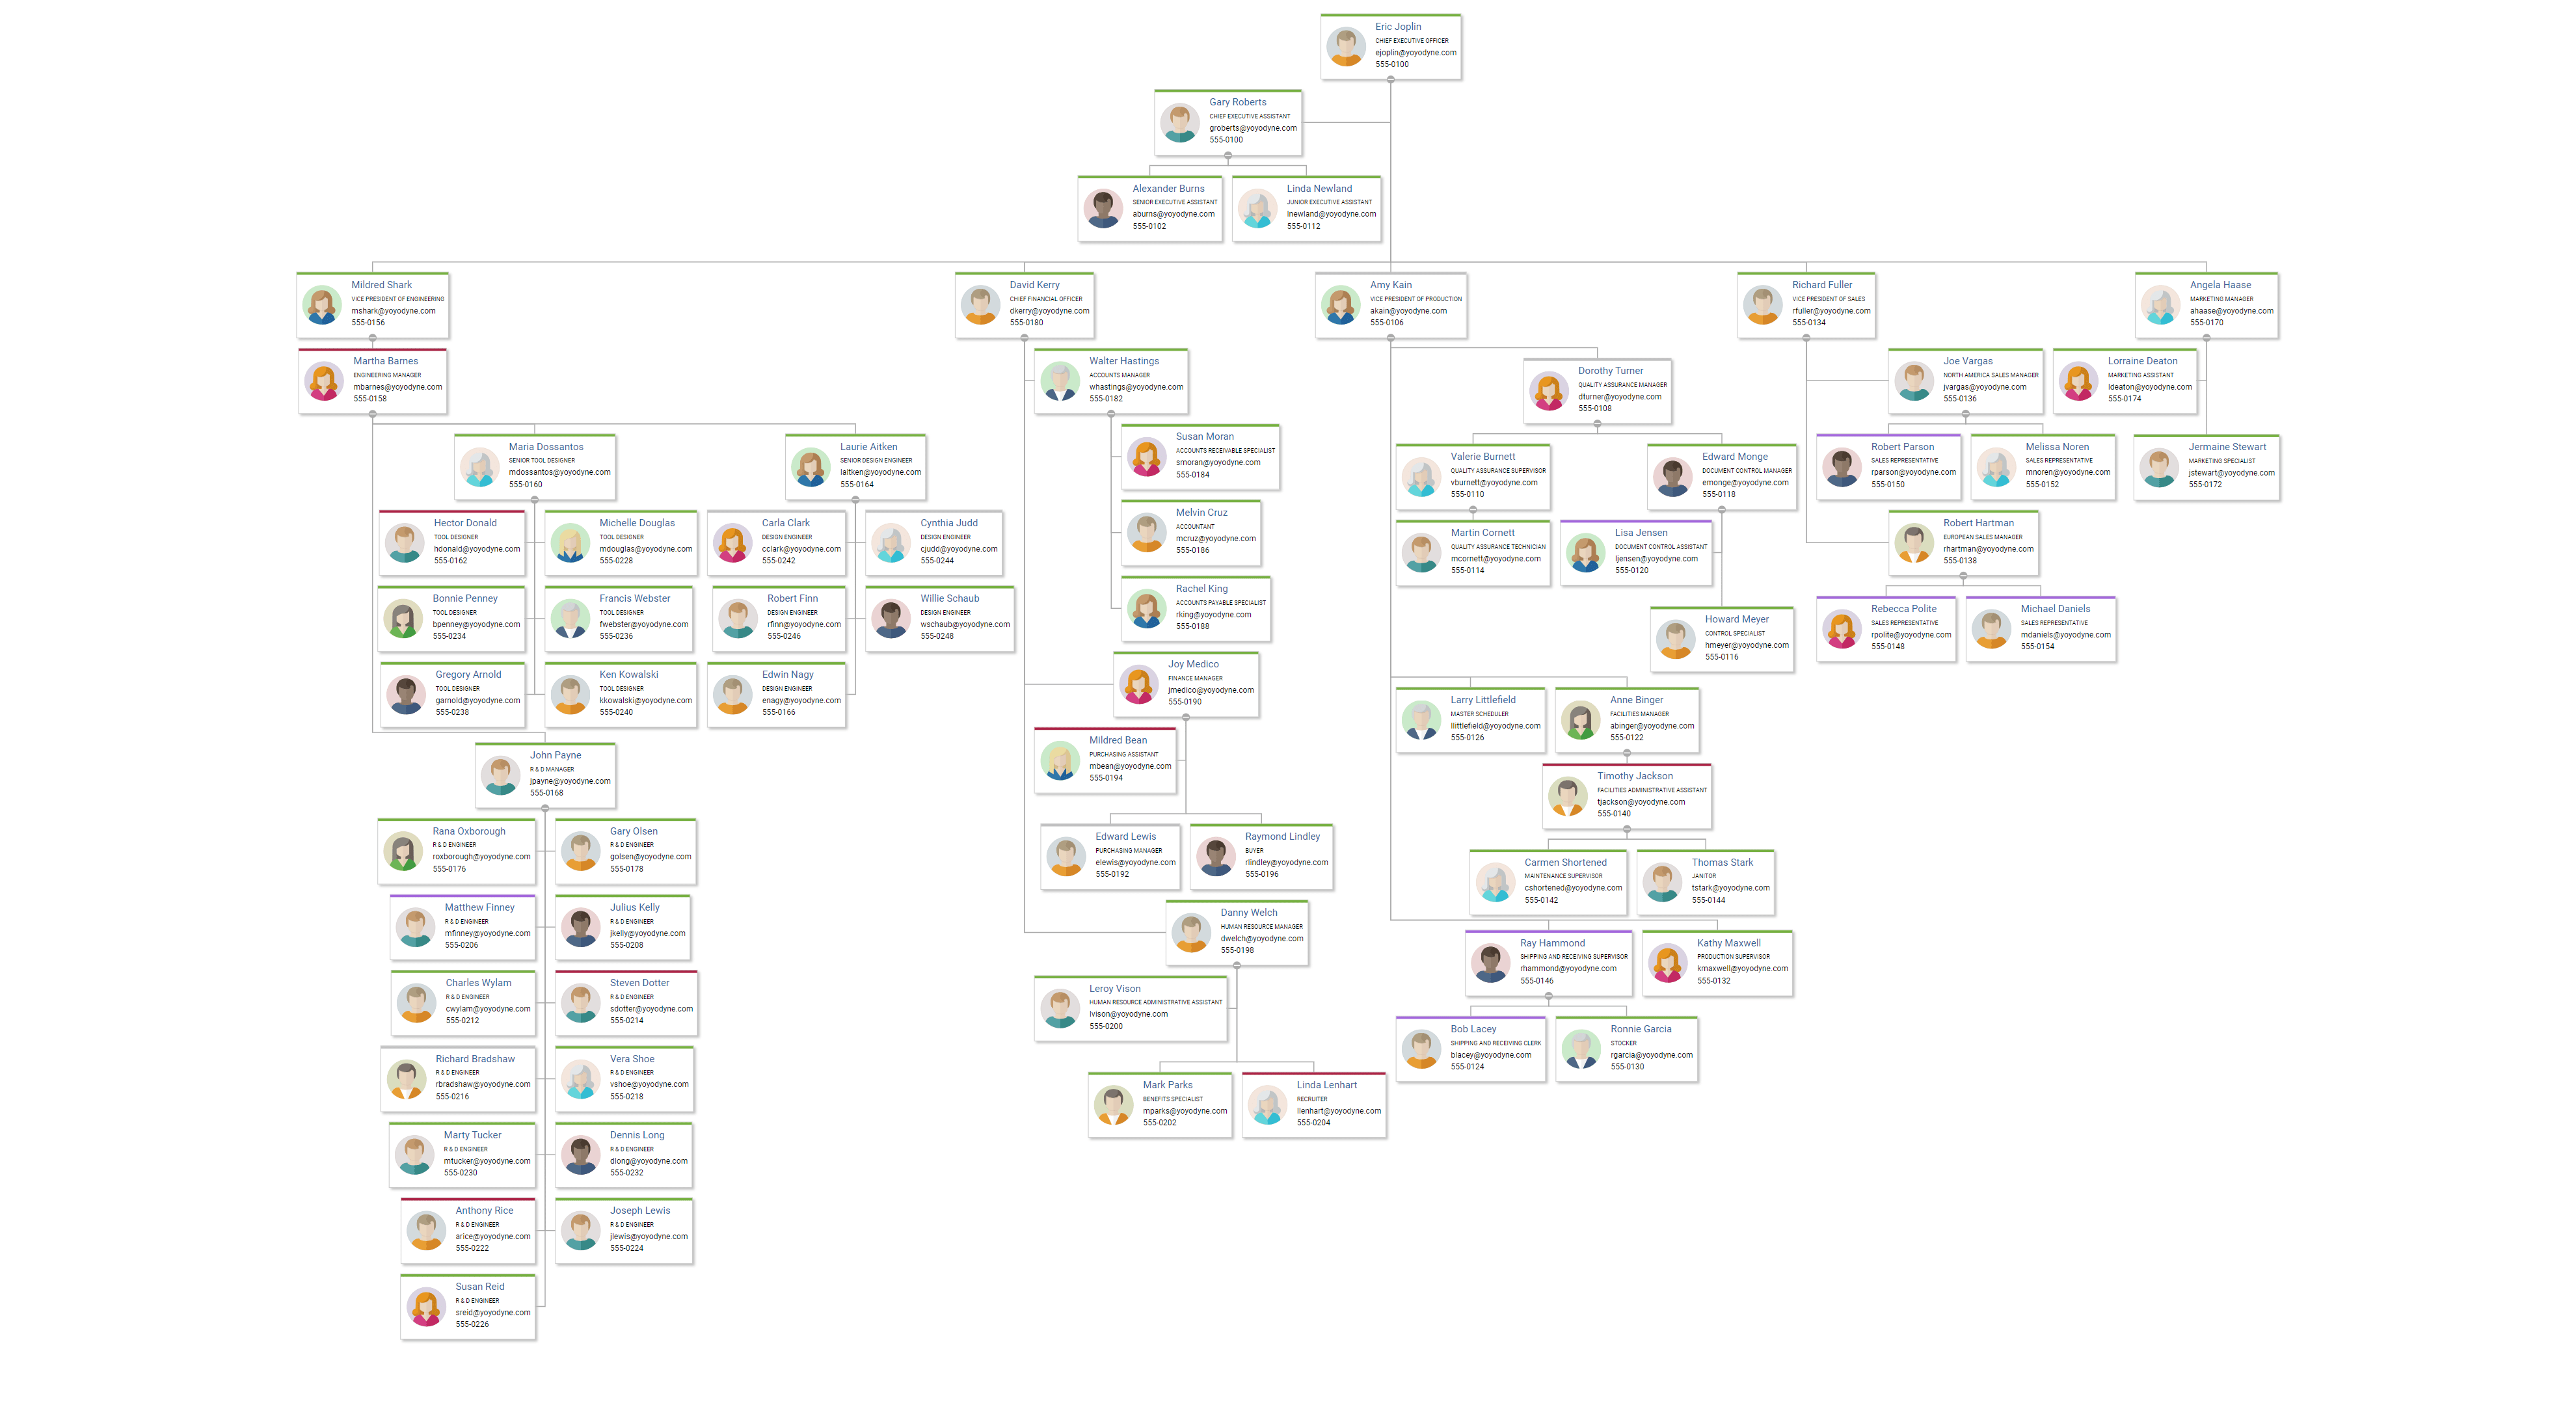
Extensive organizational diagrams, like those depicting the framework of a sizable corporation, have the potential to become densely populated and perplexing. Several techniques can be used to improve their readability.
Level Of Detail
Level of detail rendering is crucial for accelerating the rendering performance of the diagram. Therefore, adapting the displayed item information based on the zoom level becomes essential. Especially when working with large graphs.
For instance, in an organization chart, details like addresses and telephone numbers can be omitted to avoid unnecessary clutter. Such as in cases when you only want to get an overview of the diagram.
It might be more appropriate to disclose such information only when zoomed in to a certain level for better clarity and visibility. An advanced strategy involves representing individuals with simplistic icons when the diagram is zoomed out extensively.
In the yFiles React Organization Chart Component, you can accomplish this by utilizing a personalized React component for item visualization that adapts based on the zoom factor.
Collapsing of Substructures
When handling large diagrams, filtering out irrelevant data becomes crucial. Concealing multiple entities altogether can be convenient at times.
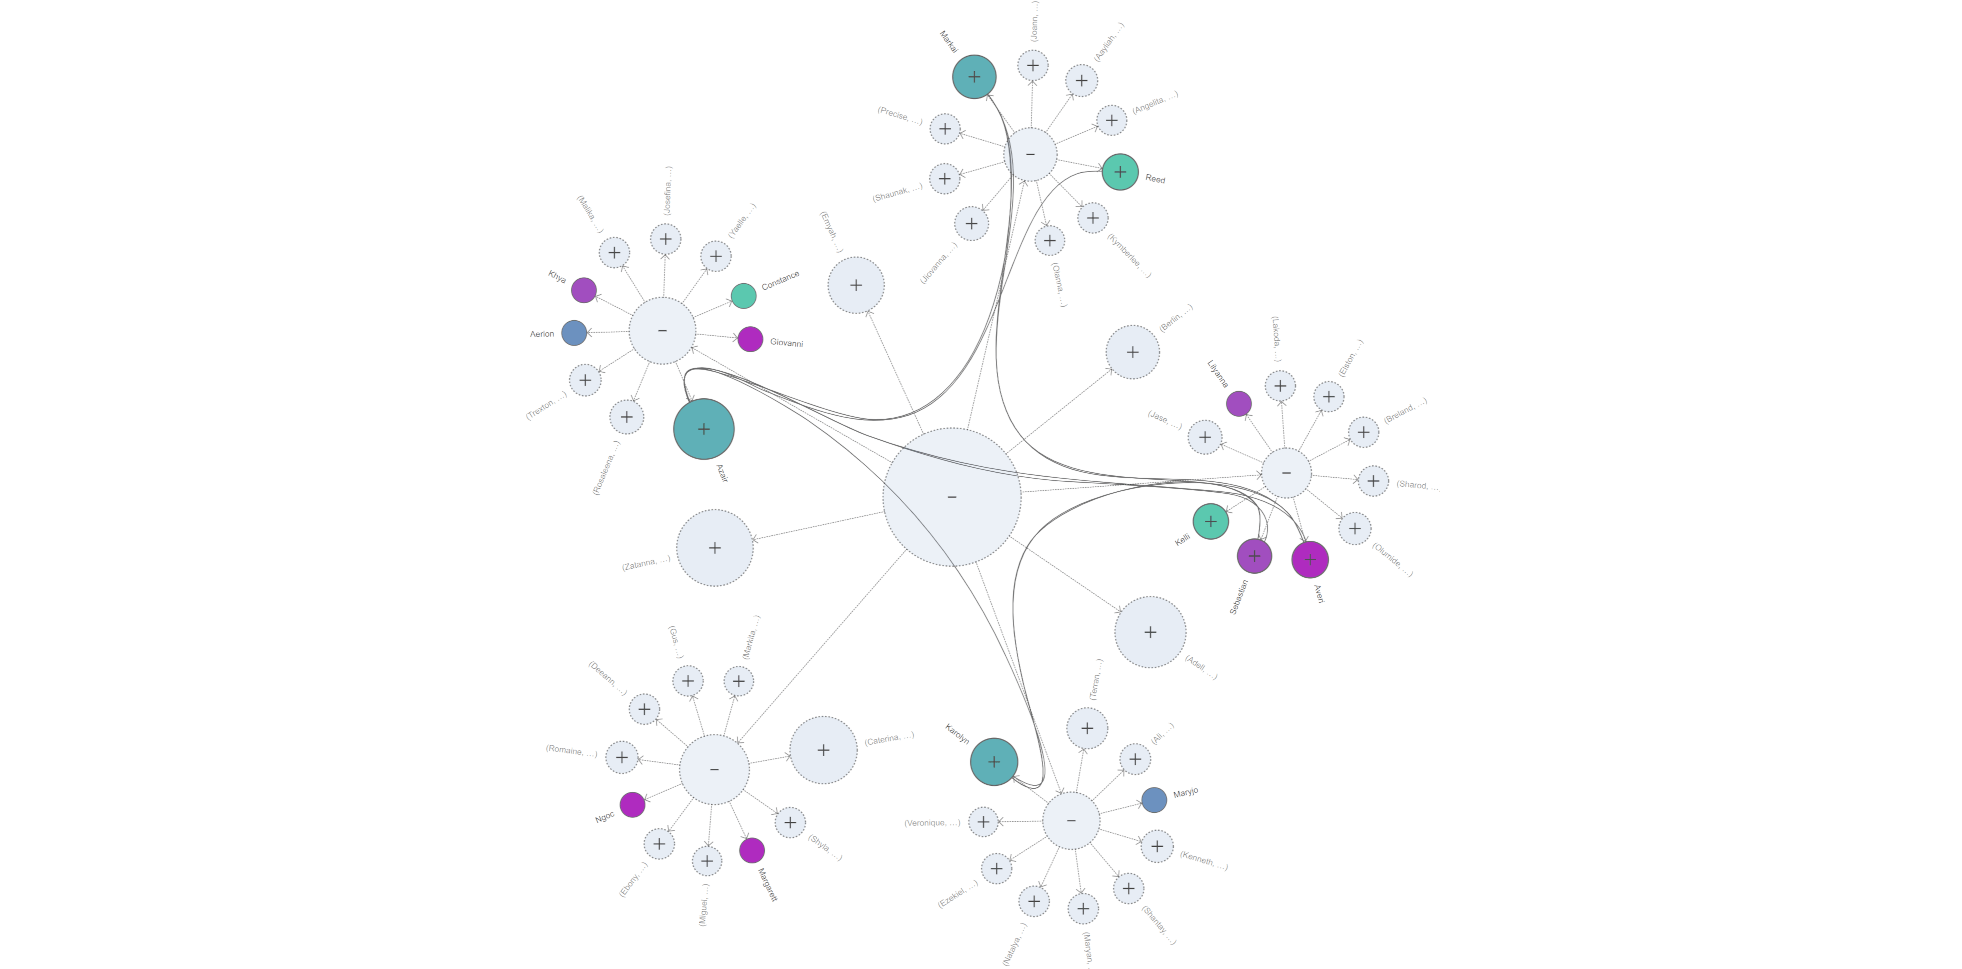
For instance, when presenting a broad overview of a company structure, hiding all nodes below the executive level is a common practice. Conversely, if the emphasis is on a specific branch, displaying the board of directors obviously becomes less relevant. Therefore, having the capability to hide both child and parent nodes of an entity is essential for effective and smooth diagram management.
The above example was created using the yFiles React Organization Chart Component. It leverages yFiles' filtering capabilities in conjunction with interactive elements, such as buttons, incorporated into the visualizations.
Additional Features
This yFiles React Organization Chart Component has many more additional features such as implementing popups, context menus, and tooltips on diagram items. Providing extensive customization choices for both functionality and visual presentation.
Moreover, the yFiles React Organization Chart Component even provides event notifications to alert users about focused, selected, or hovered-over items. This functionality offers flexibility in responding to state changes, enabling dynamic updates to external information panels and opening up various possibilities.
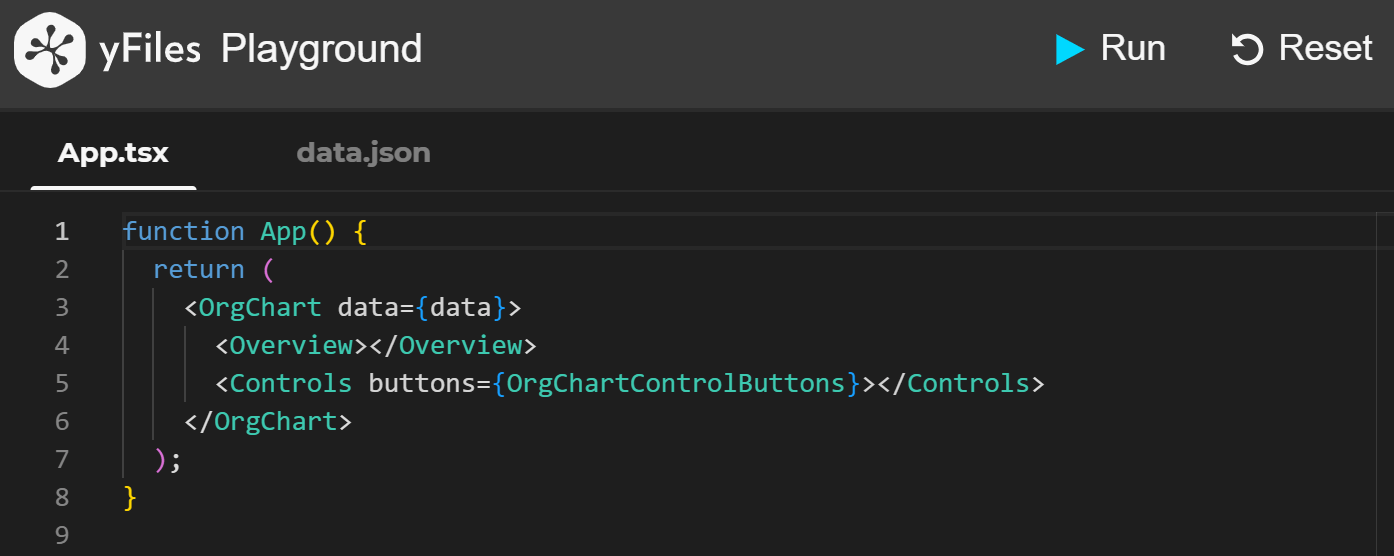
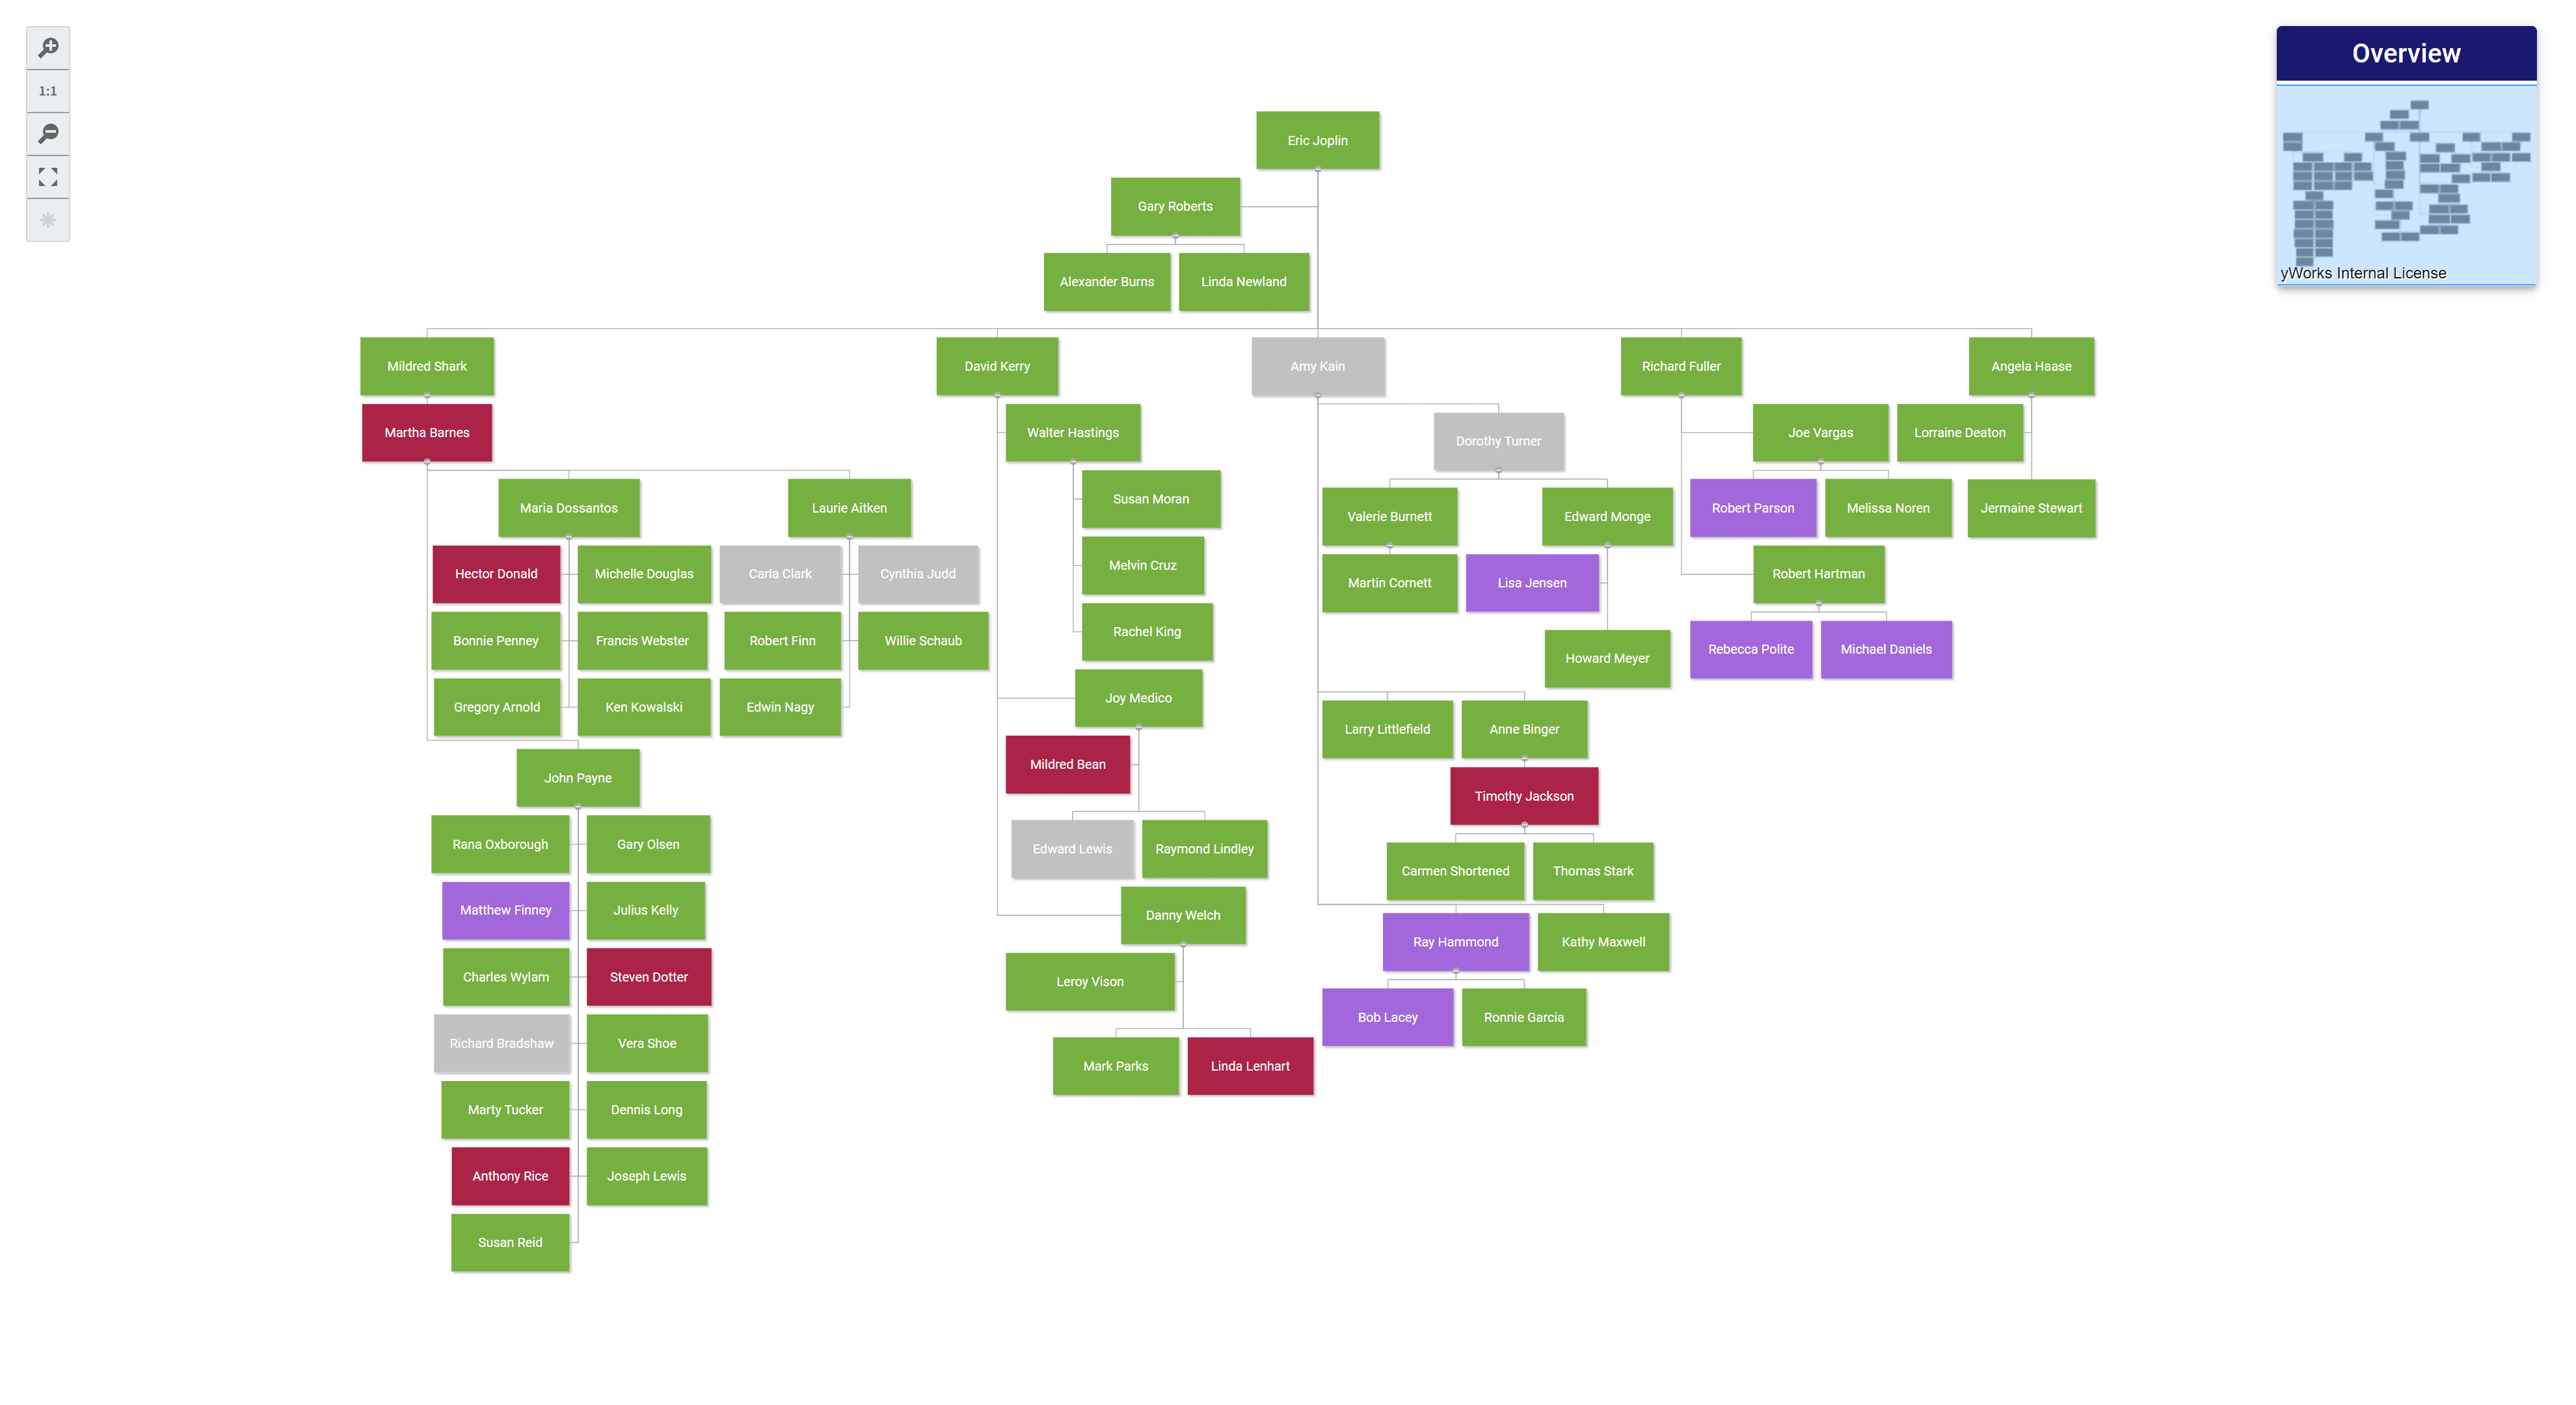
But wait there’s more! This component also offers additional built-in elements to enhance interaction with the organization chart. These elements can be incorporated with ease as children of the organization chart component:
-
Overview: Presents a simplified view of the entire graph along with the current viewport.
-
Controls: Features a toolbar with buttons to adjust the viewport.
Additionally, the yFiles React Organization Chart Component offers the essential functionality to export your diagram in SVG or PNG format, as well as the option to print your diagram using the browser’s functionality.
Examples and Source Code
The yFiles React Organization Chart Component comes with numerous example applications showcasing how to integrate and customize the component within a React application. You can find the source code of these applications on the yWorks GitHub repository.
To integrate the yFiles React Organization Chart Component in your React application, follow these steps:
-
Download the trial version of yFiles for HTML at the yWorks Customer Center.
-
Install the Organization Chart component via npm:
npm install @yworks/react-yfiles-orgchart -
The organization chart module has certain peer dependencies that must be installed within your project. Since it is a React module,
reactandreact-domdependencies are needed. -
Before using the component, copy the trial license of yFiles for HTML into your project.
-
Add the component in your application.
-
For more information on how to use the component, refer to the accompanied documentation.
Explore the seamless integration of the yFiles React Organization Chart Component into your React application! The following concise code snippet will give you an impression of how easy it is to integrate this powerful yFiles component:
Experience the capabilities firsthand
As an alternative to the yFiles React Organization Chart Component, the app generator can be utilized to create a rapid prototype of an organization chart.
yWorks' App Generator is a user-friendly tool that quickly creates customized diagramming applications. It simplifies the integration of advanced graph visualization features, enabling developers to build dynamic applications with ease.
FAQ
How can I integrate the yFiles React Organization Chart Component into my React application?
To integrate the component, download the trial version of yFiles for HTML, install the Organization Chart component via npm, ensure necessary dependencies, and add the component to your application. Refer to the documentation for detailed steps.
What kind of organizations can benefit from using the yFiles React Organization Chart Component?
The yFiles component is versatile and can be customized for various industries. Examples include corporations, healthcare organizations, educational institutions, and more.
How does yFiles handle large-scale organization charts for extensive corporations?
Techniques such as level of detail rendering, collapsing substructures, and customization based on zoom levels are employed to improve readability and manage large organizational diagrams effectively.
Can I customize the visual representation of organization chart items using the yFiles React Organization Chart Component?
Absolutely. The yFiles component allows a high level of customization. You can utilize custom React components to tailor the rendering of items based on specific requirements.
What are some unique features of the yFiles React Organization Chart Component?
Notable features include sophisticated layout algorithms, interactive elements like popups and tooltips, customization of connection visualizations, and event notifications for state changes.
How does yFiles React Organization Chart Component address challenges in rendering performance for large graphs?
The content suggests techniques such as level of detail rendering, filtering out irrelevant data, and collapsing substructures to enhance rendering performance for large organizational diagrams.
Are there any additional built-in elements that enhance interaction with the organization chart?
Yes, the component offers elements like an Overview for a simplified view of the entire graph and Controls featuring a toolbar with buttons to adjust the viewport, providing an enriched user experience.
Can I leverage yFiles React Organization Chart Component for industry-specific use cases?
Certainly. The content suggests exploring industry-specific use cases, showcasing the adaptability of the yFiles component for diverse applications in finance, healthcare, tech, and more.
Where can I find example applications and source code for integrating the yFiles React Organization Chart Component?
The yFiles React Organization Chart Component comes with ample example applications. You can find the source code on the yWorks GitHub repository and as part of the yFiles for HTML package.
How does the yFiles React Organization Chart Component address challenges related to customization limitations in traditional organization chart libraries?
The yFiles component provides a highly adaptable solution by allowing the utilization of custom React components for rendering, offering extensive customization choices for both functionality and visual presentation.
Benefits
Here are 10 benefits of integrating the yFiles React Organization Chart Component into your React application:
- Effortless Integration
The yFiles React Organization Chart Component seamlessly integrates into React applications, streamlining the process of incorporating organization charts.
- Highly Customizable Visualizations
Benefit from a high level of customization, as the component allows the use of custom React components to tailor the visual representation of organization chart items according to specific requirements.
- Sophisticated Layout Algorithms
Leverage advanced layout algorithms provided by yFiles, enabling the creation of clear, readable, and aesthetically pleasing graph visualizations for organizational structures.
- Scalability and Performance Optimization
Efficiently handle large-scale organizational diagrams through techniques like level of detail rendering and collapsing substructures, ensuring optimal performance even with extensive datasets.
- Versatility Across Industries
Adapt the yFiles component for various industries, including corporations, healthcare organizations, educational institutions, and more, showcasing its versatility in meeting diverse industry-specific requirements.
- Interactive Elements and Notifications
Enhance user interaction with built-in elements like popups, tooltips, and event notifications, providing dynamic updates to external information panels and offering a responsive and engaging user experience.
- Visual Member Representation
Visually represent members within the organization chart with customizable boxes or cards that display additional details, such as names, roles, contact information, and even photographs, creating comprehensive member profiles.
- Responsive to State Changes
Enjoy flexibility in responding to state changes, allowing for dynamic updates to external information panels, providing users with real-time information, and opening up various possibilities for interactive applications.
- Industry-Specific Use Cases
Explore and implement industry-specific use cases with ease, as the yFiles React Organization Chart Component caters to a wide range of applications, making it adaptable for specific needs in finance, healthcare, technology, and more.
- Rich Set of Additional Features
Take advantage of a rich set of additional features, including an Overview for a simplified view of the entire graph, Controls featuring a toolbar for adjusting the viewport, and ample example applications showcasing integration and customization possibilities.
These benefits highlight the advantages of incorporating the yFiles React Organization Chart Component, offering developers a powerful and flexible tool for creating interactive and visually appealing organizational charts within React applications.
Versatile Industry-Specific Visualizations
Explore the adaptability of the yFiles React Organization Chart Component across diverse industries. Delve into industry-specific examples showcasing how this component enhances organizational visualizations, providing tailored solutions for sectors ranging from healthcare to finance. Witness the versatility of yFiles React in transforming complex hierarchies into clear and interactive displays, ensuring a seamless fit for the distinct needs of each industry.
| Industry | Use Case | Organization Chart Usage |
|---|---|---|
Healthcare |
Visualizing Hospital Hierarchy |
Represents the organizational structure of a hospital, including departments, medical staff, and administrative roles. |
Finance |
Corporate Finance Organization |
Displays the hierarchy within a financial institution, including finance departments, investment teams, and executive roles. |
Technology |
Tech Company Team Structure |
Visualizes the structure of a technology company, showcasing software development teams, product management, and leadership roles. |
Manufacturing |
Manufacturing Plant Organization |
Represents the hierarchical structure of a manufacturing plant, including production lines, quality control, and managerial positions. |
Education |
University Department Structure |
Showcases the hierarchy of university departments, faculty members, and administrative staff. |
Retail |
Retail Chain Management |
Depicts the structure of a retail chain, including store managers, regional supervisors, and corporate management roles. |
Government |
Government Agency Structure |
Visualizes the organizational hierarchy of a government agency, displaying different departments, officials, and support staff. |
Non-Profit |
Non-Profit Organization Chart |
Represents the structure of a non-profit organization, including program managers, volunteers, and executive leadership. |
Consulting |
Consulting Firm Teams |
Displays the structure of a consulting firm, with consultants, project teams, and leadership roles. |
Energy |
Energy Company Departmental Structure |
Visualizes the hierarchical representation of an energy company, including engineering teams, project managers, and executive roles. |
Telecommunications |
Telecom Company Divisional Hierarchy |
Visualizes the structure of a telecommunications company, including network operations, customer service, and managerial positions. |
Hospitality |
Hotel Management Structure |
Represents the hierarchy within a hotel, showcasing departments like front desk, housekeeping, and food services. |
