Layout Styles
Layout Styles
Presents yFiles' exceptional layout algorithms, including hierarchical,
organic, orthogonal, tree, edge routing, and more.
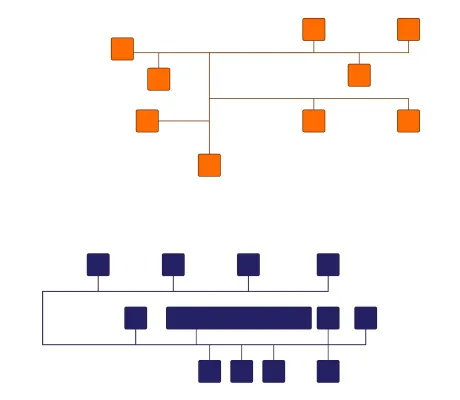
Layout Styles: Hierarchical
Layout Styles: Hierarchical
Presents yFiles' hierarchical layout algorithm and its other layout styles.
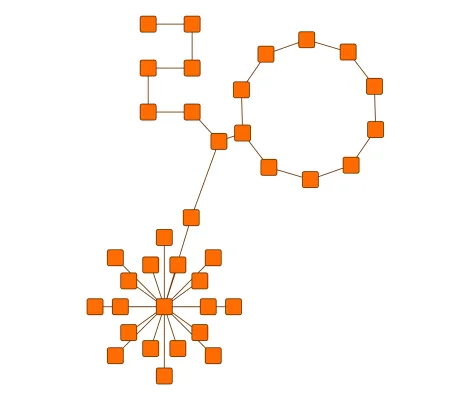
Layout Styles: Organic
Layout Styles: Organic
Presents yFiles' organic layout algorithm and its other layout styles.
Layout Styles: Edge Router
Layout Styles: Edge Router
Presents yFiles' edge routing algorithm and its other layout styles.
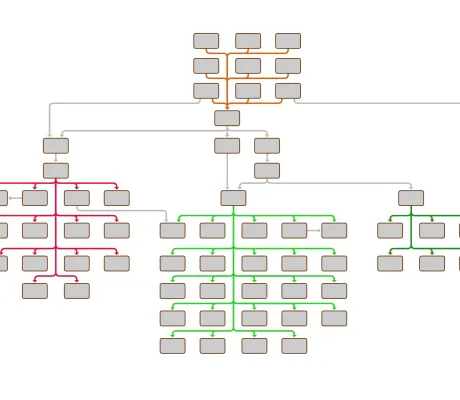
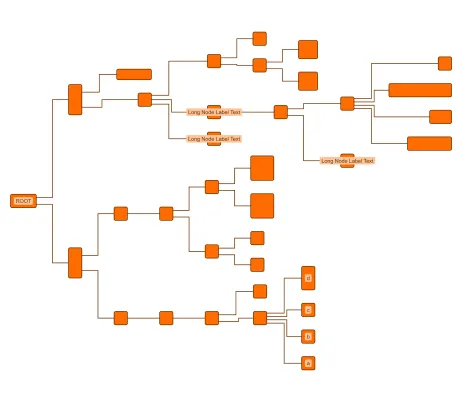
Layout Styles: Tree
Layout Styles: Tree
Presents yFiles' tree layout algorithm and its other layout styles.
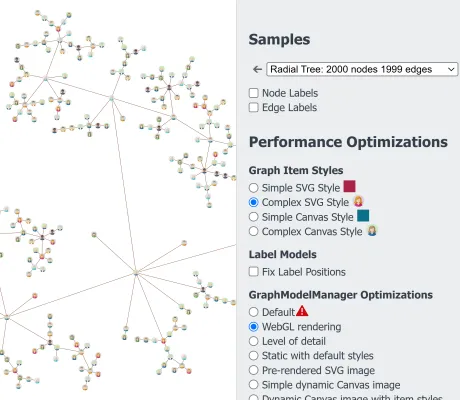
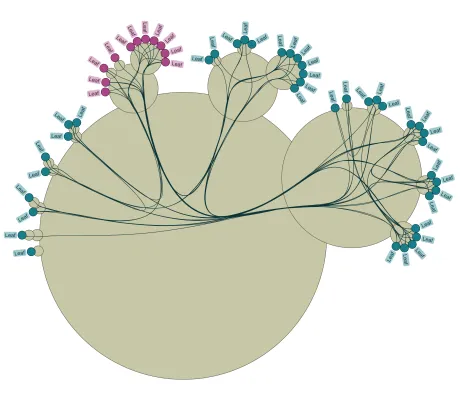
Layout Styles: Radial Tree
Layout Styles: Radial Tree
Presents yFiles' radial tree layout algorithm and its other layout styles.
Layout Styles: Orthogonal
Layout Styles: Orthogonal
Presents yFiles' orthogonal layout algorithm and its other layout styles.
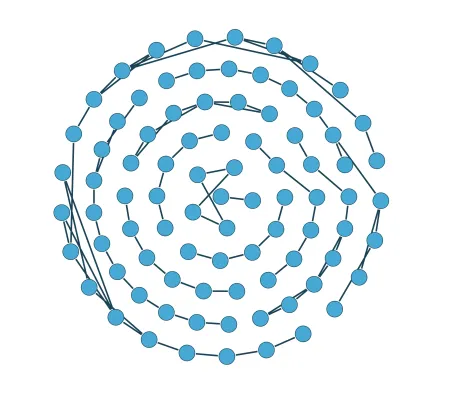
Layout Styles: Circular
Layout Styles: Circular
Presents yFiles' circular layout algorithm and its other layout styles.
Layout Styles: Radial
Layout Styles: Radial
Presents yFiles' radial layout algorithm and its other layout styles.
Layout Styles: Compact Disk
Layout Styles: Compact Disk
Presents yFiles' compact disk layout algorithm and its other layout styles.
Layout Styles: Series-Parallel
Layout Styles: Series-Parallel
Presents yFiles' series-parallel layout algorithm and its other layout styles.
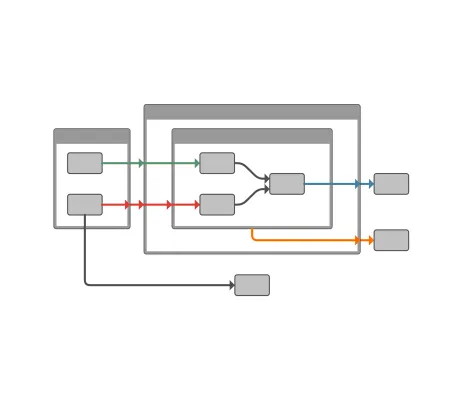
Layout Styles: Components
Layout Styles: Components
Presents yFiles' component layout algorithm and its other layout styles.
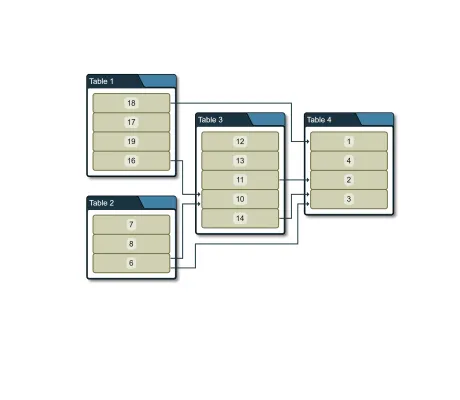
Layout Styles: Tabular
Layout Styles: Tabular
Presents yFiles' tabular layout algorithm and its other layout styles.
Layout Styles: Labeling
Layout Styles: Labeling
Presents yFiles' label placement algorithm and its other layout styles.
Layout Styles: Partial
Layout Styles: Partial
Presents yFiles' partial layout algorithm and its other layout styles.
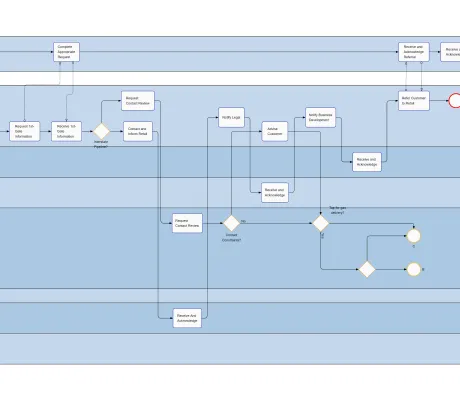
BPMN Editor
BPMN Editor
An interactive business process diagram editor with BPMN node styles and a special layout algorithm.
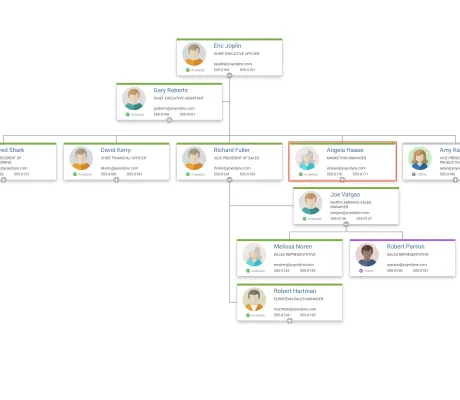
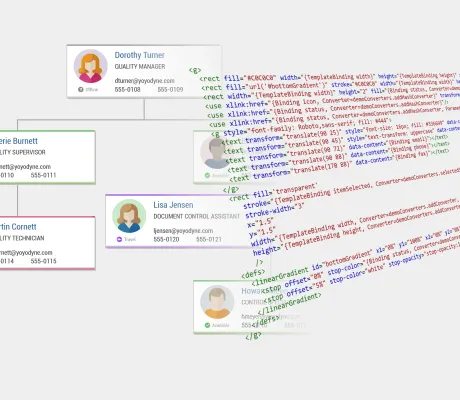
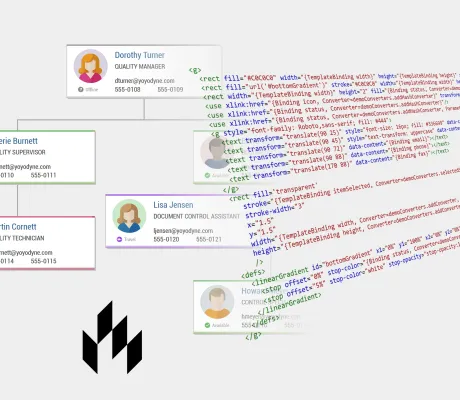
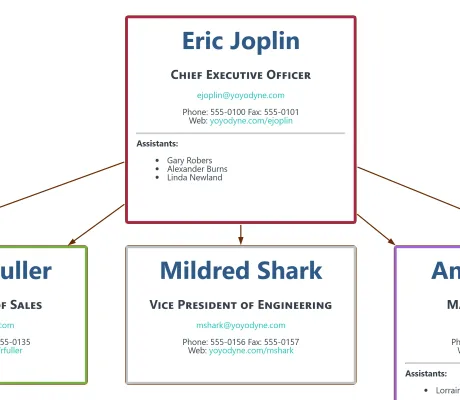
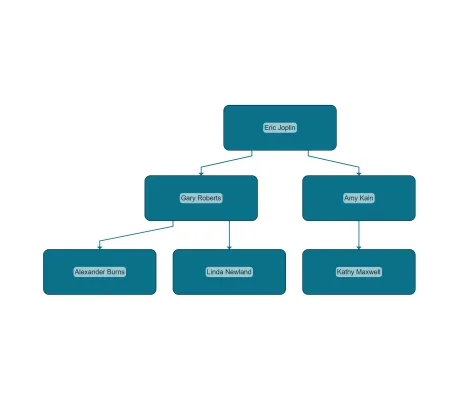
Organization Chart
Organization Chart
An interactive viewer for organization charts with adaptive styles and automatic layout.
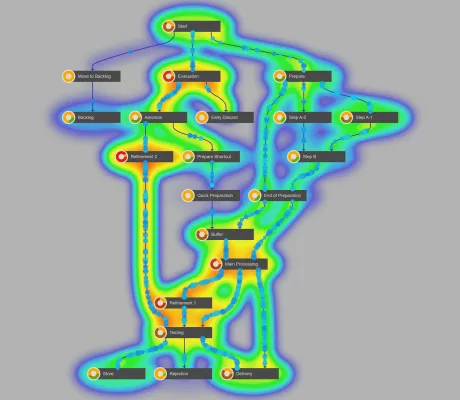
Process Mining
Process Mining
Shows how to create an animated visualization of a process flow.
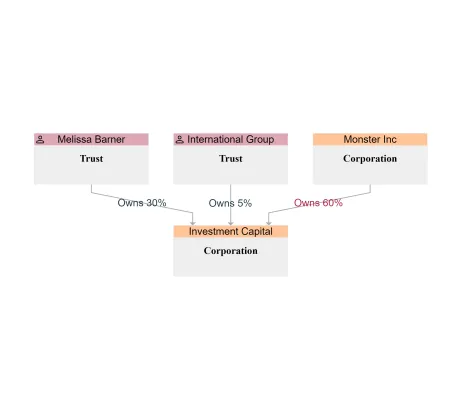
Company Ownership Chart
Company Ownership Chart
Interactively research the ownership of companies and their management relationships.
Gantt Chart
Gantt Chart
An editor for Gantt charts.
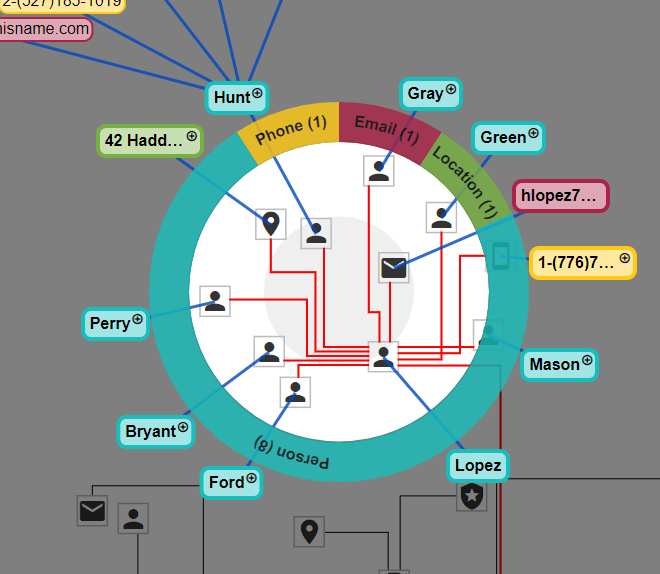
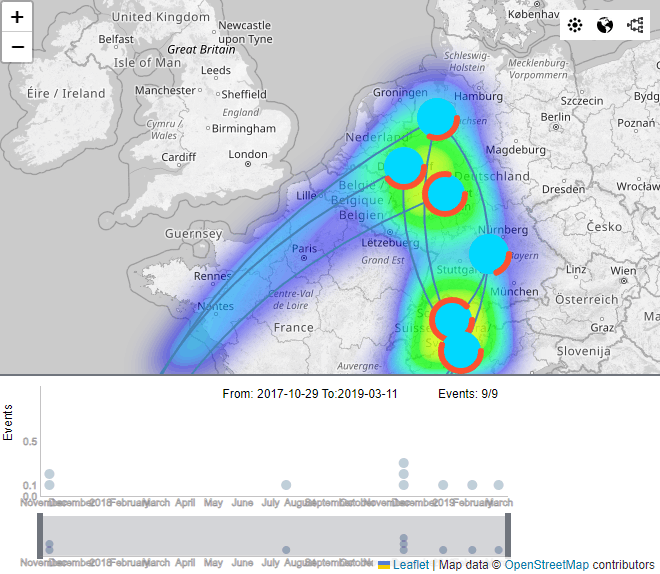
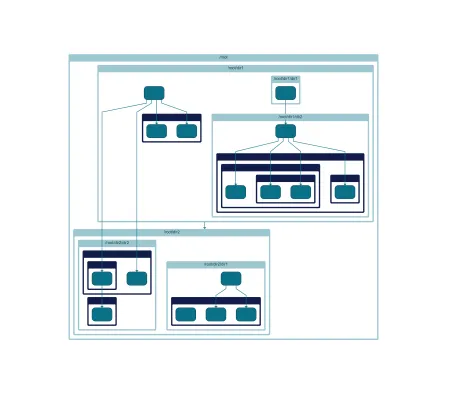
Fraud Detection
Fraud Detection
Example of a fraud detection application for time-dependent data.
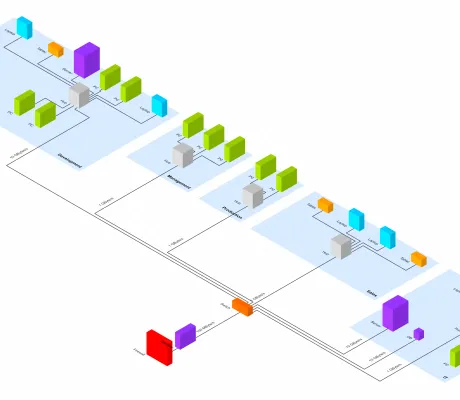
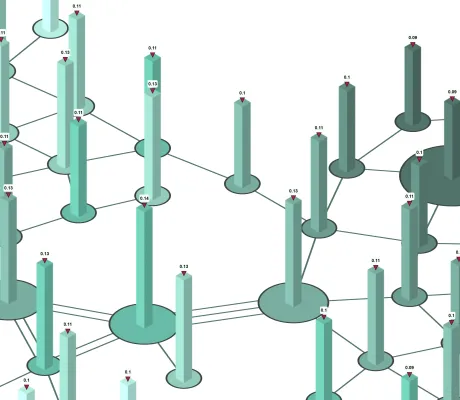
Isometric Drawing
Isometric Drawing
Displays graphs in 3D using an freely adjustable projection and WebGL rendering.
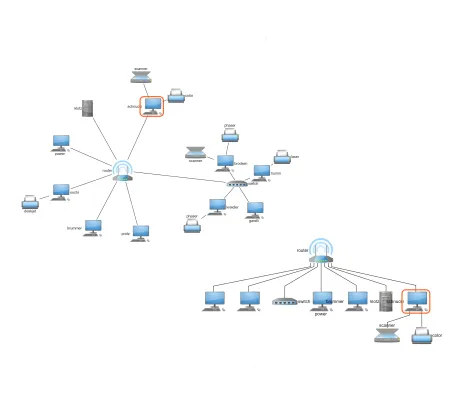
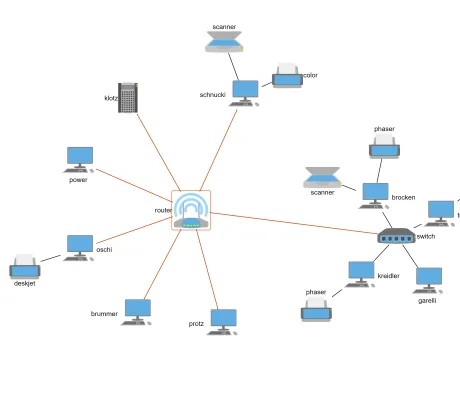
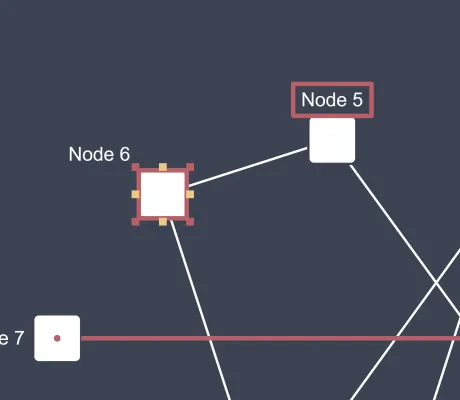
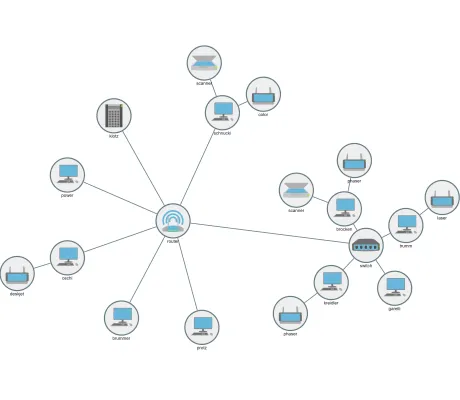
Network Monitoring
Network Monitoring
Example of a monitoring tool for computer networks.
Metaball Groups
Metaball Groups
Shows how to render metaball-like background visualizations.
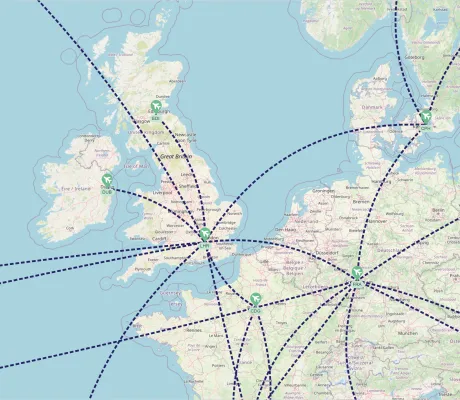
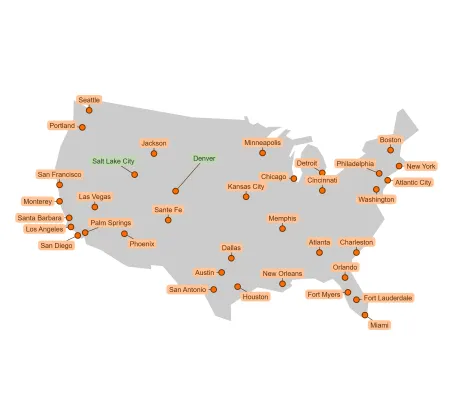
Map
Map
Displays a graph on top of an interactive map.
GraphWizard for Flowchart
GraphWizard for Flowchart
Customizes defaults and input gestures to support fast creation of flowcharts.
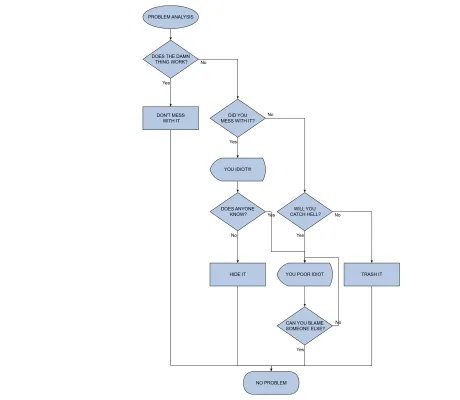
Flowchart Editor
Flowchart Editor
An editor for Flowchart diagrams that features interactive editing, flowchart node styles, and automatic layout.
UML Editor
UML Editor
An editor for UML diagrams with a tailored UML node style, automatic layout, and a quick way to create new edges with the mouse or touch.
Dungeons and Dragons
yFiles-powered web application
Dungeons and Dragons
yFiles-powered web application
An interactive decision tree that helps you discover the best character class for your next Dungeons and Dragons adventure.
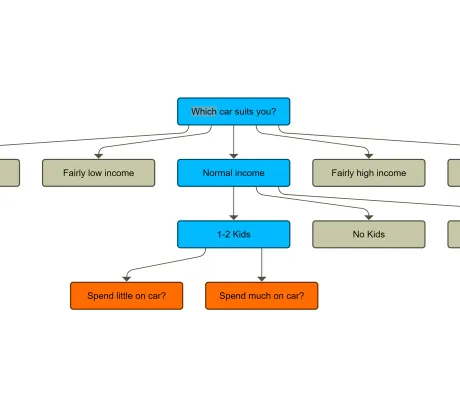
Decision Tree
Decision Tree
An interactive Decision Tree component that lets you design and explore your own decision graphs.
Mindmap Editor
Mindmap Editor
A Mindmap editor with a tailored node style, custom user interaction, and a specialized layout that automatically arranges new entries.
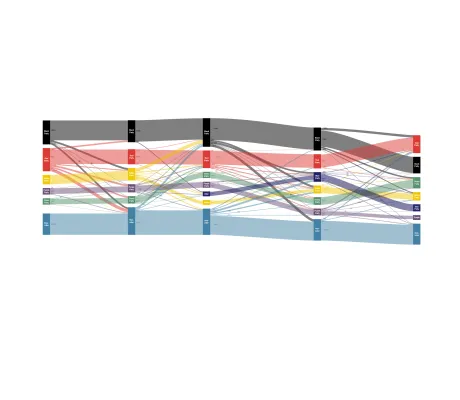
Sankey Diagram
Sankey Diagram
A diagram used for visualizing flow information in which the thickness of the edges is proportional to the flow quantity.
Tree of Life
Tree of Life
An interactive radial dendrogram visualization of the Tree of Life.
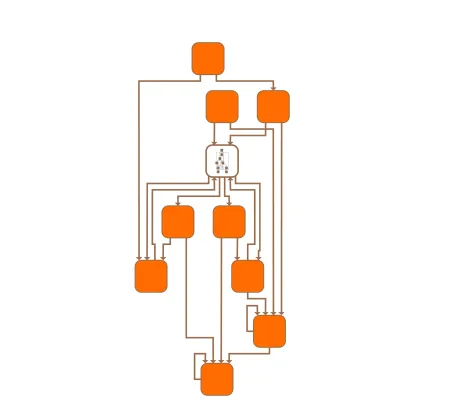
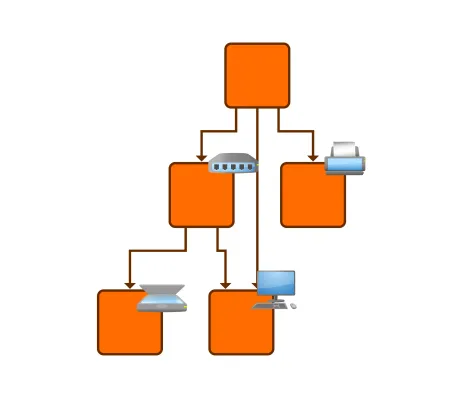
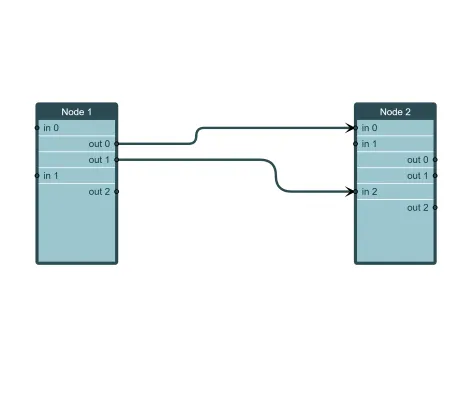
Home Automation
Home Automation
Demonstrates visual programming of a home automation network.
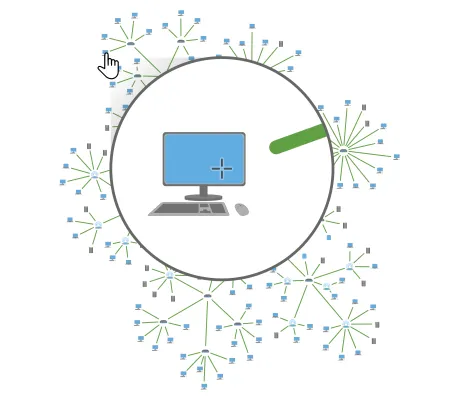
Wonderlens
yFiles-powered web application
Wonderlens
yFiles-powered web application
Shows how to utilize a lens to reveal more detailed information.
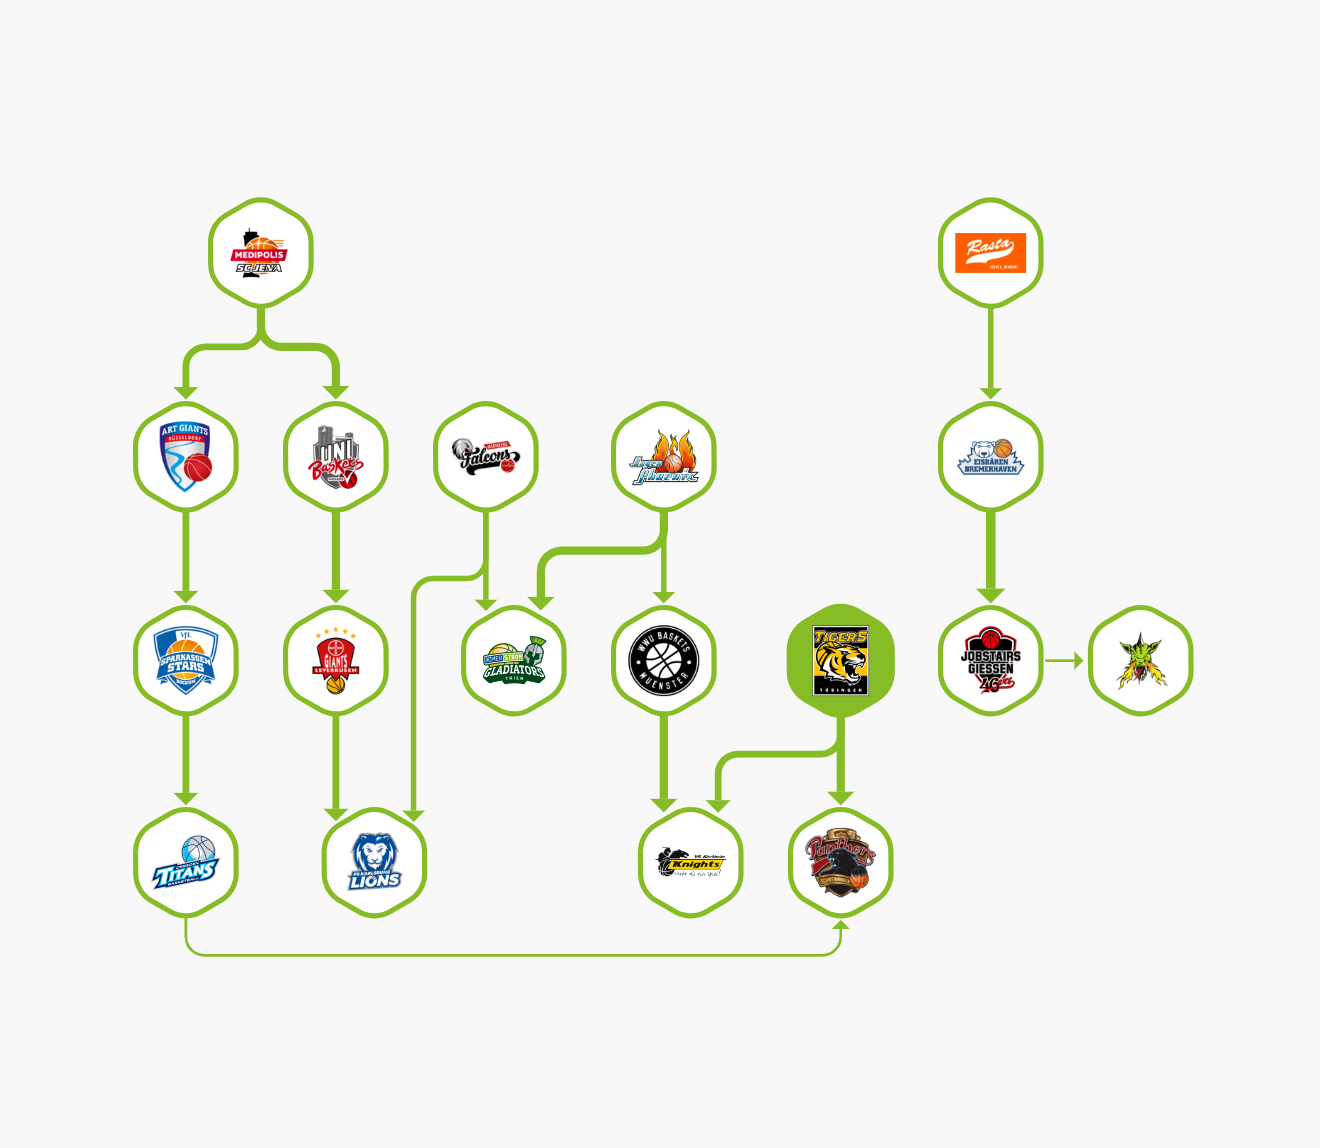
BBL - Liga Graph
yFiles-powered web application
BBL - Liga Graph
yFiles-powered web application
A visualization of the current ranking in the German basketball league.
Marvel Cinematic Universe
yFiles-powered web application
Marvel Cinematic Universe
yFiles-powered web application
A visualization of the Marvel Cinematic Universe and its characters, with all movies arranged according to their in-universe timeline.
Board Game Recommendations
yFiles-powered web application
Board Game Recommendations
yFiles-powered web application
A visualization of the top-40/100 board games rated at BoardGameGeek .
Digital Marketing Optimization
Digital Marketing Optimization
A visualization of a Sankey diagram showing different paths that visitors take on a website.
Space-time Graphs
Space-time Graphs
Shows how to display a graph that changes over time.
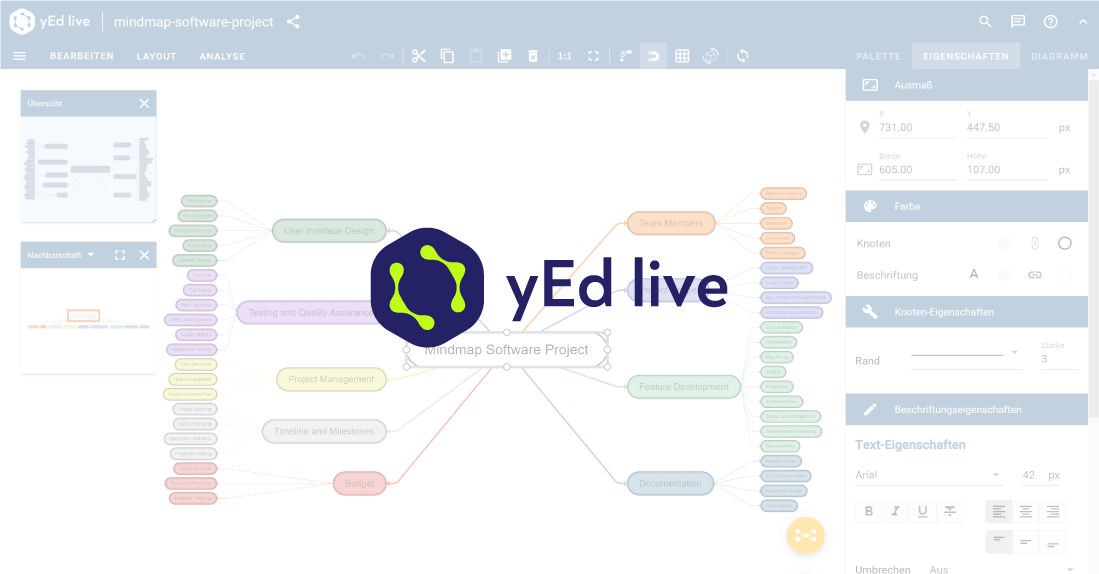
yEd Live
yFiles-powered web application
yEd Live
yFiles-powered web application
A free diagram editor web application based on yFiles for HTML that lets you create, import, edit, and automatically arrange diagrams.
App Generator
yFiles-powered web application
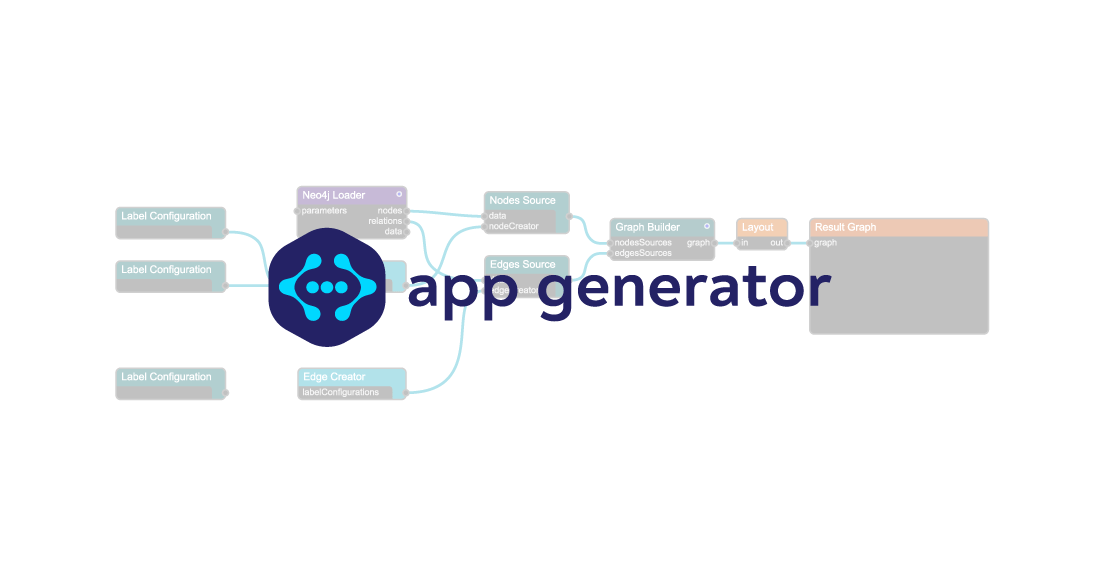
App Generator
yFiles-powered web application
A tool based on yFiles for HTML to rapidly create graph visualization prototypes with the yFiles diagramming library.
yFiles Playground
yFiles-powered web application
yFiles Playground
yFiles-powered web application
A tool for exploring simple code samples and writing your first lines of yFiles code with yFiles for HTML .
Data Explorer
yFiles-powered web application
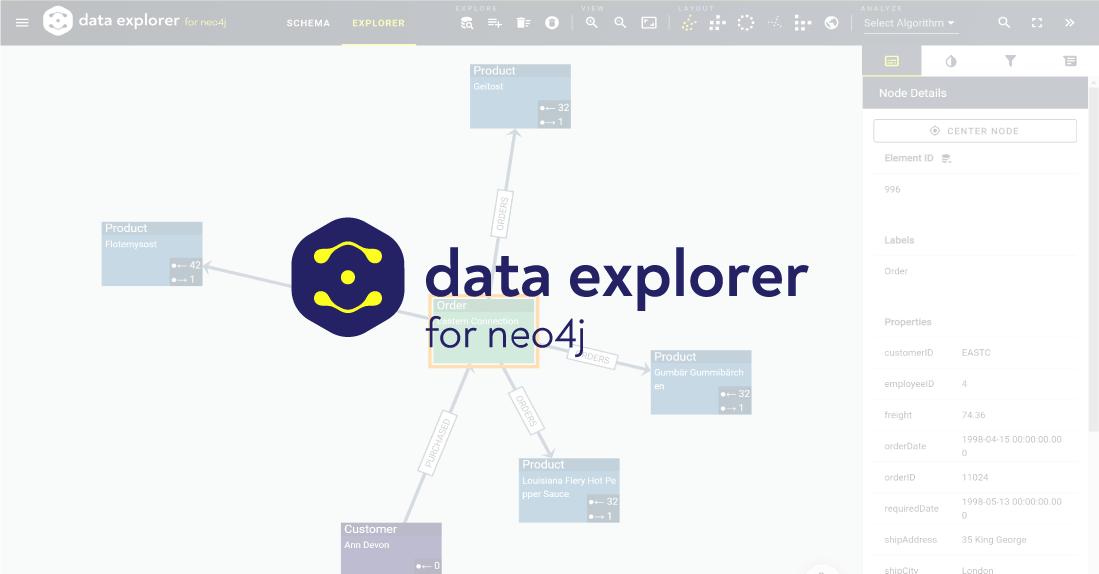
Data Explorer
yFiles-powered web application
A free browser tool based on yFiles for HTML that provides easy access and interactive exploration of your Neo4j database.
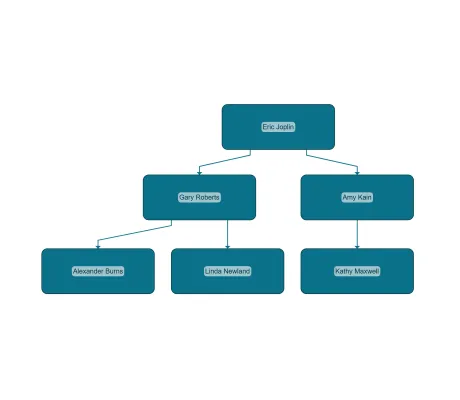
React Organization Chart Component
yFiles React Component
React Organization Chart Component
yFiles React Component
A flexible and easy-to-use organization chart React component based on the yFiles library.
React Supply Chain Component
yFiles React Component
React Supply Chain Component
yFiles React Component
A powerful and versatile React supply chain component based on the yFiles library.
React Company Ownership Component
yFiles React Component
React Company Ownership Component
yFiles React Component
Enhance user experience by seamlessly incorporating dynamic and interactive company ownership diagrams.
React Process Mining Component
yFiles React Component
React Process Mining Component
yFiles React Component
A powerful and versatile React process mining component based on the yFiles library.
Tree Map
Tree Map
Shows disk usage of a directory tree with the Tree Map layout.
Tag Cloud
Tag Cloud
Shows how to create a Tag Cloud.
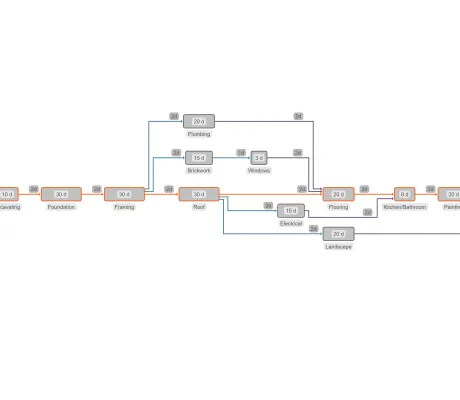
Critical Path Analysis (CPA)
Critical Path Analysis (CPA)
Shows how to perform critical path analysis in project management.
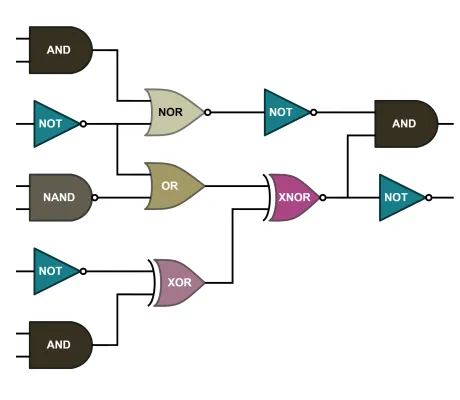
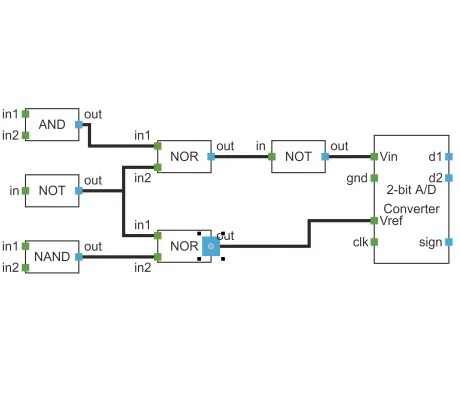
Logic Gates
Logic Gates
An editor for networks of logic gates, with tailored automatic layout.
Graph Analysis
Graph Analysis
Showcases yFiles' algorithms that help analyzing the structure of a graph, such as shortest paths, flows, centrality measures
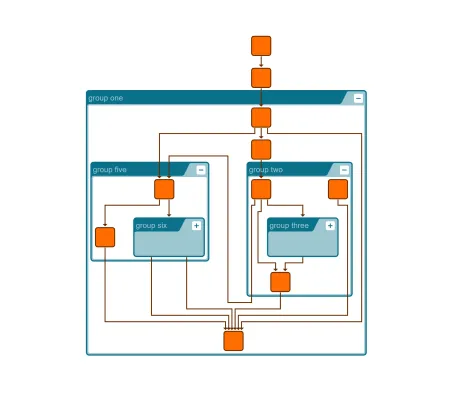
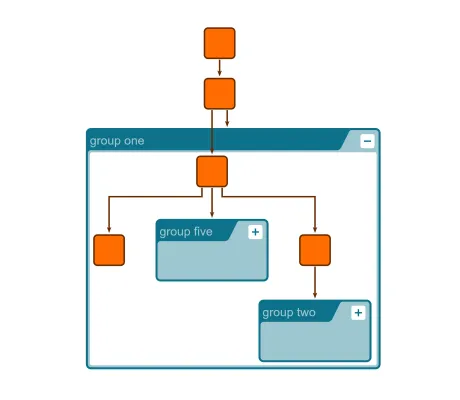
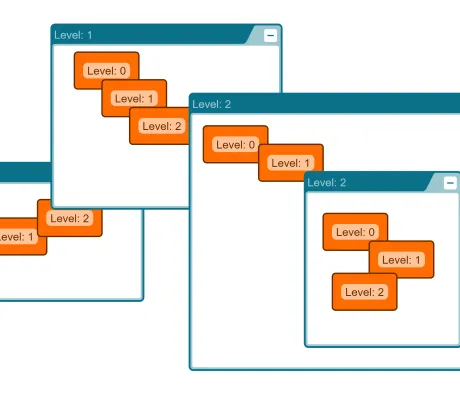
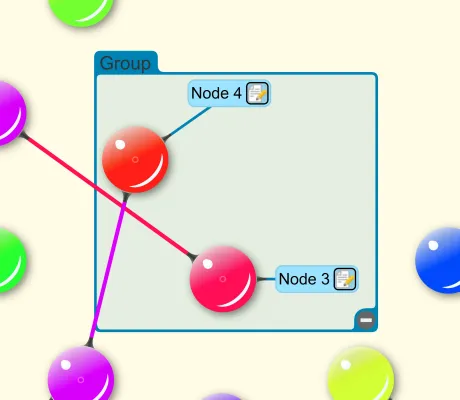
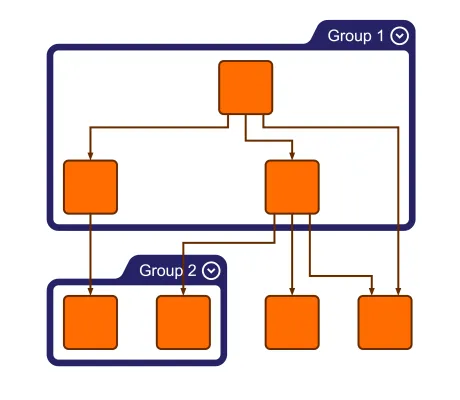
Hierarchical Nesting
Hierarchical Nesting
The hierarchical layout nicely expands and collapses sub-graphs organized in groups.
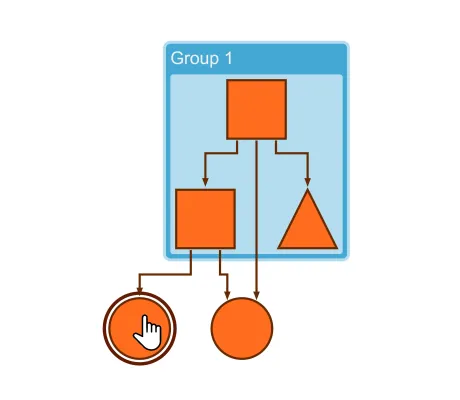
Hierarchical Nesting (Incremental)
Hierarchical Nesting (Incremental)
Shows how to nicely lay out newly loaded nodes when expanding folded groups.
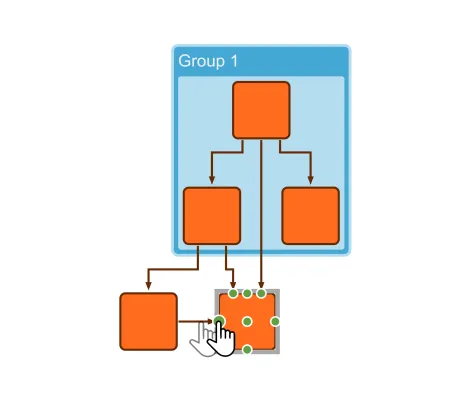
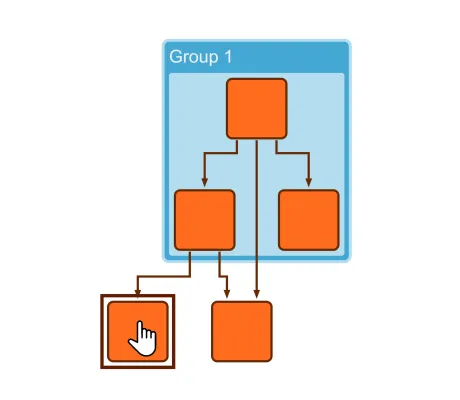
Folding With Layout
Folding With Layout
Shows how an automatic layout makes space for opening groups and reclaims the space of closing groups.
Large Graphs
Large Graphs
Shows how to display large graphs with both good performance in WebGL and high quality in SVG.
Large Graph Aggregation
Large Graph Aggregation
Shows how to use the smart node aggregation for drill-down exploration of a large graph.
Interactive Aggregation
Interactive Aggregation
Shows how to analyze a graph by interactively aggregating nodes with common properties.
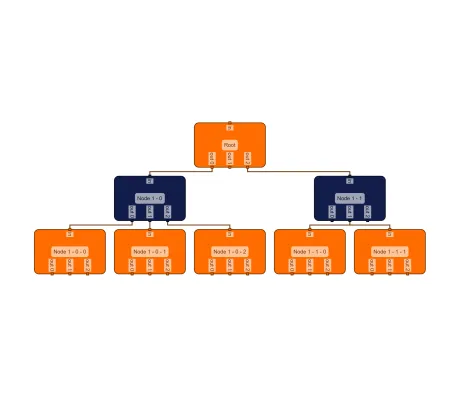
Large Collapsible Tree
Large Collapsible Tree
Shows a tree graph, where a large number of nodes can be added interactively.
Collapsible Trees
Collapsible Trees
Shows interactive collapsing and expanding of subtrees of a graph.
Rendering Optimizations
Rendering Optimizations
Illustrates optimizations of the rendering performance for large graphs.
Neighborhood View
Neighborhood View
Shows the neighborhood of the currently selected node alongside the graph.
Neighborhood Circles
Neighborhood Circles
Shows the neighborhood of selected nodes arranged on concentric circles.
Contextual Toolbar
Contextual Toolbar
Shows a contextual toolbar for the current selection that enables fast and easy style changes.
Magnifying Glass
Magnifying Glass
Shows a floating lens that magnifies the cursor's surroundings.
CSS Item Style
CSS Item Style
Shows how to style and animate graph items with CSS.
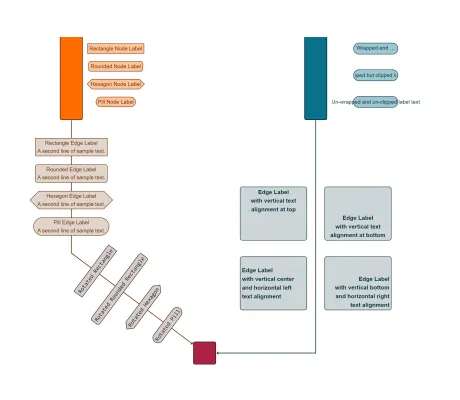
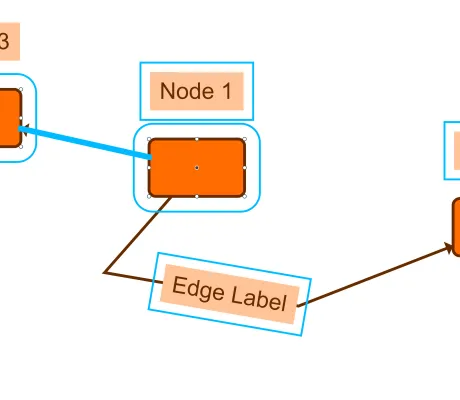
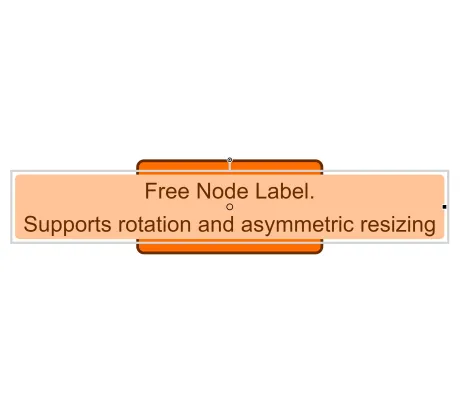
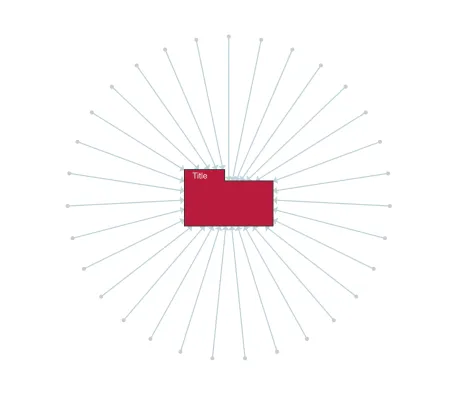
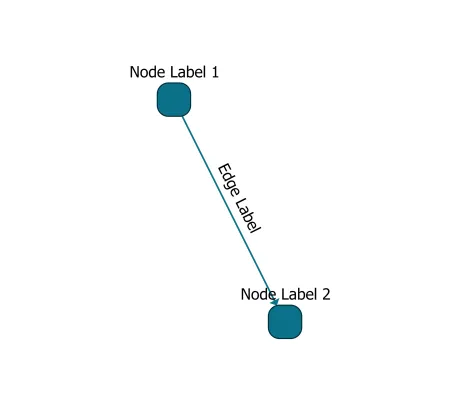
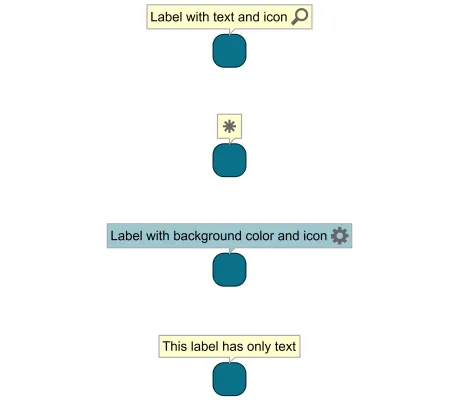
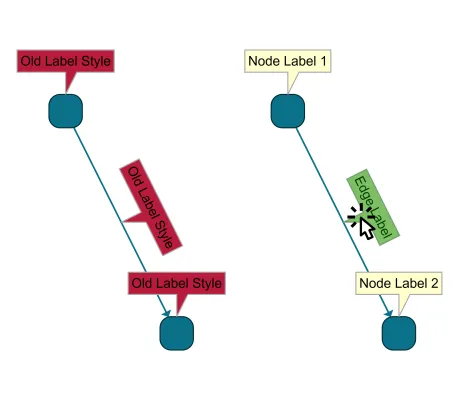
Label Style
Label Style
Shows the features of the LabelStyle class.
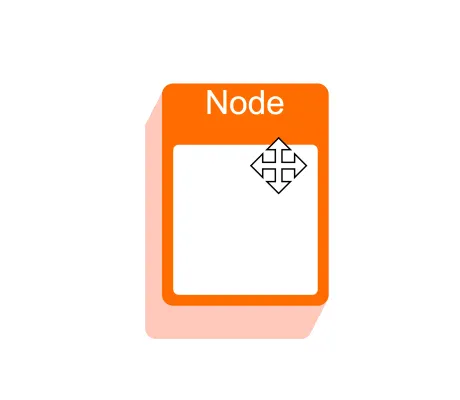
Rectangle Node Style
Rectangle Node Style
Shows the different node shapes that can be implemented with the RectangleNodeStyle class.
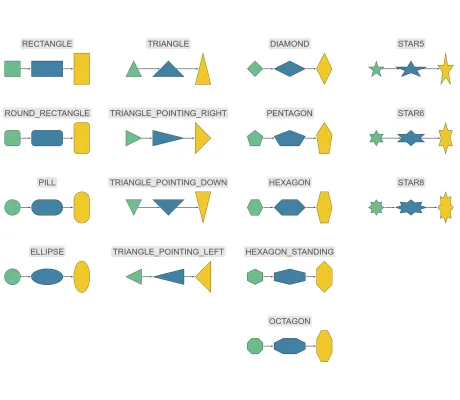
Shape Node Style
Shape Node Style
Shows the features of the ShapeNodeStyle class.
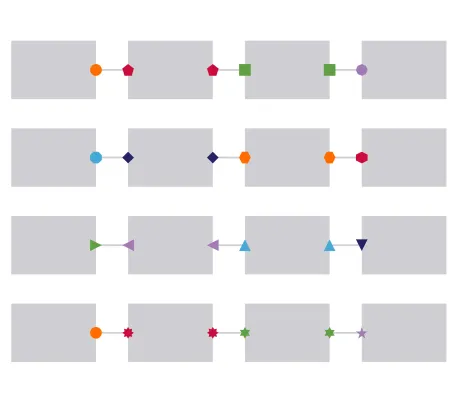
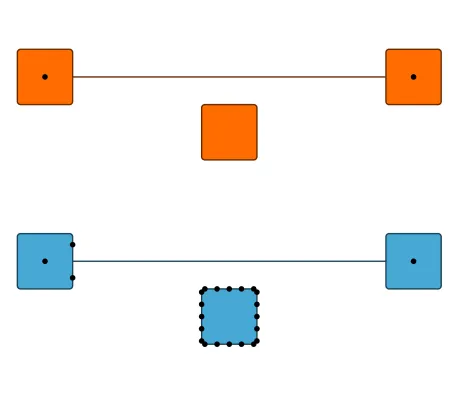
Shape Port Style
Shape Port Style
Shows the features of the ShapePortStyle class.
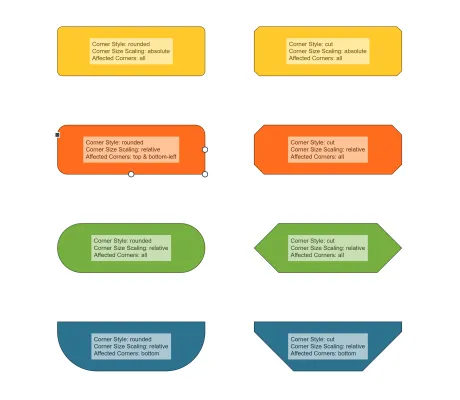
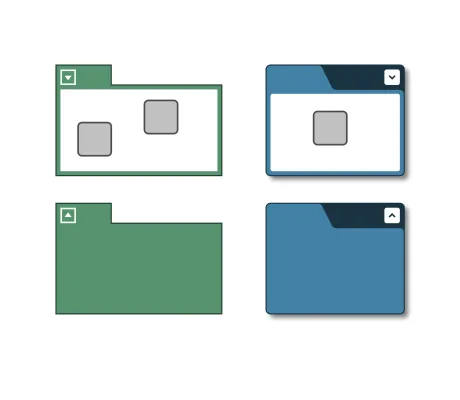
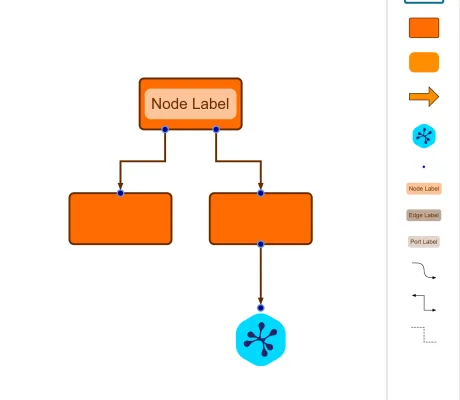
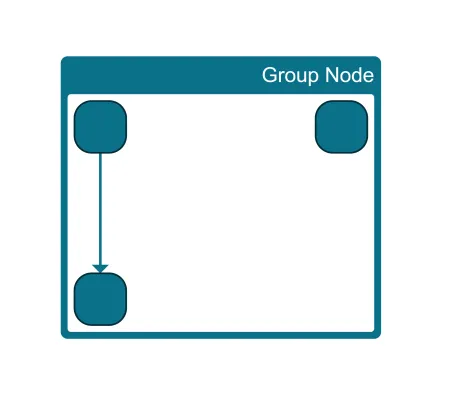
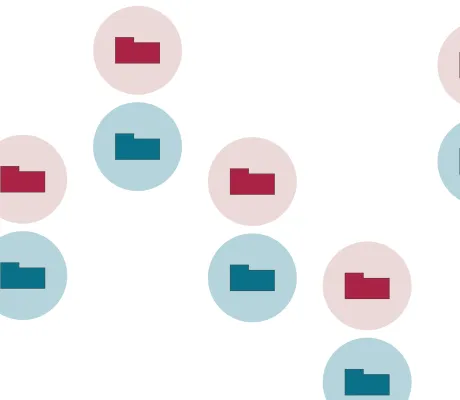
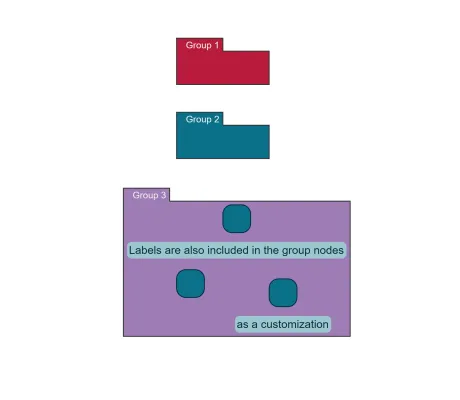
Group Node Style
Group Node Style
Shows the group and folder node visualization options offered by the GroupNodeStyle class.
Arrow
Arrow
Shows all arrow types of the Arrow class.
Arrow Node Style
Arrow Node Style
Shows the features of the ArrowNodeStyle class.
Arrow Edge Style
Arrow Edge Style
Shows the features of the ArrowEdgeStyle class.
WebGL Animations
WebGL Animations
Shows howto use WebGL animations to highlight interesting parts of a graph.
WebGL Label Fading
WebGL Label Fading
Shows how to achieve a simple level of detail effect by fading in/out labels at a certain zoom value using WebGL rendering.
Clustering Algorithms
Clustering Algorithms
Showcases a selection of clustering algorithms such as edge betweenness, k-means, hierarchical and biconnected components clustering.
Intersection Detection
Intersection Detection
Shows how to compute and highlight intersections between graph items.
Network Flows
Network Flows
Presents three network flow graph analysis algorithms that are applied on a network of water pipes.
Transitivity
Transitivity
Shows how transitivity graph analysis algorithms can be applied to solve reachability problems.
Graph Editor
Graph Editor
Shows the graph editing features of the graph component.
Valid Begin Cursors
Valid Begin Cursors
Shows how various cursors can be used to indicate valid gestures at the current location.
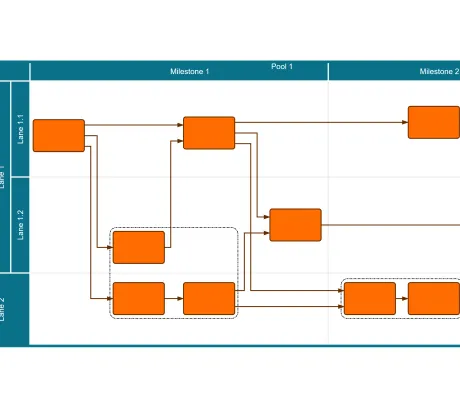
Table Editor
Table Editor
Shows the support for diagrams that are organized in a tabular way, for example in a grid or a swimlane layout.
Graph Viewer
Graph Viewer
Displays sample graphs from various application domains.
HTML Popup
HTML Popup
Shows HTML pop-up panels that displays additional information about a clicked node or edge.
Structure View
Structure View
A tree list component that shows the nesting of the groups and nodes.
Rendering Order
Rendering Order
Shows different rendering order settings.
Z-Order
Z-Order
Shows how to adjust the z-order of graph elements and to keep this z-order consistent.
Rotatable Nodes
Rotatable Nodes
Shows nodes that can be rotated with the mouse or touch.
Touch Interaction
Touch Interaction
Shows how a graph editor application can be optimized for touch devices.
Deep Zoom
Deep Zoom
Seamlessly zoom into the contents of deeply nested group nodes, similar to "deep zoom" for images
Arrange Objects
Arrange Objects
Shows simple operations for aligning and distributing nodes.
Custom Styles
Custom Styles
Shows how to create custom styles for nodes, edges, labels, ports, and edge arrows.
Template Styles
Template Styles
Shows SVG template styles for nodes using a simple templating engine.
Template Node Style
Template Node Style
Presents a versatile and customizable template node style using a simple templating engine.
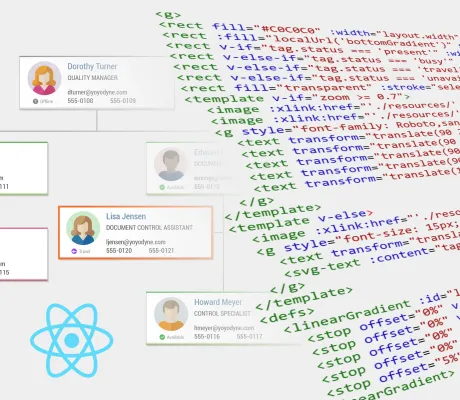
React JSX Component Style
React JSX Component Style
Presents a versatile and easily customizable template node style based on JSX and React.
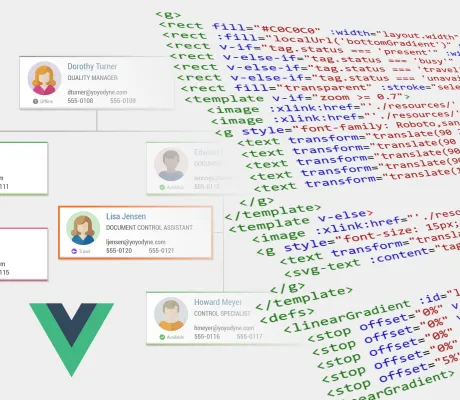
Vue Template Node Style
Vue Template Node Style
Presents a versatile and easily customizable template node style based on Vue.
Lit Template Node Style
Lit Template Node Style
Presents a versatile and easily customizable template node style based on the Lit templating framework.
WebGL Styles
WebGL Styles
Shows the various graph item styles available in WebGL rendering.
WebGL Selection Styles
WebGL Selection Styles
Shows the possible styling configurations for selections in WebGL rendering.
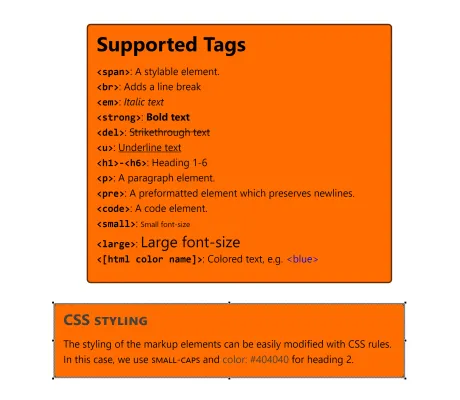
CSS Styling
CSS Styling
Shows how to style indicators and other templates.
Theme Variants
Theme Variants
Shows various interaction visualization themes simultaneously.
Isometric Bar Chart Node Style
Isometric Bar Chart Node Style
Shows how a node style can be augmented with isometric bars.
d3 Chart Nodes
d3 Chart Nodes
Presents a node style that visualizes dynamic data with d3.js.
Editable Path Node Style
Editable Path Node Style
Shows a path-based node style whose control points can be moved by users.
WebGL Image Node
WebGL Image Node
Shows how to render image nodes with WebGL.
Clickable Style Decorator
Clickable Style Decorator
Illustrates an approach for handling clicks on specific areas of the style.
Composite Node Style
Composite Node Style
Shows how to combine node visualizations from several styles.
Level of Detail Style
Level of Detail Style
Shows a node style that hides details when zooming out.
List Node
List Node
Shows a node which contains re-arrangeable rows.
Data Table
Data Table
Shows a node style and a label style that display data in a tabular fashion.
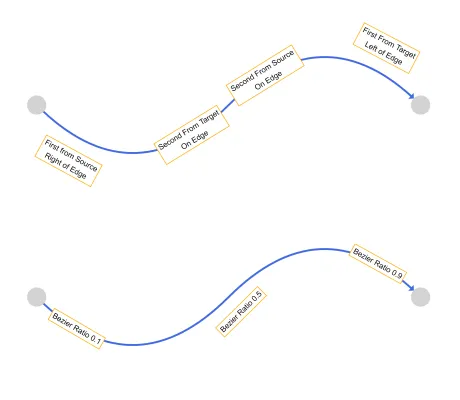
Bezier Edge Style
Bezier Edge Style
Shows how to use the curved edge style consisting of Bezier splines.
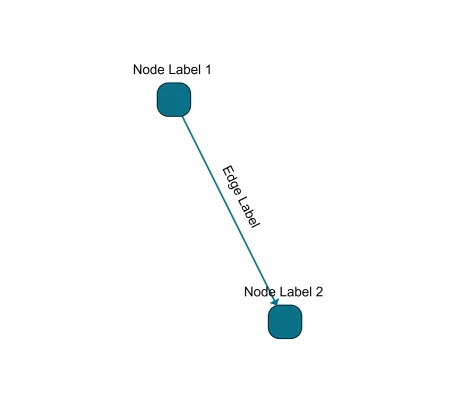
Directed Edge Label Style
Directed Edge Label Style
Shows label styles displaying arrows that always point to the source or target port.
Markup Label
Markup Label
Markup label style lets you use html-like markup to structure and style the label text.
Markdown Label
Markdown Label
Use markdown to format the label text.
Rich Text Label
Rich Text Label
Edit markup labels with a WYSIWYG text editor.
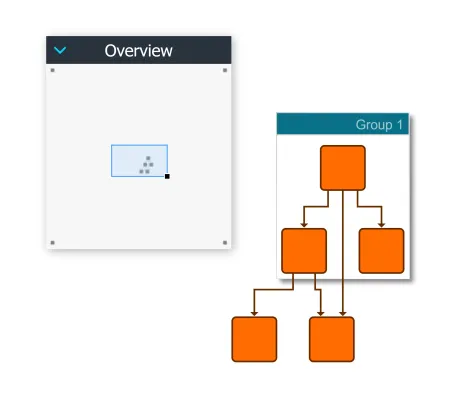
Overview Styling
Overview Styling
Shows several different rendering techniques and styles for the overview.
HTML Controls
HTML Controls
Shows how a custom HTML-based node style can be used to create interactive nodes.
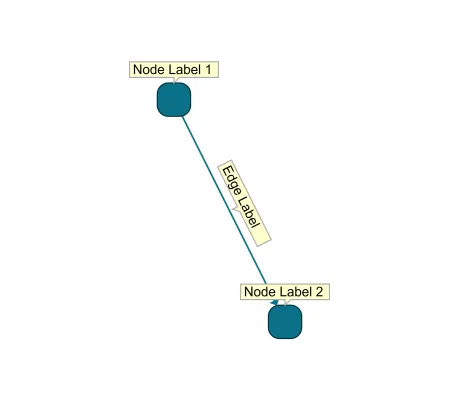
HTML Label Style
HTML Label Style
Shows how HTML can be used for label rendering with a custom label style.
Zoom-invariant Label Style
Zoom-invariant Label Style
Shows label styles that are independent of the zoom level.
Simple Arrow Style
Simple Arrow Style
Shows how to create a simple custom arrow for edges.
Selection Styling
Selection Styling
Shows customized selection painting of nodes, edges and labels by decorating these items with a corresponding
style.
Style Decorators
Style Decorators
Shows how to create styles for nodes, edges, and labels that wrap existing styles and add visual decorators.
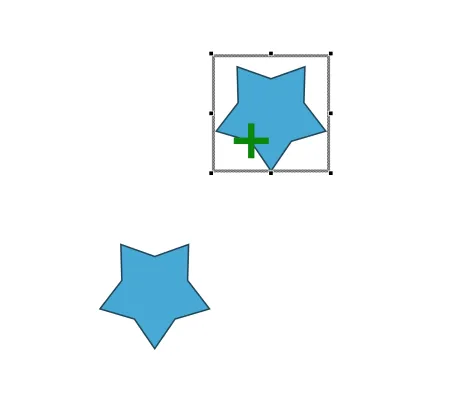
General Path Node Style
General Path Node Style
Shows how to create a variety of star, polygon, and other custom node styles with GeneralPathNodeStyle.
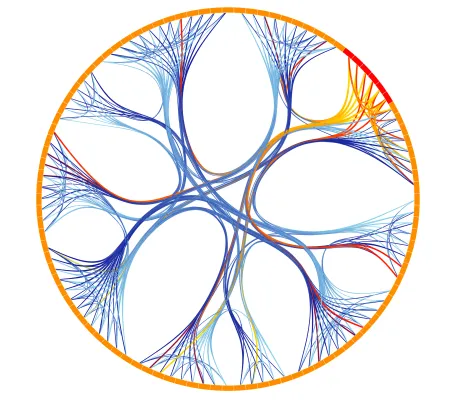
Edge Bundling
Edge Bundling
Shows how edge bundling can be applied for reducing visual cluttering in dense graphs.
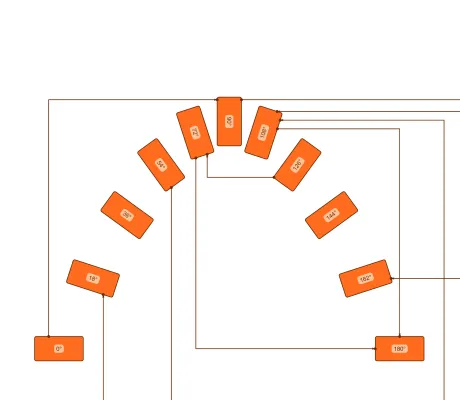
Chord Diagram
Chord Diagram
Shows a chord diagram that emphasizes the magnitude of connections between nodes.
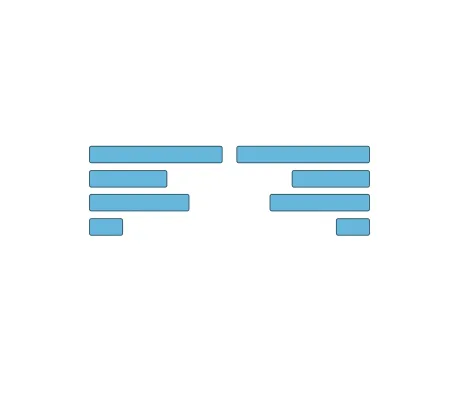
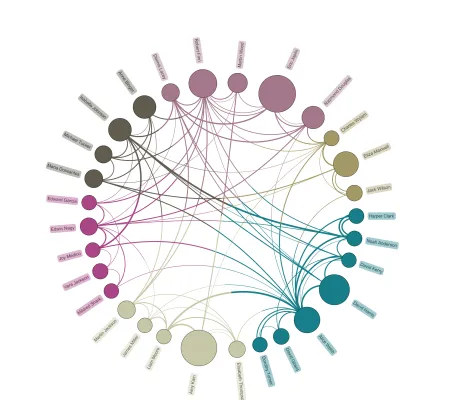
Non-ribbon Chord Diagram
Non-ribbon Chord Diagram
Shows a non-ribbon chord diagram that emphasizes the traceability of the connections.
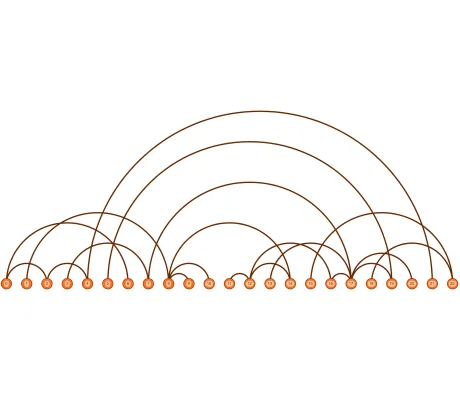
Arc Diagram
Arc Diagram
Shows how to visualize a graph as an arc diagram.
Maze Routing
Maze Routing
Shows how the automatic edge routing finds routes through a maze.
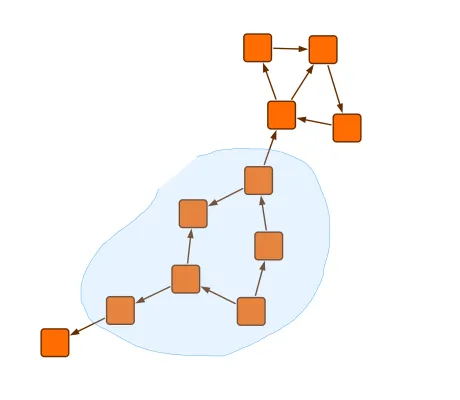
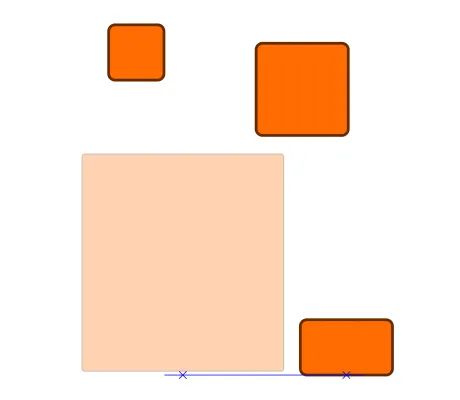
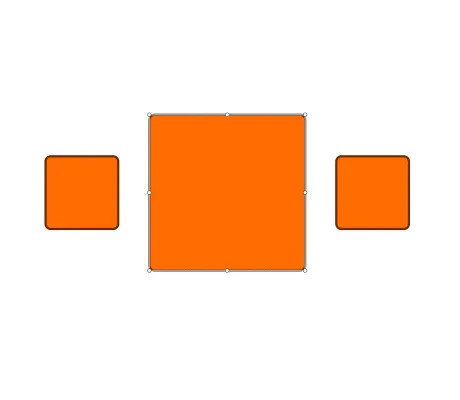
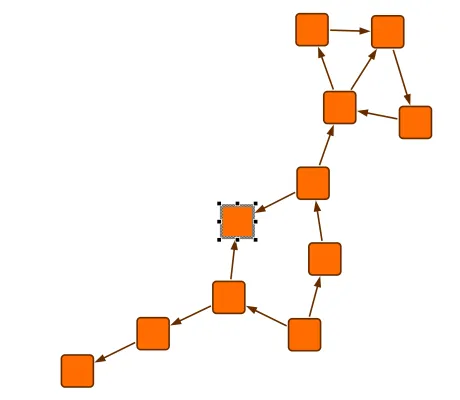
Component Drag and Drop
Component Drag and Drop
A demo that shows how to clear space for a dropped component in an existing layout.
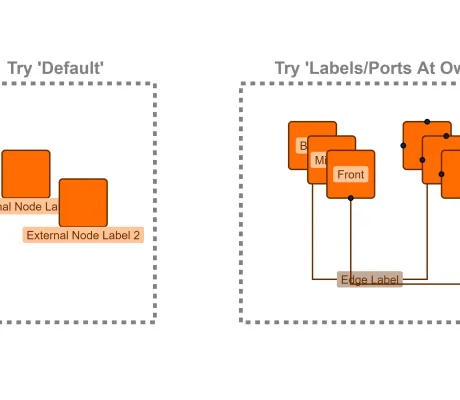
Edge Label Placement
Edge Label Placement
Shows how to place edge labels at the preferred location with a labeling algorithm.
Automatic Node Labeling
Automatic Node Labeling
Shows how to place node labels at the preferred location with a labeling algorithm.
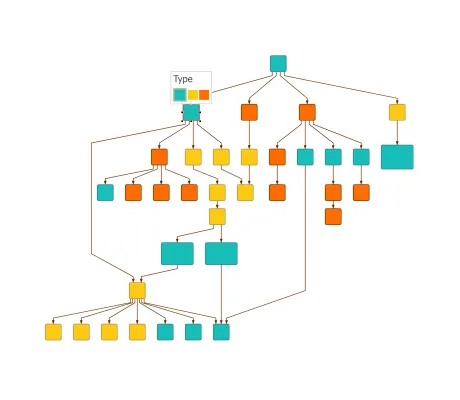
Node Types
Node Types
Shows how different layout algorithms handle nodes with types.
Interactive Hierarchical Layout
Interactive Hierarchical Layout
The from sketch mode of the hierarchical layout style can incrementally fit new nodes and edges into the existing drawing.
Interactive Edge Routing
Interactive Edge Routing
After each edit the edge paths are re-routed if necessary.
Edge Grouping
Edge Grouping
The hierarchical layout can group the paths or ports of edges.
EdgeRouter Grouping
EdgeRouter Grouping
The EdgeRouter can group the paths or ports of edges.
Boundary Labeling
Boundary Labeling
Shows how to configure organic layout for annotating points on a diagram.
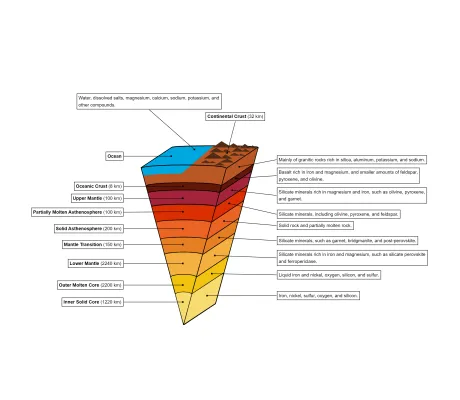
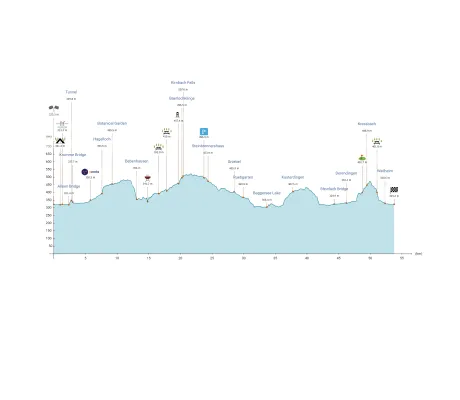
Height Profile
Height Profile
Shows how to configure organic layout to create height profile visualization
Metabolic Pathways
Metabolic Pathways
Shows how to configure organic layout for visualizing metabolic pathways.
Organic Substructures
Organic Substructures
Shows organic layout, and its substructures and node types features.
Circular Substructures
Circular Substructures
Shows circular layout, and its substructures and node types features.
Bus Routing
Bus Routing
Shows how to group edges in bus structures.
Fill Area Layout
Fill Area Layout
Shows how to fill free space after deleting nodes.
Clear Marquee Area
Clear Marquee Area
Shows how to automatically keep a marquee area clear of graph elements.
Clear Rectangle Area
Clear Rectangle Area
Shows how to automatically keep a user-defined rectangular area clear of graph elements.
Node Overlap Avoiding
Node Overlap Avoiding
Shows how an automatic layout can remove node overlaps while a user interactively edits a graph.
Node Alignment
Node Alignment
Shows how to align nodes on horizontal and/or vertical lines.
Hierarchical Grid Components
Hierarchical Grid Components
Grid components in the hierarchical layout result in more compact arrangements.
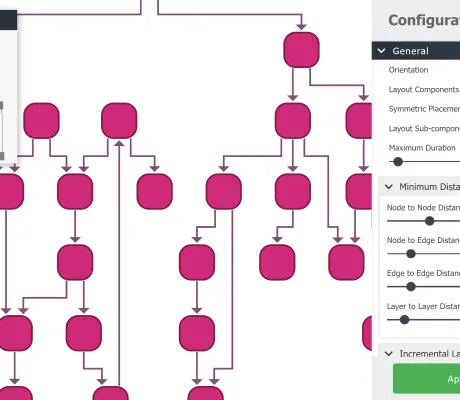
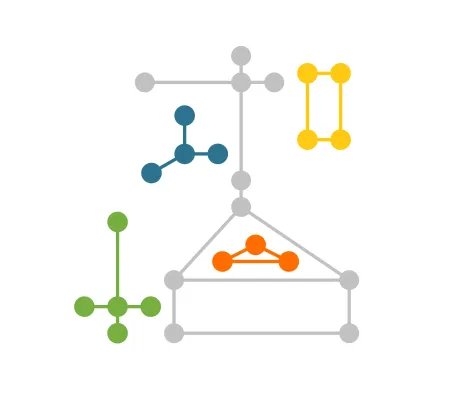
Hierarchical Subcomponents
Hierarchical Subcomponents
The hierarchical layout can arrange subcomponents with different layout styles.
Tabular Groups
Tabular Groups
Shows how to configure the tabular groups feature of the hierarchical layout.
Critical Paths
Critical Paths
The hierarchical and tree layout styles can emphasize critical (important) paths by aligning their nodes.
Custom Layout Stage
Custom Layout Stage
Custom layout stages can be used to solve unique layout problems that are not adequately covered by existing layout algorithms.
Split Edges
Split Edges
Shows how to align edges at group nodes using RecursiveGroupLayout with HierarchicalLayout.
Layout Grid
Layout Grid
Demonstrates the usage of a layout grid for hierarchical and organic layouts.
Simple Layout Grid
Simple Layout Grid
Shows how to create a simple layout grid.
Interactive Graph Restructuring
Interactive Graph Restructuring
Shows how to interactively relocate subtrees from one parent to another.
Layer Constraints
Layer Constraints
Shows how to use layer constraints to prescribe the node layering in hierarchical layouts.
Sequence Constraints
Sequence Constraints
Shows how to use sequence constraints to prescribe the node sequencing in hierarchical layouts.
Interactive Organic Layout
Interactive Organic Layout
Shows the 'interactive organic' layout algorithm.
Multi-Page Layout
Multi-Page Layout
Shows how to divide a large model graph into several smaller page graphs, for example to print to multiple pages.
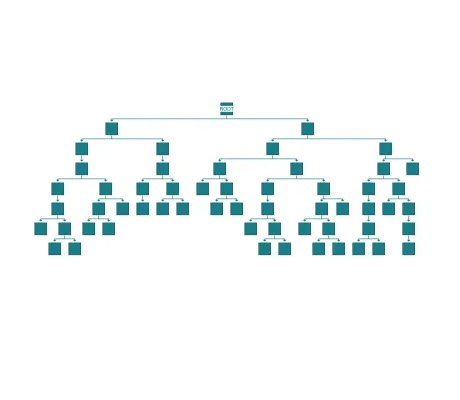
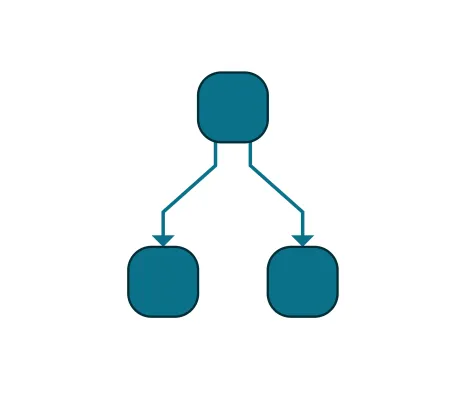
Tree Layout
Tree Layout
Shows how to use different subtree placer in TreeLayout.
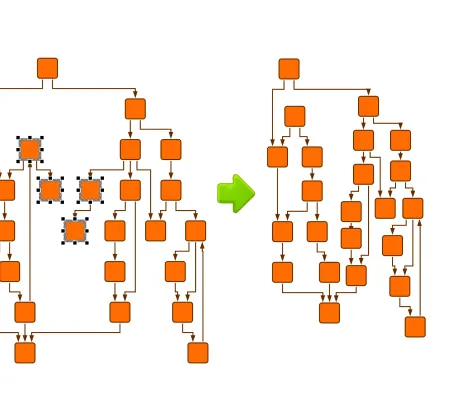
Partial Layout
Partial Layout
Shows how to integrate new graph elements into an existing graph layout.
Bridges
Bridges
Shows the capabilities of the BridgeManager class for inserting bridges into edge paths.
Custom Edge Creation
Custom Edge Creation
Shows how to provide directional ports and demonstrates interactive routing during edge creation.
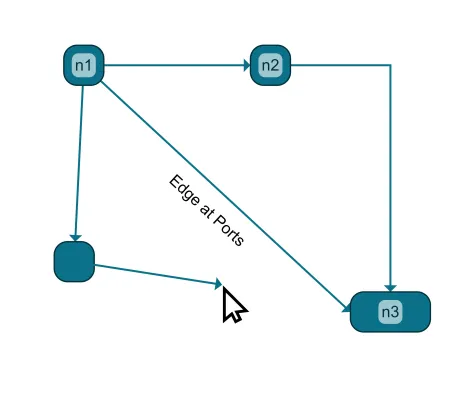
Edge To Edge
Edge To Edge
Shows edge-to-edge connections.
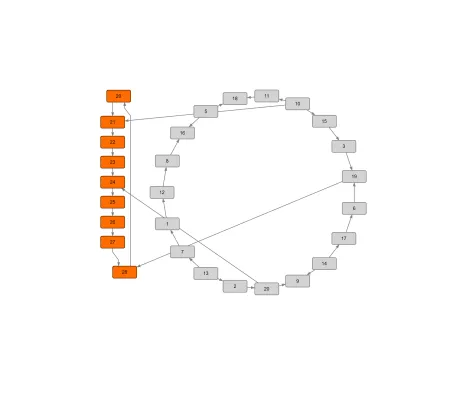
Graph Builder
Graph Builder
Interactively builds and modifies a graph from JSON business data using class GraphBuilder.
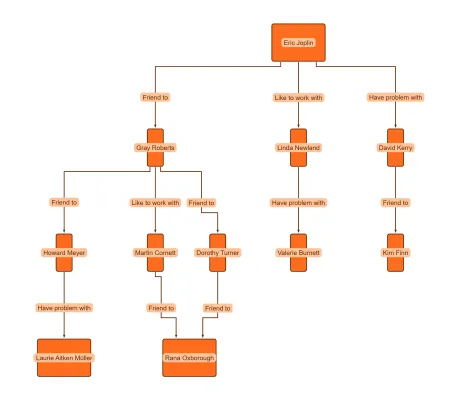
Tree Builder
Tree Builder
Interactively builds and modifies a graph from JSON business data using class TreeBuilder.
Adjacency Graph Builder
Adjacency Graph Builder
Interactively builds and modifies a graph from JSON business data using class AdjacencyGraphBuilder.
Simple Graph Builder
Simple Graph Builder
Automatically builds a graph from JSON business data using GraphBuilder, AdjacencyGraphBuilder or TreeBuilder.
Port-aware Graph Builder
Port-aware Graph Builder
Builds a graph using GraphBuilder and connects the items to specific ports.
Port-aware Adjacency Graph Builder
Port-aware Adjacency Graph Builder
Builds a graph using AdjacencyGraphBuilder and connects the items to specific ports.
Port-aware Tree Builder
Port-aware Tree Builder
Builds a graph using TreeBuilder and connects the items to specific ports.
Image Export
Image Export
Shows how to export the whole diagram or a part of it to a PNG image.
SVG Export
SVG Export
Shows how to export the whole diagram or a part of it to an SVG image.
PDF Export
PDF Export
Shows how to export the whole diagram or a part of it to a PDF.
Printing
Printing
Shows how to print the whole diagram or a part of it.
File Operations
File Operations
Shows different ways to open and save a graph.
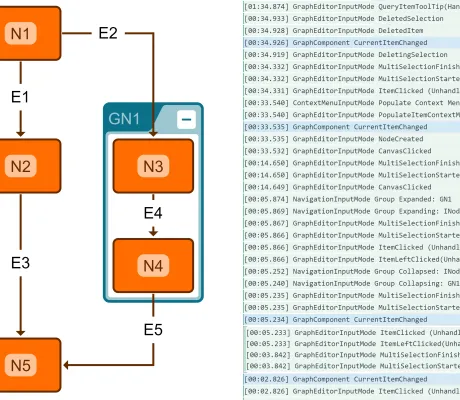
Events Viewer
Events Viewer
Shows the multitude of events provided by the classes IGraph, GraphComponent, and the Input Modes .
WebGL Precompilation
WebGL Precompilation
Shows how to precompile the WebGL styles you want to use
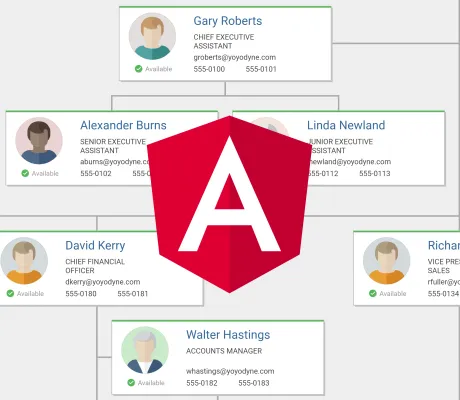
Angular CLI
Angular CLI
Shows how to use yFiles for HTML in an Angular app (Angular 2 and newer) using Angular CLI.
Angular Component Node Style
Angular Component Node Style
Shows how to use an Angular component to visualize graph nodes.
React
React
Shows how to use yFiles for HTML with the React library.
React Class Components
React Class Components
Shows how to integrate yFiles in a basic React application with class components.
React Component Node Style
React Component Node Style
Shows how to use a React component to visualize graph nodes.
Preact
Preact
Shows how to integrate yFiles in a basic Preact application with TypeScript.
Vue
Vue
Shows how to integrate yFiles in a Vue 3 app with TypeScript and Vite.
Vue Component Node Style
Vue Component Node Style
Shows how to use a Vue component to visualize graph nodes.
Svelte
Svelte
Shows how to integrate the yFiles library in a Svelte project.
GraphQL
GraphQL
Shows how to load data from a GraphQL service and display it with yFiles for HTML.
Neo4j
Neo4j
Shows how to load data from a Neo4j database and display it with yFiles for HTML.
Next.js
Next.js
Shows how to use yFiles for HTML with the Next.js library.
SolidJS
SolidJS
Shows how to integrate yFiles in a SolidJS app with TypeScript and Vite.
Node.js
Node.js
Shows how to run a yFiles layout algorithm in a Node.js® environment.
Web Components
Web Components
Shows how to use yFiles for HTML with Web Components v1.
Basic Demo
Basic Demo
A simple demo that you can use as a starting point for your own project.
Rollup.js
Rollup.js
Shows how to bundle the yFiles library in a rollup project.
Web Worker Webpack
Web Worker Webpack
Shows how to run a yFiles layout algorithm in a Web Worker task using Webpack.
Web Worker
Web Worker
Shows how to run a layout in a Web Worker task using module workers.
webpack
webpack
Shows how to integrate the yFiles library in a webpack project.
Vite
Vite
Shows how to integrate the yFiles library in a Vite project.
Vite Lazy Load yFiles
Vite Lazy Load yFiles
Shows how to lazily load yFiles in a Vite project with dynamic imports.
Web Dev Server
Web Dev Server
Shows how to integrate the yFiles library in a Web Dev Server project.
WebdriverIO
WebdriverIO
Shows how to test a yFiles for HTML app in multiple browsers using WebdriverIO.
Cypress
Cypress
Shows how to test a yFiles for HTML app using Cypress.
Jest
Jest
Shows how to test a yFiles for HTML app using Jest.
Jest Puppeteer
Jest Puppeteer
Shows how to test a yFiles for HTML app using Jest with the Puppeteer environment.
Vitest
Vitest
Shows how to test a yFiles for HTML app using Vitest.
Playwright
Playwright
Shows how to test a yFiles for HTML app using Playwright.
Selenium WebDriver
Selenium WebDriver
Shows how to test a yFiles for HTML app using Selenium WebDriver.
Clipboard
Clipboard
Shows different ways of using the class GraphClipboard for Copy & Paste operations.
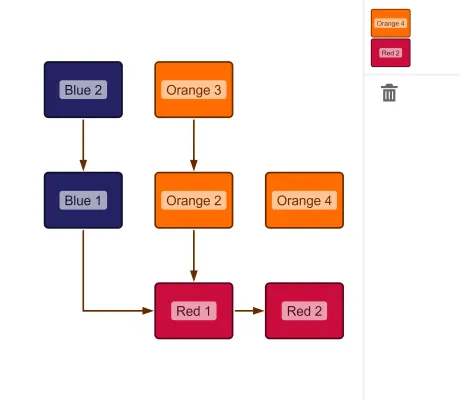
Deferred Cut Clipboard
Deferred Cut Clipboard
Shows a clipboard which grays elements out upon cut and only removes them when they are finally pasted.
Node Selection Resizing
Node Selection Resizing
Shows how to reshape a selection of nodes as one unit.
Custom Label Model
Custom Label Model
Shows how to implement and use a custom label model.
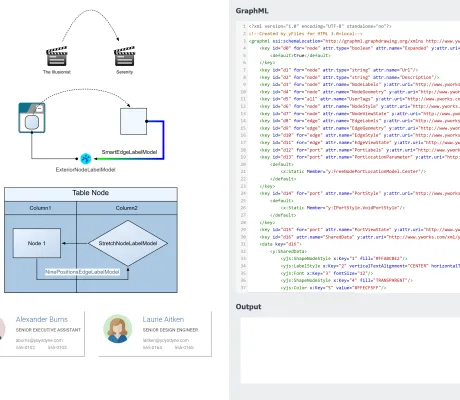
GraphML
GraphML
Provides a live view of the graph's GraphML representation.
Custom Port Location Model
Custom Port Location Model
Shows how to implement and use a custom port location model.
Custom Snapping
Custom Snapping
Shows how the snapping feature can be customized.
Drag From Component
Drag From Component
Shows how to drag graph items out of the graph component to another element.
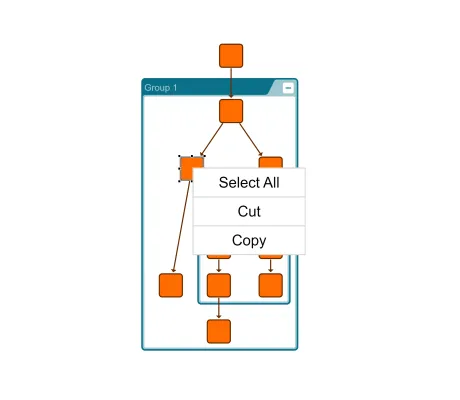
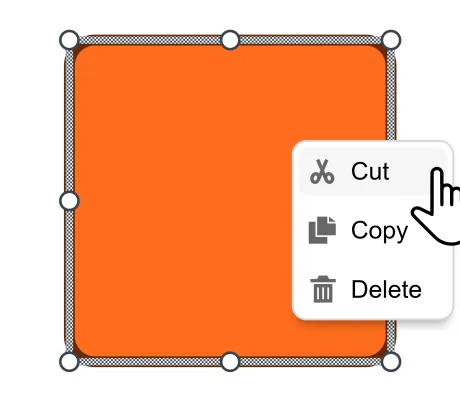
Context Menu
Context Menu
Shows how to add a context menu to the nodes of a graph and to the canvas background.
Simple Drag And Drop
Simple Drag And Drop
Shows how to enable dragging nodes from a panel and drop them into the graph component.
Drag and Drop
Drag and Drop
Shows drag and drop of nodes, groups and labels.
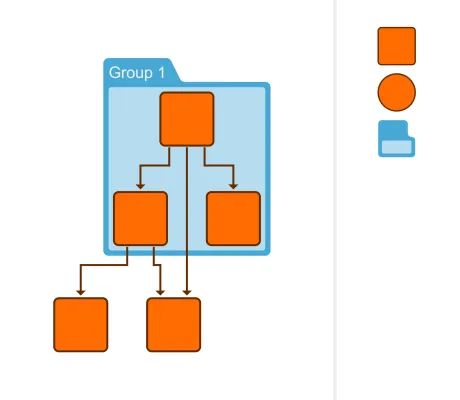
Graph Drag and Drop
Graph Drag and Drop
Shows drag and drop of graphs consisting of multiple items.
Custom Drag and Drop
Custom Drag and Drop
Shows how to change the color of nodes and edges using drag and drop operations.
Edge Reconnection
Edge Reconnection
Shows how the reconnection of edge ports can be customized and restricted.
Label Editing
Label Editing
Shows customizations of the interactive label editing.
Custom Handle Provider
Custom Handle Provider
Shows how to implement custom handles that allow to interactively change the shape of an ArrowNodeStyle.
Label Handle Provider
Label Handle Provider
Shows how to implement custom handles that allow interactive resizing and rotation of labels.
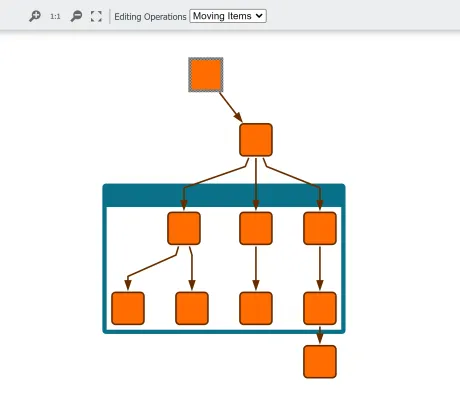
Move Unselected Nodes
Move Unselected Nodes
Shows a special input mode that allows you to move nodes without selecting them first.
Orthogonal Edge Editing Customization
Orthogonal Edge Editing Customization
Shows how to customize orthogonal edge editing.
Port Candidate Provider
Port Candidate Provider
Shows how edge creation can be customized.
Position Handler
Position Handler
Shows how to customize and restrict the movement behavior of nodes.
Reparent Handler
Reparent Handler
Shows how reparenting of nodes can be customized.
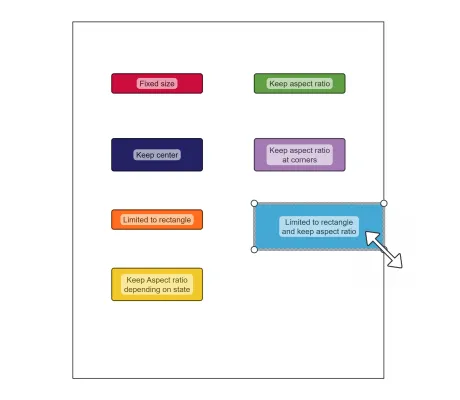
Reshape Handle Provider Configuration
Reshape Handle Provider Configuration
Shows how resizing of nodes can be customized.
Reshape Handle Provider
Reshape Handle Provider
Shows how to add resize handles to ports.
Restricted Editing
Restricted Editing
Shows how to restrict interactive editing with GraphEditorInputMode.
Lasso Selection
Lasso Selection
Shows how to configure a lasso tool for freeform selection.
Marquee Node Creation
Marquee Node Creation
Shows how to customize the MarqueeSelectionInputMode class to create new nodes.
Mouse Wheel Customization
Mouse Wheel Customization
Shows how to customize and enhance the default mouse wheel behavior.
Single Selection
Single Selection
Shows how to configure GraphEditorInputMode for single selection mode.
Size Constraint Provider
Size Constraint Provider
Shows how resizing of nodes can be restricted.
Button Input Mode
Button Input Mode
Shows how to use a custom input mode adding temporary buttons for model items.
Circular Snapping
Circular Snapping
Shows how to enable circular and angle snapping (guidelines) for interactive changes.
Layout Without View
Layout Without View
Shows how to use the graph analysis and layout algorithms without a view and without the IGraph API
Background Image
Background Image
Shows how to add a background visualizations to a graph component.
Building Graphs From Data
Building Graphs From Data
Shows how to build a graph from data in JSON format.
Building Swimlanes From Data
Building Swimlanes From Data
Shows how to build a graph with swimlanes from data in JSON format.
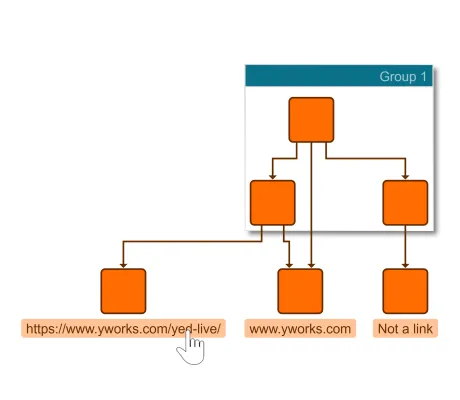
External Links
External Links
Shows how to add labels that act like external links and open in a new window.
Filtering
Filtering
Shows how to configure graph filtering.
Filtering With Folding
Filtering With Folding
Shows how to configure filtering and folding in the same application.
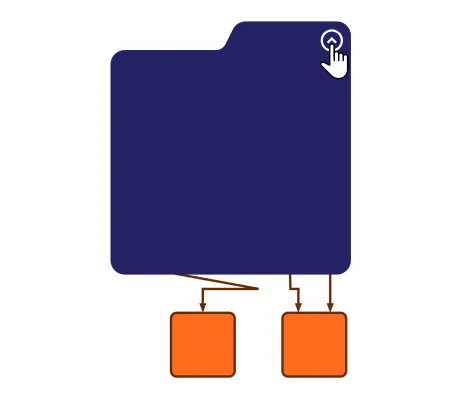
Folding
Folding
Shows how to enable collapsing and expanding of group nodes.
Folding With Merged Edges
Folding With Merged Edges
Shows how to enable the merging of edges when collapsing group nodes.
Graph Copy
Graph Copy
Shows how to copy a graph or parts of a graph.
Graph Decorator
Graph Decorator
Shows how to decorate graph items to change their behavior or visualization.
Simple Highlight Decorator
Simple Highlight Decorator
Shows how to highlight nodes and edges when the mouse hovers over them.
Complex Highlight Decorator
Complex Highlight Decorator
Shows how to highlight nodes with different effects based on data stored in their tags.
Graph Search
Graph Search
Shows how to search for specific nodes in a graph.
Grid Snapping
Grid Snapping
Shows how to enable grid snapping during interactive changes.
Save and Load GraphML
Save and Load GraphML
Shows how to use GraphML input and output.
Custom Data in GraphML
Custom Data in GraphML
Shows how to read and write additional data from and to GraphML.
Label Text Wrapping
Label Text Wrapping
Shows how to enable label text wrapping and trimming.
Native Listeners
Native Listeners
Illustrates how to register native event listeners to a SVG elements of a style.
Orthogonal Edge Editing
Orthogonal Edge Editing
Shows how to enable interactive orthogonal edge editing.
Rectangular Indicator
Rectangular Indicator
Shows how to add an interactive rectangular indicator to the graph component.
Smart Click Navigation
Smart Click Navigation
Shows the how to scroll and zoom to the area of interest by single edge-clicks.
Snapping
Snapping
Shows how to enable snapping (guide lines) for interactive changes.
Subdivide Edges
Subdivide Edges
Shows how to subdivide an edge when a node is dragged on it.
Theming
Theming
Shows how to use a theme to change the look-and-feel of an application.
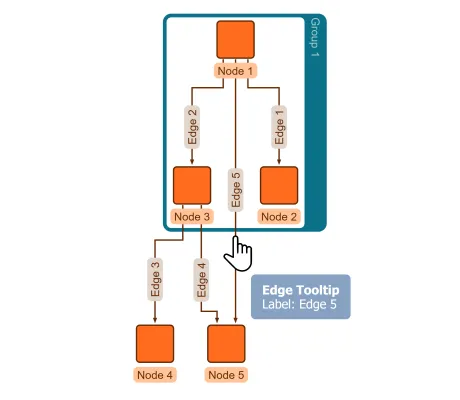
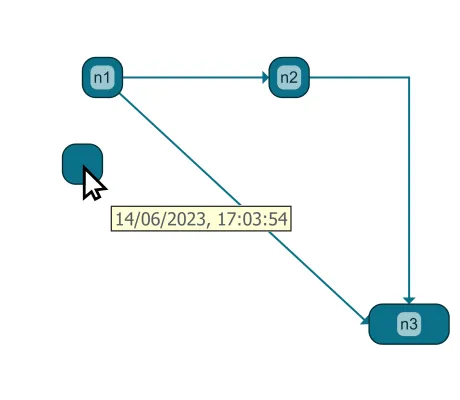
Tooltips
Tooltips
Shows how to enable tooltips for graph items.
Accessibility
Accessibility
Shows how to use the aria-live region to update screen readers.
WebGL Rendering
WebGL Rendering
Shows how to enable the WebGL rendering mode.
Overview Component
Overview Component
Shows how to add an overview component to the application.
Timeline
Timeline
Shows how to add a timeline component to the graph.
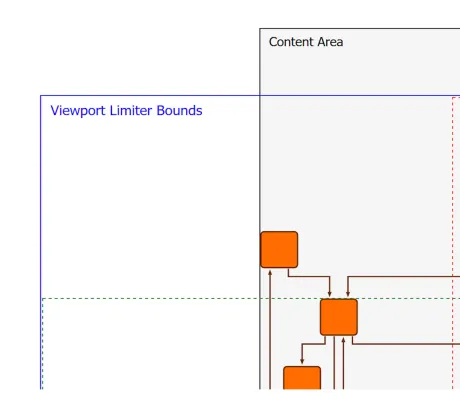
Viewport Limiter
Viewport Limiter
Shows how to use the viewport limiter to constrain the graph navigation.
Hierarchical Layout
Hierarchical Layout
Shows common configuration options for hierarchical layout.
Incremental Hierarchical Layout
Incremental Hierarchical Layout
Shows how to run the hierarchical layout on a predefined set of nodes.
Hierarchical Layout with Node Port Candidates
Hierarchical Layout with Node Port Candidates
Shows how to use node port candidates with hierarchical layout.
Hierarchical Layout with Edge Grouping
Hierarchical Layout with Edge Grouping
Shows how to configure edge grouping for hierarchical layout.
Hierarchical Layout with Given Layering
Hierarchical Layout with Given Layering
Shows how to configure hierarchical layout with a given layering.
Hierarchical Layout with Constraints
Hierarchical Layout with Constraints
Shows how to use constraints to control layering and sequencing in the hierarchical layout.
Hierarchical Layout with Sequence Constraints
Hierarchical Layout with Sequence Constraints
Shows how to use constraints to control sequencing in hierarchical layout.
Hierarchical Layout with Layer Constraints
Hierarchical Layout with Layer Constraints
Shows how to use constraints to control layering in hierarchical layout.
Hierarchical Layout with Node Alignment
Hierarchical Layout with Node Alignment
Shows how to align a set of nodes with hierarchical layout.
Hierarchical Layout with Edge Labeling
Hierarchical Layout with Edge Labeling
Shows how to configure automatic label placement of hierarchical layout.
Compact Groups in Hierarchical Layout
Compact Groups in Hierarchical Layout
Shows how to configure the hierarchical layout such that it yields maximally compact group nodes.
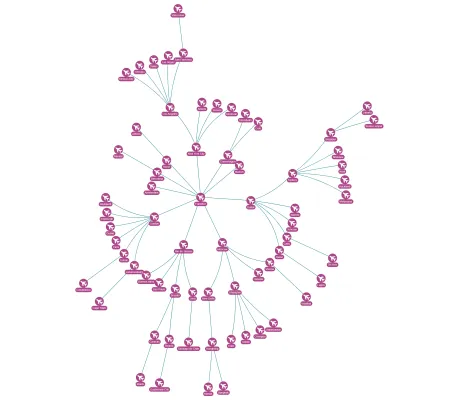
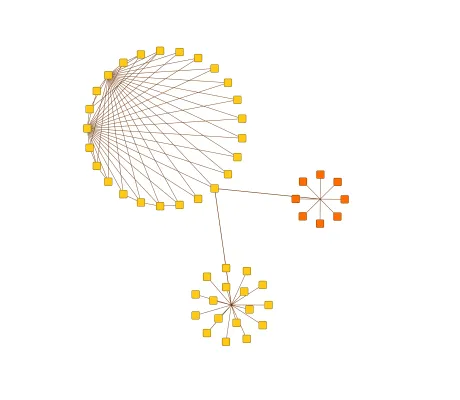
Organic Layout
Organic Layout
Shows common configuration options for organic layout.
Incremental Organic Layout
Incremental Organic Layout
Shows how to run the organic layout on a predefined set of nodes.
Organic Layout with Edge Labeling
Organic Layout with Edge Labeling
Shows how to configure automatic label placement of organic layout.
Organic Layout with Substructures
Organic Layout with Substructures
Shows how to configure the layout of substructures in the organic layout.
Organic Layout with Constraints
Organic Layout with Constraints
Shows how to configure constraints for the organic layout algorithm.
Edge Router
Edge Router
Shows common configuration options for the edge routing algorithm.
Incremental Edge Router
Incremental Edge Router
Shows how to run the edge router on a predefined set of edges.
Edge Router with Buses
Edge Router with Buses
Shows how to configure the edge routing algorithm to produce orthogonal bus-style paths.
Basic Tree Layout
Basic Tree Layout
Shows common configuration options for the tree layout.
Tree Layout with Subtree Placers
Tree Layout with Subtree Placers
Shows how to use different subtree placers in tree layout.
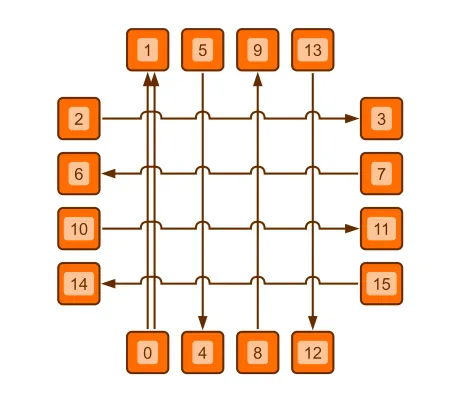
Orthogonal Layout
Orthogonal Layout
Shows common configuration options for the orthogonal layout.
Recursive Group Layout
Recursive Group Layout
Shows how to use different layouts for group nodes using the recursive group layout.
Radial Group Layout
Radial Group Layout
Shows how to configure the radial group layout to arrange grouped graphs.
Compact Disk Groups
Compact Disk Groups
Shows how to configure the compact disk layout to arrange children of group nodes.
Compact Tabular Layout
Compact Tabular Layout
Shows how to configure the tabular layout to create compact drawings
Port Alignment
Port Alignment
Shows how to implement port alignment in hierarchical layout to visualize paths.
Playground: Basic features
yFiles Sandbox Sample
Playground: Basic features
yFiles Sandbox Sample
Explore yFiles' core functionalities in the 'Basic Features' sample.
Playground: My first graph
yFiles Sandbox Sample
Playground: My first graph
yFiles Sandbox Sample
The 'My First Graph' sample introduces yFiles for HTML with a concise code snippet that effortlessly creates and visualizes a random graph in a tree structure.
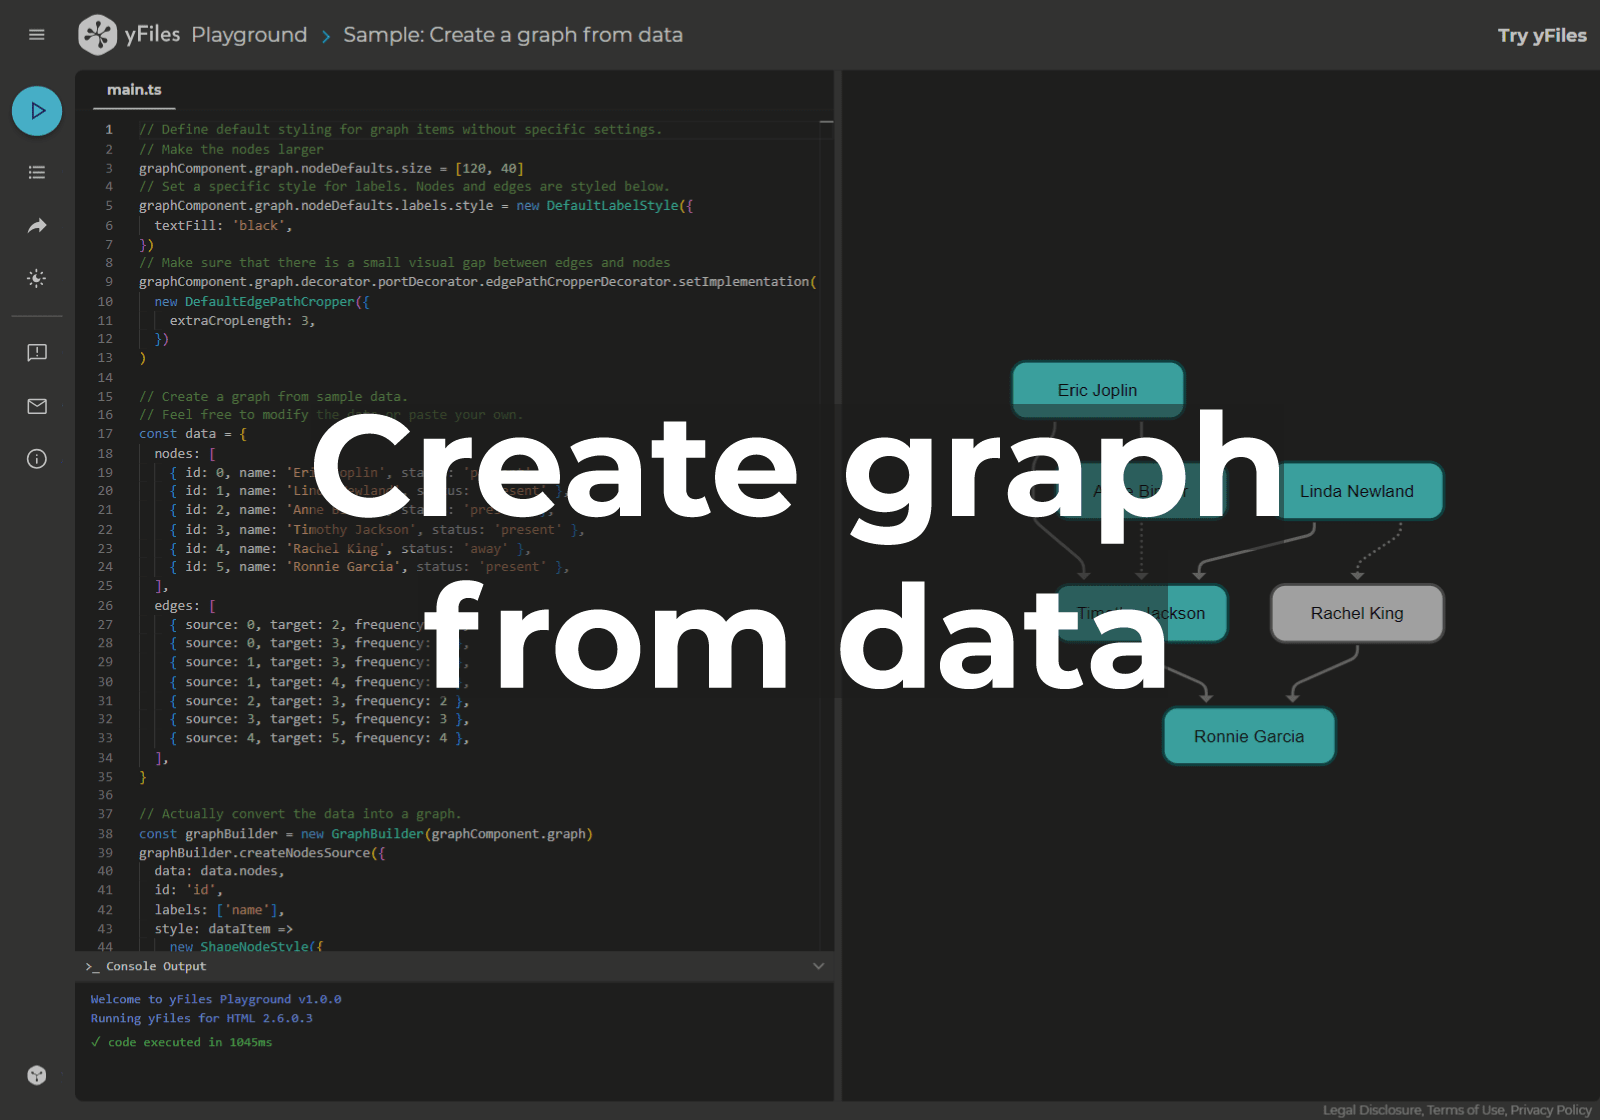
Playground: Create a graph from data
yFiles Sandbox Sample
Playground: Create a graph from data
yFiles Sandbox Sample
In the 'Create a Graph from Data' sample, easily transform raw data into a visually compelling graph.
Playground: Hierarchical Layout
yFiles Sandbox Sample
Playground: Hierarchical Layout
yFiles Sandbox Sample
Discover the potential of hierarchical graph arrangement with the 'Hierarchical Layout' sample.
Playground: Styling the graph
yFiles Sandbox Sample
Playground: Styling the graph
yFiles Sandbox Sample
In the 'Styling the Graph' sample, explore the art of graph aesthetics with yFiles for HTML .
Playground: Graph interaction
yFiles Sandbox Sample
Playground: Graph interaction
yFiles Sandbox Sample
The 'Graph Interaction' sample introduces dynamic interaction to your graph.
Playground: Grouping and folding
yFiles Sandbox Sample
Playground: Grouping and folding
yFiles Sandbox Sample
The 'Grouping and Folding' sample introduces powerful organizational features to your graph.
Playground: Weighted relations
yFiles Sandbox Sample
Playground: Weighted relations
yFiles Sandbox Sample
Explore the 'Weighted Relations' sample from the webinar 'Getting Started: From Data to Graph Visualization'.
Tutorial: Basic Features
Tutorial: Basic Features
Learn about the most commonly used yFiles features.
01 Creating the View
Tutorial: basic features
01 Creating the View
tutorial: basic features
Introduces the GraphComponent class, the central UI element for working with graphs.
02 Creating Graph Elements
Tutorial: basic features
02 Creating Graph Elements
tutorial: basic features
Shows how to create the basic graph elements.
03 Managing Viewport
Tutorial: basic features
03 Managing Viewport
tutorial: basic features
Shows how to work with the viewport.
04 Setting Styles
Tutorial: basic features
04 Setting Styles
tutorial: basic features
Shows how to configure the visual appearance of graph elements using styles.
05 Label Placement
Tutorial: basic features
05 Label Placement
tutorial: basic features
Shows how to control label placement with the help of so called label model parameters.
06 Basic Interaction
Tutorial: basic features
06 Basic Interaction
tutorial: basic features
Shows the default interaction gestures that are provided by class GraphEditorInputMode.
07 Undo Clipboard Support
Tutorial: basic features
07 Undo Clipboard Support
tutorial: basic features
Shows how to use the undo and clipboard features.
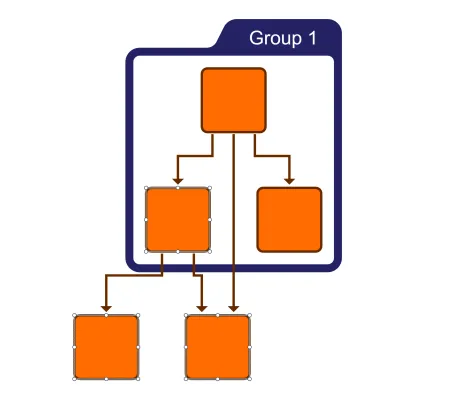
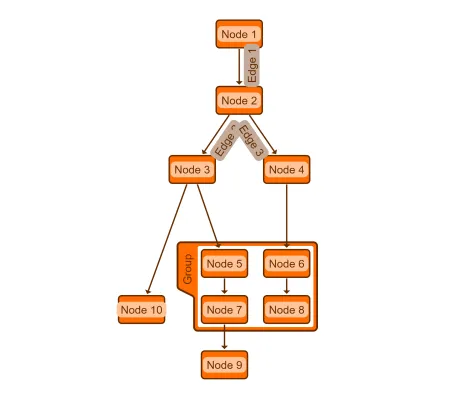
08 Grouping
Tutorial: basic features
08 Grouping
tutorial: basic features
Shows how to configure support for grouped (or hierarchically organized) graphs.
09 Data Binding
Tutorial: basic features
09 Data Binding
tutorial: basic features
Shows how to bind data to graph elements.
10 Layout
Tutorial: basic features
10 Layout
tutorial: basic features
Shows how to use the layout algorithms in yFiles for HTML to automatically place the graph elements.
11 Layout Data
Tutorial: basic features
11 Layout Data
tutorial: basic features
Shows how to configure individual settings for each node for the automatic layout.
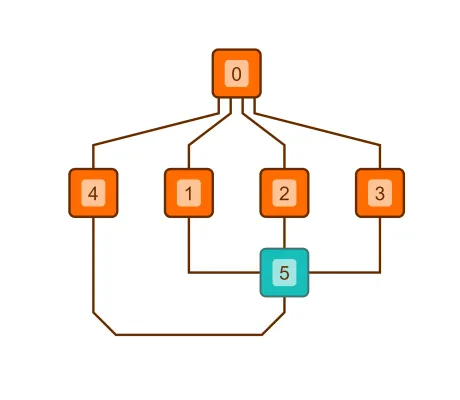
12 Analysis Algorithms
Tutorial: basic features
12 Analysis Algorithms
tutorial: basic features
Shows how to use the graph analysis algorithms.
Tutorial: Graph Builder
Tutorial: Graph Builder
Learn how to convert business data into a graph using the GraphBuilder class.
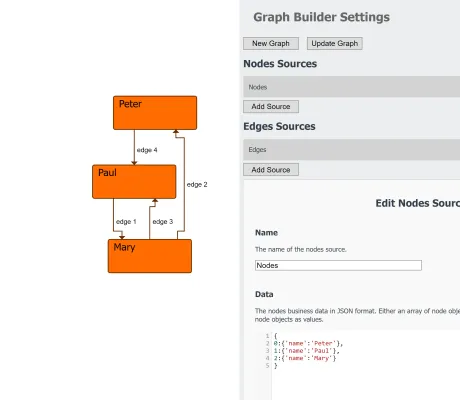
01 Create Graph
Tutorial: graph builder
01 Create Graph
tutorial: graph builder
Introduces the GraphBuilder class which helps to transfer business data into a graph.
02 Create Nodes Sources
Tutorial: graph builder
02 Create Nodes Sources
tutorial: graph builder
Shows how to retrieve nodes from different data sources.
03 Create Edges Sources
Tutorial: graph builder
03 Create Edges Sources
tutorial: graph builder
Shows how to retrieve edges from different data sources.
04 Group Nodes
Tutorial: graph builder
04 Group Nodes
tutorial: graph builder
Shows how to create group nodes to visualize hierarchy information within the business data.
05 Implicit Grouping
Tutorial: graph builder
05 Implicit Grouping
tutorial: graph builder
Shows how to create group nodes implicitly.
06 Configure Styles
Tutorial: graph builder
06 Configure Styles
tutorial: graph builder
Shows how to associate different node and edge styles with the business data.
07 Create Labels Sources
Tutorial: graph builder
07 Create Labels Sources
tutorial: graph builder
Shows how to retrieve labels for nodes and edges from the business data.
08 Configure Labels
Tutorial: graph builder
08 Configure Labels
tutorial: graph builder
Shows how to associate different label styles with the business data.
09 Configure Tags
Tutorial: graph builder
09 Configure Tags
tutorial: graph builder
Shows how to provide the business data in the elements' tags.
10 Configure Layout
Tutorial: graph builder
10 Configure Layout
tutorial: graph builder
Shows how to load positions for graph elements from the business data.
11 Update Graph
Tutorial: graph builder
11 Update Graph
tutorial: graph builder
Shows how to update the graph after incremental changes in the business data.
12 Adjacency Graph Builder
Tutorial: graph builder
12 Adjacency Graph Builder
tutorial: graph builder
Shows how to build a graph from data with implicit relationship information using AdjacencyGraphBuilder.
13 Tree Builder
Tutorial: graph builder
13 Tree Builder
tutorial: graph builder
Shows how to build a graph from tree structured data using TreeBuilder.
Tutorial: Node Style Implementation
Tutorial: Node Style Implementation
Learn how to implement a custom node style using SVG.
01 Create A Rectangle
Tutorial: style implementation node
01 Create A Rectangle
tutorial: style implementation node
Create a simple node style using SVG
02 Create A Custom Shape
Tutorial: style implementation node
02 Create A Custom Shape
tutorial: style implementation node
Create a simple node style with a custom shape using SVG
03 Render Performance
Tutorial: style implementation node
03 Render Performance
tutorial: style implementation node
Optimize rendering performance of an SVG node style
04 Making the Style Configurable
Tutorial: style implementation node
04 Making the Style Configurable
tutorial: style implementation node
Make a custom node style configurable by adding properties
05 Data from Tag
Tutorial: style implementation node
05 Data from Tag
tutorial: style implementation node
Adjust how the node style renders the node using the node business data
06 Rendering Text
Tutorial: style implementation node
06 Rendering Text
tutorial: style implementation node
Adjust the node style to render text defined by the node business data
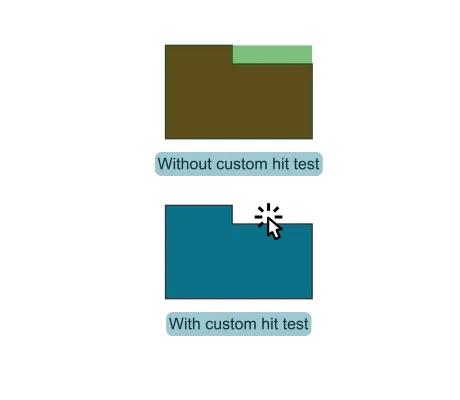
07 Hit-Testing
Tutorial: style implementation node
07 Hit-Testing
tutorial: style implementation node
Customize which area of a node can be hovered and clicked
08 Edge Cropping
Tutorial: style implementation node
08 Edge Cropping
tutorial: style implementation node
Customize where edges at the node are cropped
09 Item Visibility
Tutorial: style implementation node
09 Item Visibility
tutorial: style implementation node
Adjust the visibility check to parts of the node visualization that lie outside of the node bounds
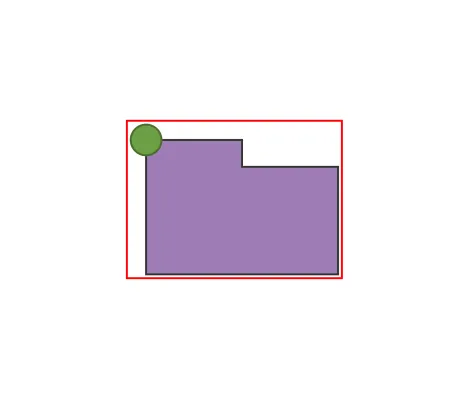
10 Render Boundaries
Tutorial: style implementation node
10 Render Boundaries
tutorial: style implementation node
Adjust the node boundaries to parts of the node visualization that lie outside of the node bounds
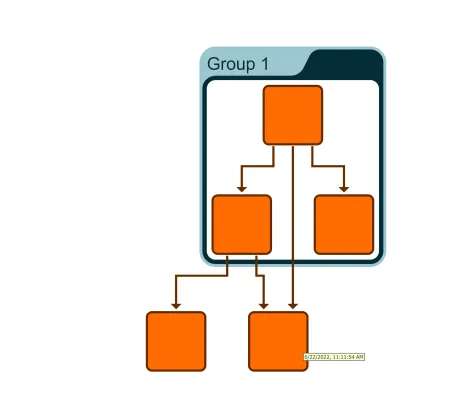
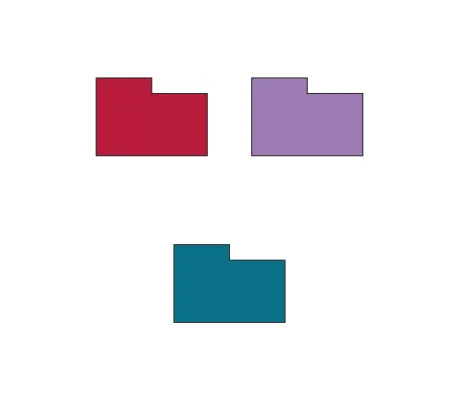
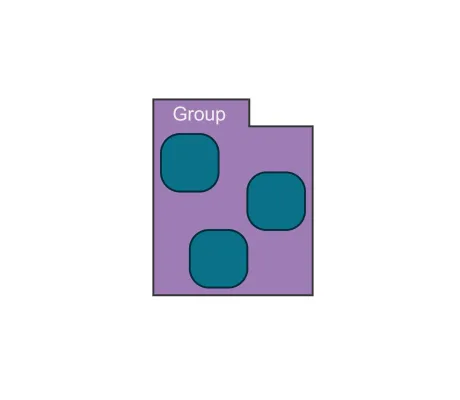
11 Group Node Style
Tutorial: style implementation node
11 Group Node Style
tutorial: style implementation node
Create a basic group node style
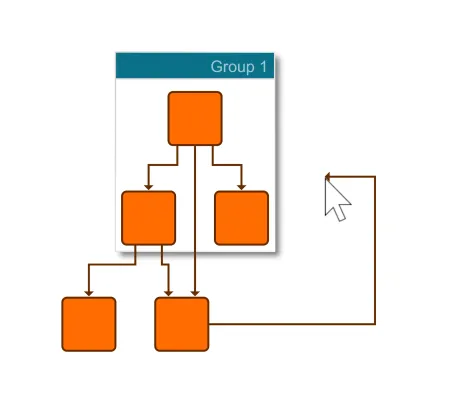
12 Group Node Style Behavior
Tutorial: style implementation node
12 Group Node Style Behavior
tutorial: style implementation node
Adjust the group node style minimum size and size calculation
Tutorial: Label Style Implementation
Tutorial: Label Style Implementation
Learn how to implement a custom label style using SVG.
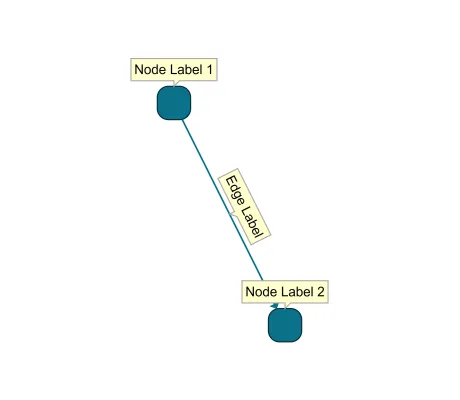
01 Rendering the Label Text
Tutorial: style implementation label
01 Rendering the Label Text
tutorial: style implementation label
Visualize a label using a basic text element
02 Using Text Utilities
Tutorial: style implementation label
02 Using Text Utilities
tutorial: style implementation label
Use convenience functionality to place the text
03 Adding a Background Shape
Tutorial: style implementation label
03 Adding a Background Shape
tutorial: style implementation label
Add a customized background to the label text
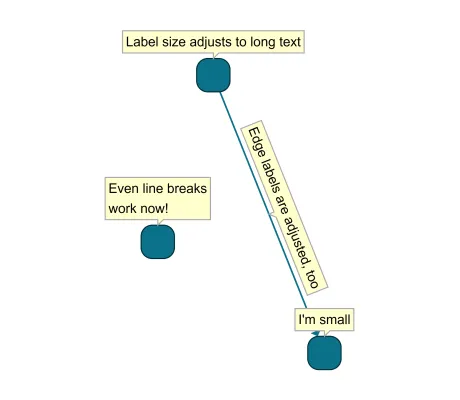
04 Preferred Label Size
Tutorial: style implementation label
04 Preferred Label Size
tutorial: style implementation label
Let the label style set the desired label size
05 Render Performance
Tutorial: style implementation label
05 Render Performance
tutorial: style implementation label
Optimize the render performance of the label style
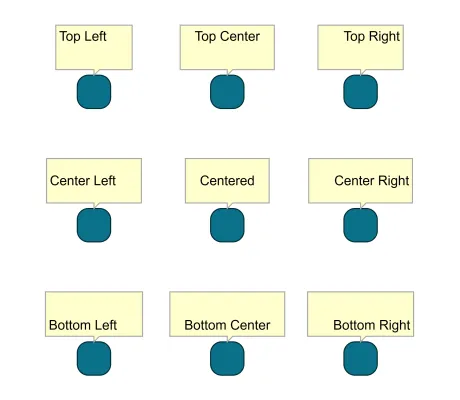
06 Text Alignment
Tutorial: style implementation label
06 Text Alignment
tutorial: style implementation label
Configure horizontal and vertical text alignment inside the label bounds
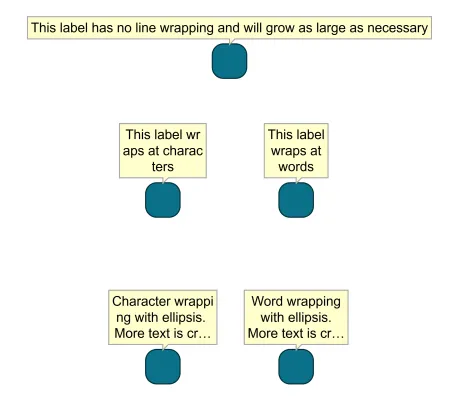
07 Line Wrapping
Tutorial: style implementation label
07 Line Wrapping
tutorial: style implementation label
Add automatic line wrapping to the label style
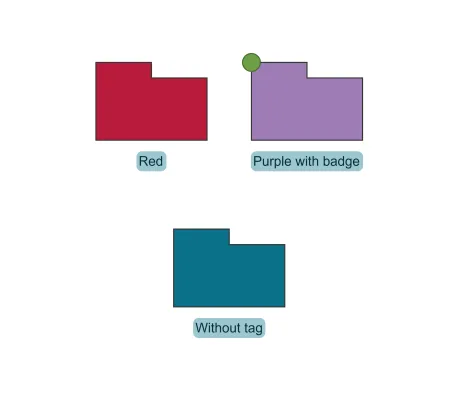
08 Data From Tag
Tutorial: style implementation label
08 Data From Tag
tutorial: style implementation label
Use data from the label tag in the visualization
09 Hit-Testing
Tutorial: style implementation label
09 Hit-Testing
tutorial: style implementation label
Configure which parts of the label visualization are clickable
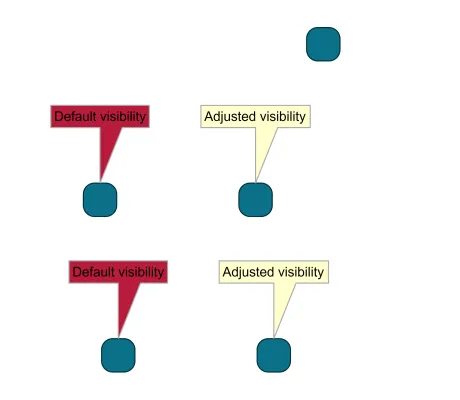
10 Visibility
Tutorial: style implementation label
10 Visibility
tutorial: style implementation label
Adjust the visibility check to parts of the label visualization that lie outside of the label bounds
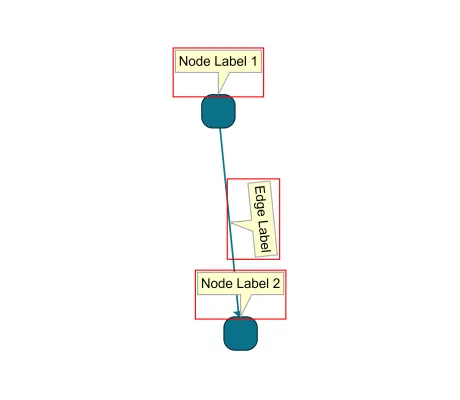
11 Bounds
Tutorial: style implementation label
11 Bounds
tutorial: style implementation label
Adjust the label boundaries to parts of the label visualization that lie outside of the label bounds
Tutorial: Edge Style Implementation
Tutorial: Edge Style Implementation
Learn how to implement a custom edge style using SVG.
01 Create a Polyline
Tutorial: style implementation edge
01 Create a Polyline
tutorial: style implementation edge
Create a simple edge style using SVG
02 Crop the Polyline
Tutorial: style implementation edge
02 Crop the Polyline
tutorial: style implementation edge
Crop the edge path at the outline of its source and target nodes.
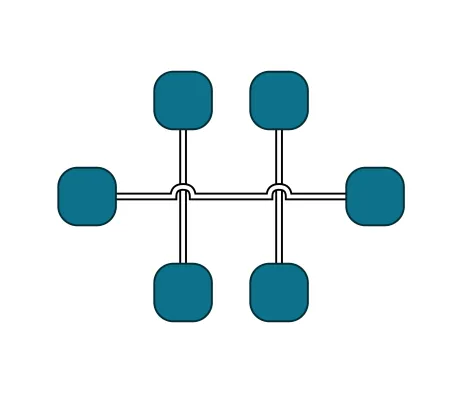
03 Create Parallel Polylines
Tutorial: style implementation edge
03 Create Parallel Polylines
tutorial: style implementation edge
Create parallel polylines for edge visualization.
04 Render Performance
Tutorial: style implementation edge
04 Render Performance
tutorial: style implementation edge
Optimize rendering performance of an SVG edge style
05 Making the Style Configurable
Tutorial: style implementation edge
05 Making the Style Configurable
tutorial: style implementation edge
Make a custom edge style configurable by adding properties
06 Data from Tag
Tutorial: style implementation edge
06 Data from Tag
tutorial: style implementation edge
Adjust how the edge style renders the edge using the edge business data
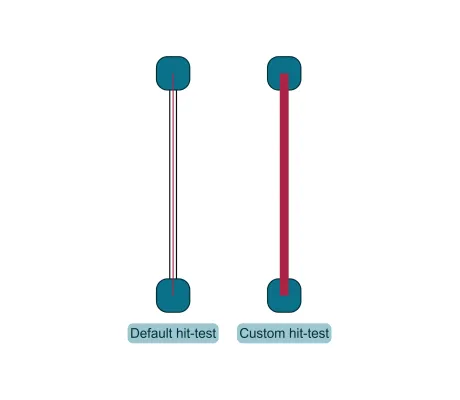
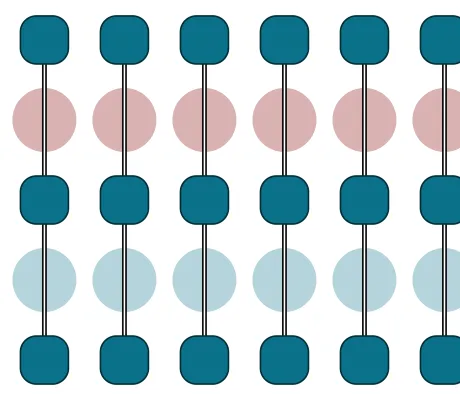
07 Hit-Testing
Tutorial: style implementation edge
07 Hit-Testing
tutorial: style implementation edge
Customize which area of a edge can be hovered and clicked
08 Item Visibility
Tutorial: style implementation edge
08 Item Visibility
tutorial: style implementation edge
Adjust the visibility check to parts of the edge visualization that lie outside of the edge bounds
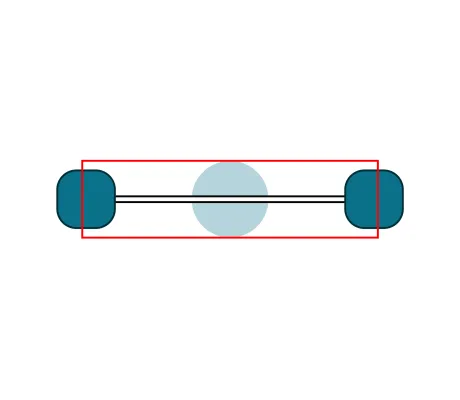
09 Render Boundaries
Tutorial: style implementation edge
09 Render Boundaries
tutorial: style implementation edge
Adjust the edge boundaries to parts of the edge visualization that lie outside of the edge path
10 Bridge Support
Tutorial: style implementation edge
10 Bridge Support
tutorial: style implementation edge
Adjust the edge visualization to resolve the visual ambiguity induced by intersecting edge paths
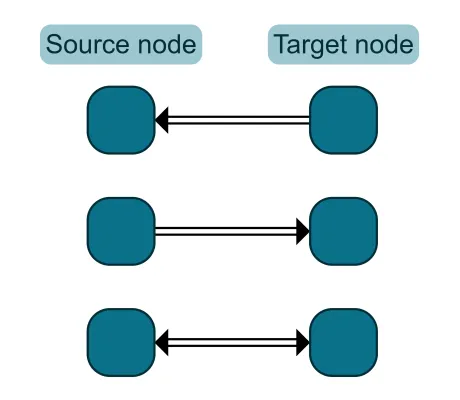
11 Adding Arrows
Tutorial: style implementation edge
11 Adding Arrows
tutorial: style implementation edge
Add arrows to indicate the edge’s direction
12 Custom Arrow
Tutorial: style implementation edge
12 Custom Arrow
tutorial: style implementation edge
Create a custom arrow that matches our edge style
Tutorial: Port Style Implementation
Tutorial: Port Style Implementation
Learn how to implement a custom port style using SVG.
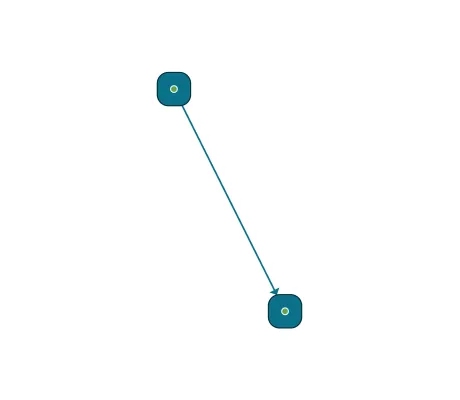
01 Rendering the Port
Tutorial: style implementation port
01 Rendering the Port
tutorial: style implementation port
Visualize a port as a basic circle shape
02 Port Size
Tutorial: style implementation port
02 Port Size
tutorial: style implementation port
Configuring the port size in the style
03 Render Performance
Tutorial: style implementation port
03 Render Performance
tutorial: style implementation port
Optimize rendering performance of an SVG port style
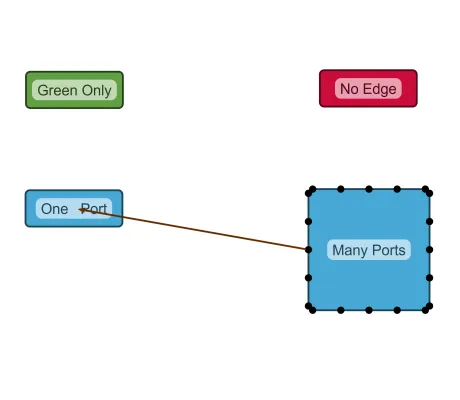
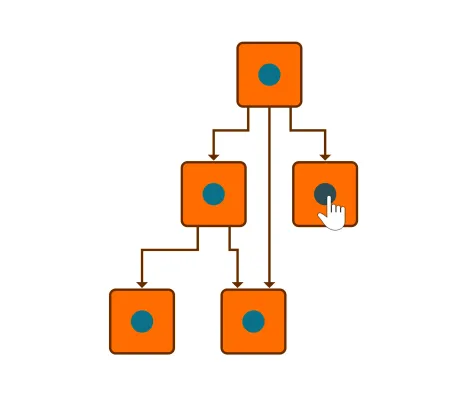
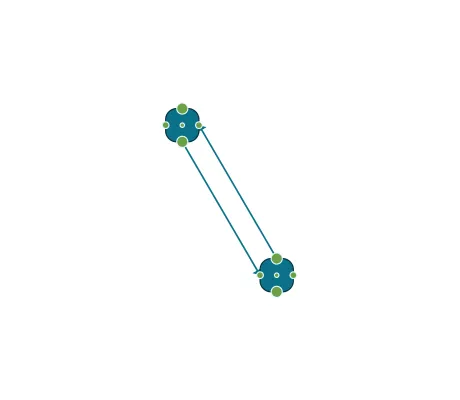
04 Conditional Port Coloring
Tutorial: style implementation port
04 Conditional Port Coloring
tutorial: style implementation port
Set the color of the port based on the number of connected edges
05 Hit-Testing
Tutorial: style implementation port
05 Hit-Testing
tutorial: style implementation port
Customize which area of a port can be hovered and clicked
06 Edge Cropping
Tutorial: style implementation port
06 Edge Cropping
tutorial: style implementation port
Crop the edge at the port outline
Can't find your use case here?
We are confident that yFiles will provide a solution for you anyway.
Get advice from our team!