Quality and quantity. Distance and proximity. These sound like polarities, right? We say “both and”! As we reflect on 2021, collaborative work and visualizing large datasets stand out as diagramming challenges, creatively solved. Of course, we also want to revisit the year’s developments in terms of yFiles, Graphity, and our team. Let’s have a look…
yFiles: smarter, faster, smoother
We continue to apply our expertise – and customer feedback – to develop yFiles further. The 2021 major release of our diagramming SDK was consecutively rolled out for HTML, JavaFX, Java (Swing), WinForms, and WPF. This new version features many new layouts and source-code demos, the new yFiles Dev Suite, even better interaction and visualization (WebGL 2.0 as a new render backend, smoother viewport animations), as well as improved automatic functions (e.g. node-type support, smart incremental edge routing).
 With WebGL 2.0, we were able to smoothly animate a million elements on the screen – with the CPU almost idling.Sebastian Müller, Chief Technology Officer, yWorks
The next yFiles major release, scheduled for 2022, is already keeping our dev team busy. Among other improvements, this release will provide:
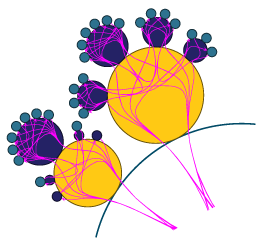
- A new Cactus Tree layout that allows an alternative representation of hierarchically nested data.
- Features for yFiles for Java like smooth animations, node types, smart edge routing.
- Radial and Circular layouts with curved edge routing and integrated ray-like node labeling.
- Support of tabular sub-structures where some nodes model tables containing multiple rows.
Keep an eye on our Twitter or LinkedIn!
 yFiles can handle large graphs, adjusting styles and details to the zoom level. The SDK is very
well-documented and the TypeScript demo was really helpful.
yFiles layout algorithms are the best available.Peter Rakké, Chief Technology Officer, Pandora Intelligence
yWorks customer since 2005
Behind the scenes at yWorks
For 1–2 weeks a year, the office hums with excitement as we dive into “Project Days”, our annual incubator. Small cross-departmental teams form to generate and explore ideas not necessarily connected to our everyday work or our core products. The collaborative editing feature, now available for Graphity, began as a promising concept in 2019! Check out these other “Project Days” innovations: Automatic metro map generation and Optical graph recognition
Stronger – and smarter – together
Good ideas need a supportive environment in order to grow, mature, and bear fruit. A mix of individual focus and collaborative development is often ideal. Successful diagrams are no exception.

Graphity® for Confluence is our powerful diagramming plugin for Atlassian Confluence®. In October, we released Graphity 2.0. This major update enhances diagram editing with real-time collaboration. No more awkward discussions about who is going to make which changes – and no accidental overwriting of other peoples’ edits. Team members simply start working together and each can see what the others are doing. This collaborative editing feature is an optional free component available with Graphity.
Graphity 2.0 delivers additional new features, including:
Have a look at the Graphity release notes, revisit our collaborative editing webinar, and explore the Graphity sandbox.
Then let us know what you think!

Who uses Graphity?
Graphity® for Confluence is popular on every continent – and across sectors, too. Youth organizations (scouts), university research institutes, and top tech companies all appreciate our intuitive diagram editor. Try the new collaborative editing feature.
Tübingen, home of the graphs
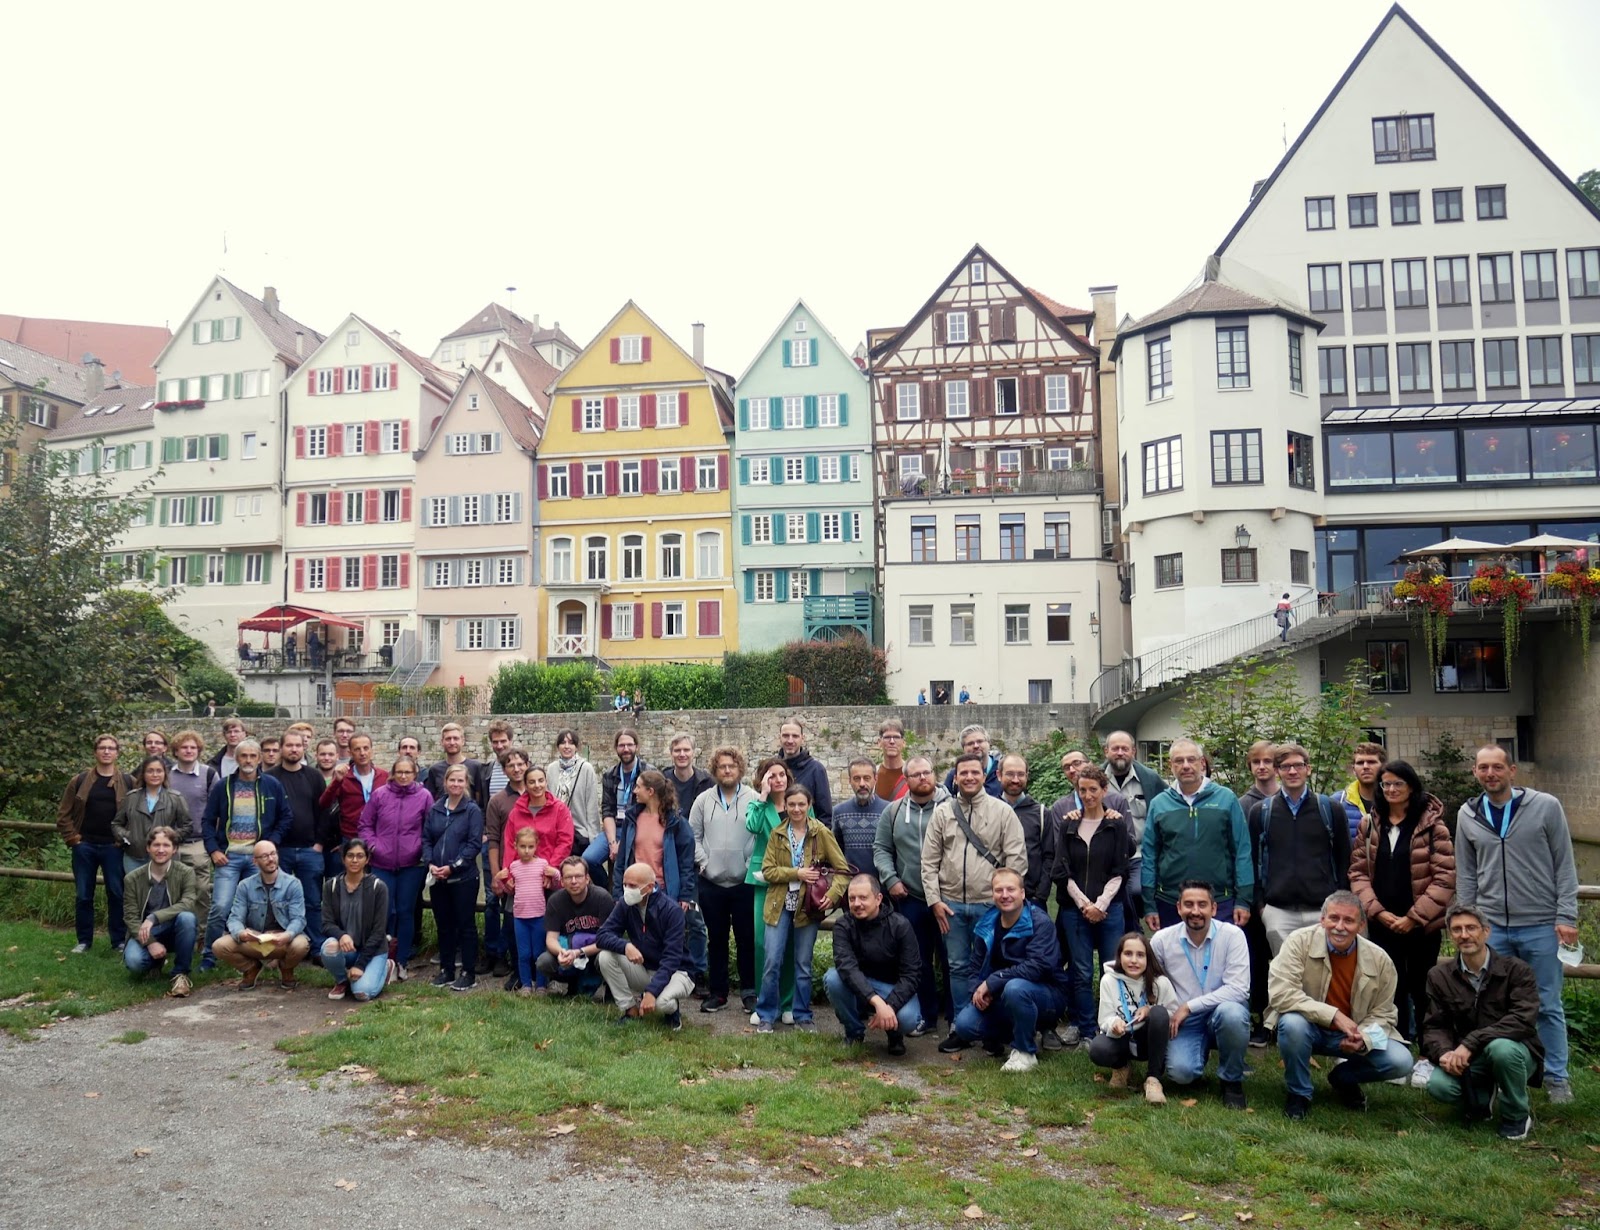
A major annual event took place in our hometown this year! The 29th International Symposium on Graph Drawing and Network Visualization (“Graph Drawing”) was hosted by the University of Tübingen. We proudly returned as a platinum sponsor – and happily provided on-site support, as well. Graph Drawing was smaller this year, due to the ongoing global pandemic, but a new hybrid format let us welcome participants from around the world. A good time was had by all, and the future of dataviz looks bright! In 2022, the popular conference will be held in a vastly different setting: Tokyo, Japan.
“Fresh air” and “fine wine”

yWorks grew steadily this year, making us very happy. New colleagues brought fresh energy and talent to every department: Research & Development, Consulting, Marketing, and Administration. Welcome, newbies! We’re so glad you’re here.
And four of our most seasoned experts celebrated their “workiversaries” in 2021: 15 + 10 + 15 + 10 years = a half-century of yWorks power We say CHEERS to your dedication, terrific achievements, and steady enthusiasm!
Can you guess...
...this year's most popular blog post? Click here
With the data nicely laid out, and the diagram elements clearly visualized, we can grasp a lot of information at a glance.
...or the all-time favorite post? Have a look
If you need to display tens of thousands of elements at the same time, WebGL can be a real life-saver.
The yFiles SDK has the features and documentation we need, and core developers provide excellent support.
So we can focus on solving business-specific problems rather than building a visualization library from scratch.Philipp Wostry, Software Developer, Airbus
yWorks customer since 2020
Collaboration is key
As we look back on the year, we’re thinking of our customers, partners, and teammates who made 2021 so inspiring and fruitful. MANY THANKS to everyone who supported yWorks products and initiatives. Keep the questions coming, and let’s keep collaborating in 2022!
We wish you all a healthy and successful new year.
Happy diagramming!
Your diagramming experts
yWorks


