Products
Downloads
Demos
RSS Newsfeed
2020-6-22
Graphs can change children’s lives
Visualizations can be found in places where you would not expect them in the first place. Diagrams can help social workers to find permanent homes for foster children.
2020-6-9
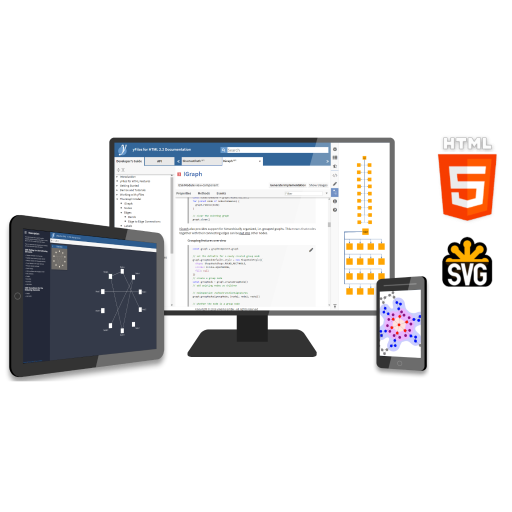
yWorks releases version 2.3 of yFiles for HTML!
The year 2020 releases of the diagramming software libray family yFiles come with an impressive number of new features. Come and find out more about the highlights in this article.
2020-5-18
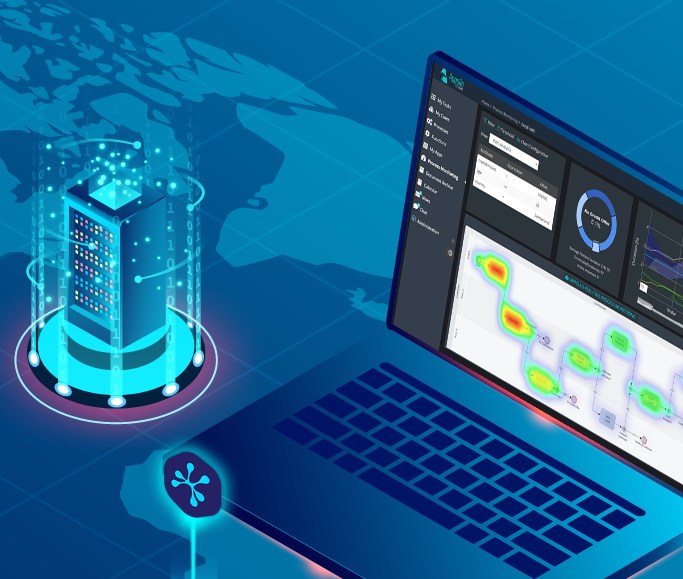
Case Study: Visualizing Digital Innovation
How Appollo Systems used yFiles to create the first low-code development platform for visual business analyses and optimization on the market.
2020-2-26
The Story behind the yWorks Logos
For almost 20 years now, we are in love with visualizations and graphs! So much so, that parts of our new Corporate Design were made with a tool built with our #yFiles diagramming SDK! You can read more about yFiles and the history of our logo here.
2020-2-4
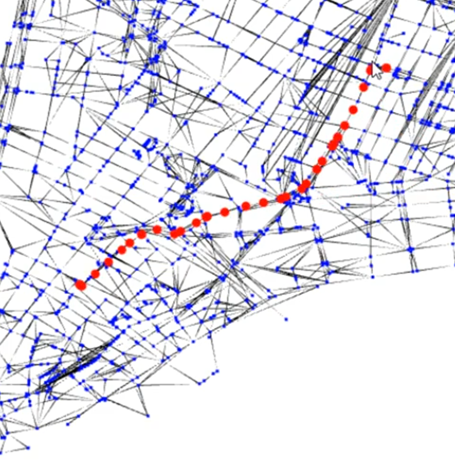
Hackathon at Stackoverflow Offices
During the GraphConnect 2018, we took part in a hackathon all around Neo4j at the offices of Stack Overflow and helped to build a Manhattan-based geospatial data visualization.
2019-8-7
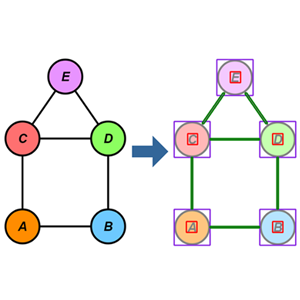
Recognizing graphs from images
A project on optical graph recognition with OpenCV and yFiles WPF.
2019-6-5
Case Study: Intelligent Data Provision in the Automotive and Rail Industries
How Austrian researchers are rethinking automotive R&D using data visualization and yFiles. In a research project, VIRTUAL VEHICLE develops a prototypical digital decision-making basis: a graph database for data collection and an application for visualizing and navigating the connected data.
2019-4-11
yWorks releases version 2.2 of yFiles for HTML!
2018-11-15
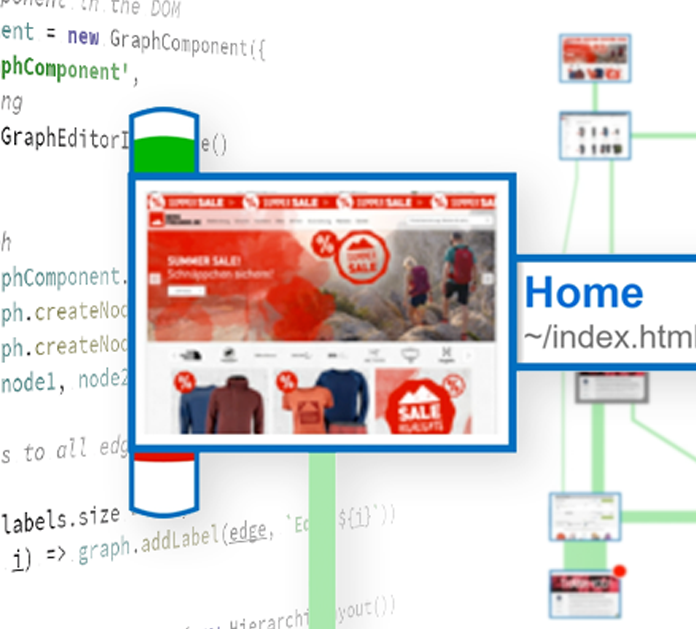
yFiles and Neo4j: Custom Visualization Solutions
Your database contains valuable data. Use custom visualization solutions to get the most out of it!
2018-9-17
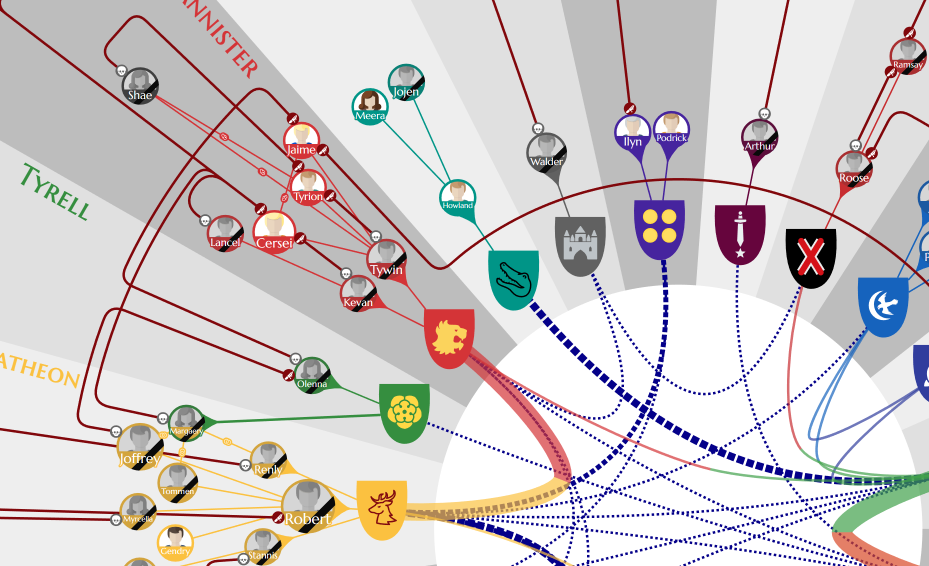
‘Game of Thrones’ Relationship Graph
yWorks’ submission to the Graph Drawing Contest 2018 in Barcelona, Spain
1
...
3
4
5
...
16
Latest Blog Posts
From Experiments to Agents: How yWorks Uses AI to Democratize Graph Visualization
Making AI-generated diagrams useful and interactive
Enabling LLM development through knowledge graph visualization
Maximizing the value of large graphs through collapsing techniques
Creating Graph Visualizations by prompting Large Language Models
Use Cases
Business process management
Company structures
Data management
Supply chain management
Test and experience
yFiles free
of charge!
Free support
Fully functional
100+ source-code examples
Try now